In this tutorial Open Telemetry tracing capabilities will be added to a Spring Boot application. We will use an existing application from this repository, and export traces to both OCI Application Performance Monitoring and Azure Application Insights using Oracle JDBC Open Telemetry Provider combined with zero code instrumentation from either APM Java Agent, Open Telemetry Java Agent or OpenTelemetry Spring Boot starter for OCI APM, and Application Insights agent for Azure Application Insights. Zero code instrumentation injects bytecode to capture telemetry from many popular libraries and frameworks, Oracle JDBC Open Telemetry Provider implements Oracle Database JDBC driver’s TraceEventListener interface and traces application and system tracing events such as roundtrips made to the database.
Open Telemetry is an open-source observability framework for instrumenting, generating, collecting, and exporting telemetry data such as traces, metrics, and logs. Exporting telemetry data to observability frontends such as OCI APM and Azure Application Insights allows to monitor applications, get automatic alerts on performance, availability, and load analysis, diagnose transactions, and analyze application behavior.
Prerequisites
The following prerequisites are needed:
- An OCI subscription
- An Azure subscription
- An Oracle Database
Configure the application to use Oracle JDBC OpenTelemetry Provider
- Clone the spring-appstack branch of the github.com/oracle/oci-react-samples repository.
git clone -b spring-appstack https://github.com/oracle/oci-react-samples.git
-
Add a dependency on Oracle JDBC Open Telemetry Provider by editing the pom.xml file and adding the following lines:
<dependency>
       <groupId>com.oracle.database.jdbc</groupId>
       <artifactId>ojdbc-provider-opentelemetry</artifactId>
       <version>1.0.2</version>
    </dependency>
-
Edit the application.properties files to set the database url, username and password properties. Make sure to add the “oracle.jdbc.provider.traceEventListener” so that the Oracle JDBC Open Telemetry Provider is used.
spring.datasource.url=jdbc:oracle:thin:@***?oracle.jdbc.provider.traceEventListener=open-telemetry-trace-event-listener-provider
    spring.datasource.username=SCOTT
    spring.datasource.password=***
- Note that the Oracle JDBC Open Telemetry Provider registers an MBean that allows to manage the behavior of the provider. The following operations are allowed:
- Enable/Disable sensitive data from being exported (by default no sensitive data is exported)
- Enable/Disable the provider (the provider is enabled by default).

Using OCI Application Performance Monitoring
We will start by creating an APM domain. This can be done either in Oracle Cloud Infrastructure console or using the Oracle Cloud Infrastructure command line interface (CLI). The detailed instruction on how to create an APM domain can be found on this page.
- Add zero-code open telemetry instrumentation to the application. You can chose between downloading the a observability java agent that dynamically manipulates application bytecode, with OCI APM you can either use the Open Telemetry Java agent or APM Java Agent, or using the Open Telemetry Spring Boot Starter that leverages spring autoconfigure to install library instrumentation. To use the Spring Boot Starter add the following dependency to the pom file:
<dependencyManagement>
      <dependencies>
        <dependency>
          <groupId>io.opentelemetry.instrumentation</groupId>
          <artifactId>opentelemetry-instrumentation-bom</artifactId>
          <version>2.11.0</version>
          <type>pom</type>
          <scope>import</scope>
        </dependency>
      </dependencies>
    </dependencyManagement>

    [...]

    <dependency>
      <groupId>io.opentelemetry.instrumentation</groupId>
      <artifactId>opentelemetry-spring-boot-starter</artifactId>
    </dependency>
- If using Open Telemery Java Agent or the Open Telemetry Spring Boot Starter configure it to use the newly created APM domain by setting the following environment variables (you can also use system properties).
| Environment variable | Value |
| OTEL_KEY | dataKey data_key |
| OTEL_TRACES_EXPORTER | otlp |
| OTEL_SERVICE_NAME | my-todo-app |
| OTEL_EXPORTER_OTLP_TRACES_PROTOCOL | http/protobuf |
| OTEL_EXPORTER_OTLP_TRACES_ENDPOINT | traces_endpoint |
| OTEL_METRICS_EXPORTER | none |
| OTEL_LOGS_EXPORTER | none |
- data_key: can be set to either the public or private data key.

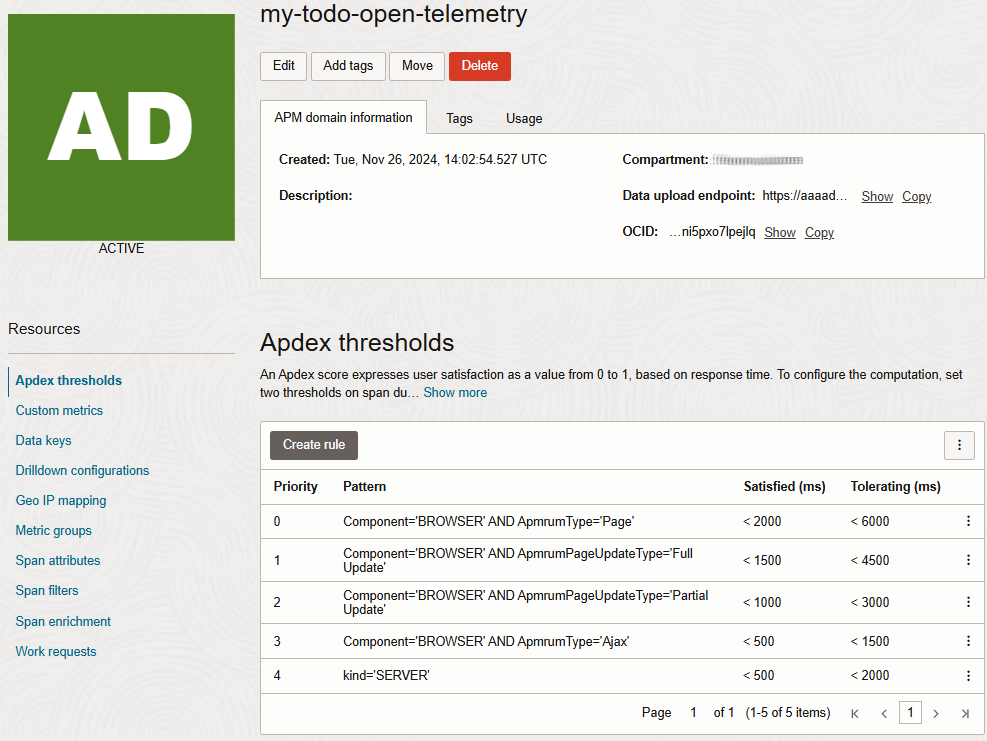
- traces_endpoint: the endpoint depends on wether you chose to use the public or private data key. The image below shows were to find the data upload entrypoint.
- If you chose to use the private key set the OTEL_EXPORTER_OTLP_TRACES_ENDPOINT environment variable to:
export OTEL_EXPORTER_OTLP_TRACES_ENDPOINT=https://<dataUploadEndpoint>/20200101/opentelemetry/private/v1/traces
- If you chose to use the private key set the OTEL_EXPORTER_OTLP_TRACES_ENDPOINT environment variable to:
export OTEL_EXPORTER_OTLP_TRACES_ENDPOINT=https://<dataUploadEndpoint>/20200101/opentelemetry/public/v1/traces
- If you chose to use the private key set the OTEL_EXPORTER_OTLP_TRACES_ENDPOINT environment variable to:

- If you are using the APM Java Agent provision the Java Agent using the mandatory parameters and make sure to also set the “com.oracle.apm.agent.otel” property to to “true”:
java -jar ./apm-java-agent-installer-<version>.jar provision-agent -service-name=my-todo-app -destination=<path-to-agent> -private-data-key=<data_key> -data-upload-endpoint=<traces_endpoint> -property=com.oracle.apm.agent.otel=true
- Build the application.
mvn install
- Start the application using that java agent:
- When using the Open Telemetry Java Agent:
java -jar -javaagent:<path-to-agent>/opentelemetry-javaagent.jar mytodolist-0.0.1-SNAPSHOT.jar
- When using the APM Java Agent:
java -jar -javaagent:<path-to-agent>/bootstrap/ApmAgent.jar mytodolist-0.0.1-SNAPSHOT.jar
- When using the Open Telemetry Spring Boot starter:
java -jar mytodolist-0.0.1-SNAPSHOT.jar
- When using the Open Telemetry Java Agent:
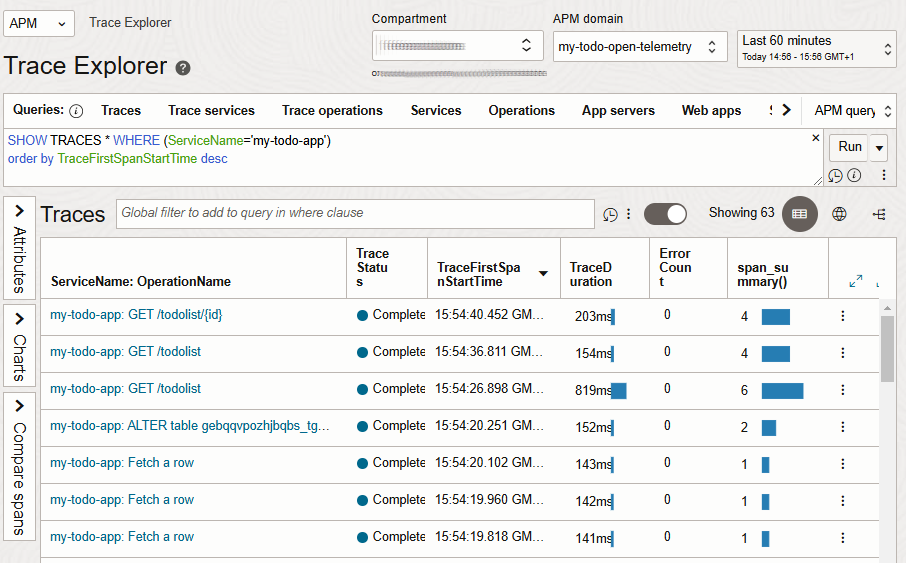
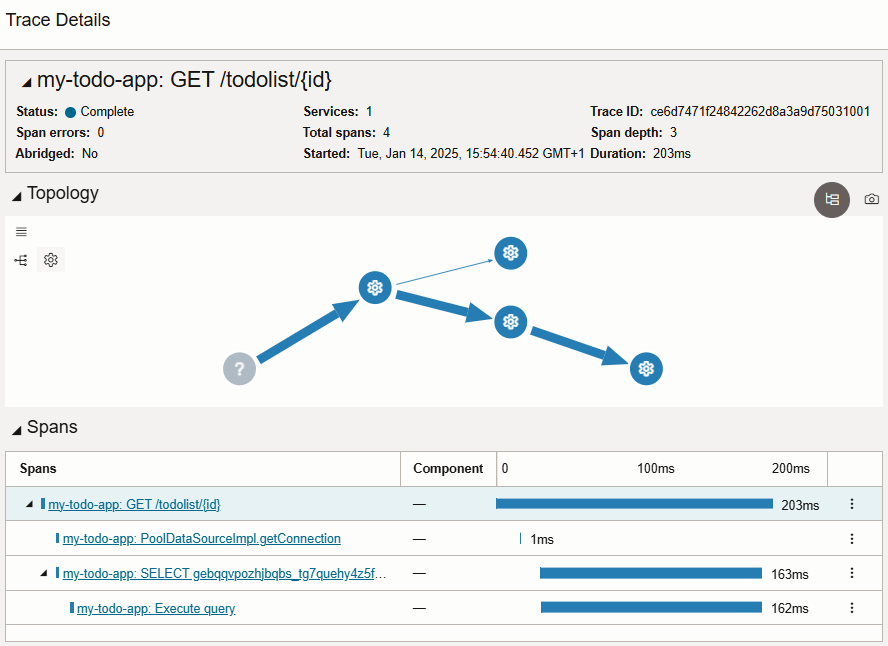
- Traces should start flowing into your Application Insights resource (this can take a few minutes).
Using Azure Application Insights
We will start by creating the Azure Application Insights resource that will be used to monitor the web applicaton. This can be done in the Azure Portal, using Azure CLI, Azure PowerShell or an Azure Resource Manager template. The detailed instruction on how to create an Azure Application Insights resource can be found on this page.

- Download the Application Insights Java agent this will add Open Telemetry Instrumentation to the application.
- Copy the connection string from Application Insight resource and paste its value into the APPLICATIONINSIGHTS_CONNECTION_STRING environment variable.
export APPLICATIONINSIGHTS_CONNECTION_STRING=InstrumentationKey=***;...

- Build the application
mvn install
- Download the application insights Java agent, and start the application using that java agent:
java -jar -javaagent:<path-to-agent>/applicationinsights-agent-<verison>.jar mytodolist-0.0.1-SNAPSHOT.jar
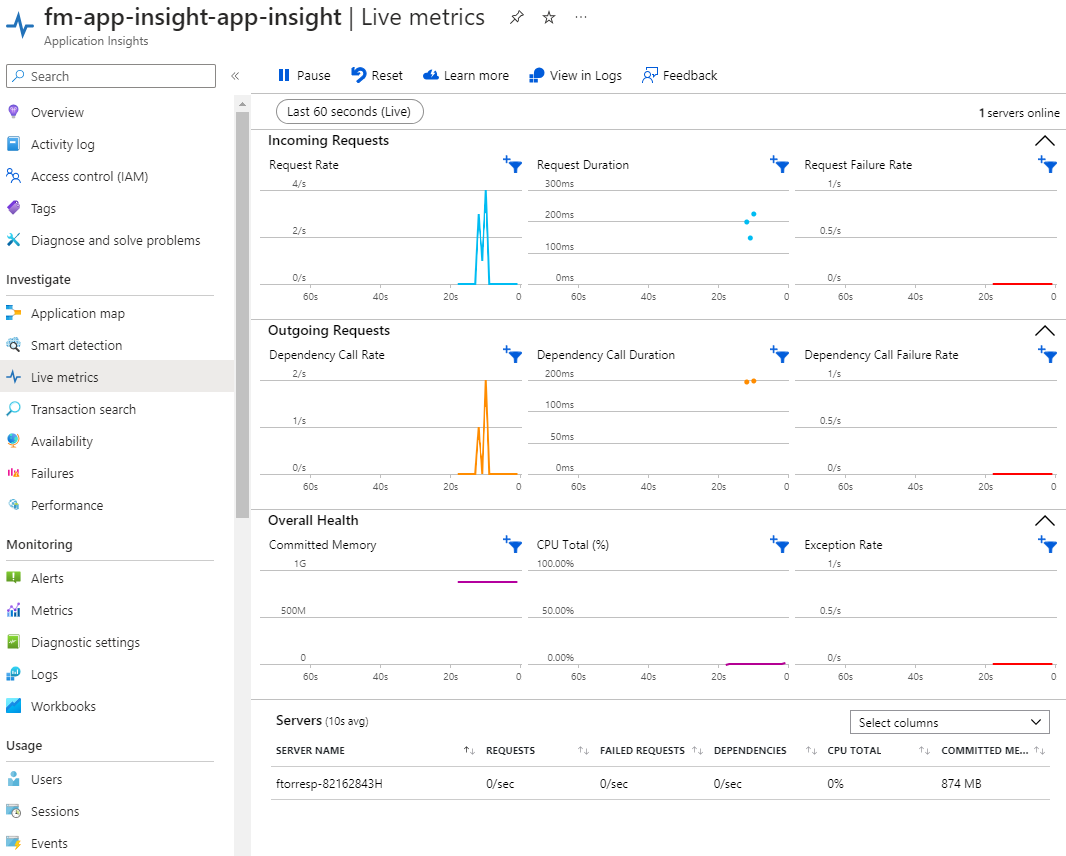
- Traces should start flowing into your Application Insights resource (this can take a few minutes).
Conclusion
This article shows that very few steps are needed to add observability to a Spring Boot application and export traces to different cloud observability services. The Oracle JDBC Open Telemetry provider adds insights into the Oracle JDBC driver’s round trip to the database. Observability services allow to monitor the application, analyse its behavior and diagnose problems.
The steps to add observability to an application are:
- Add the Oracle JDBC Open Telemetry provider to the classpath and configure the application to use the provider by setting the connection property (this property can be set in the connection URL).
- Configure the java agent (the steps to configure the agent depend on the observability service).
- Start the application using the java agent.