Overview
In an earlier blog we saw how users can easily query the Autonomous Database for analysis using an Excel Add-in.
We are excited to announce a similar add-in for Google Sheets. This new add-in will enable users to run native SQL queries and a wizard to query Analytic Views created by the Data Analysis tool.
Setup
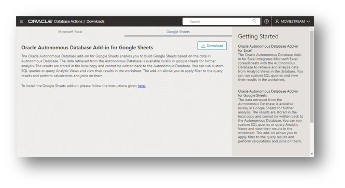
Follow the steps outlined in the documentation to install the Add-in for Google Sheets downloaded from the Database Actions page.
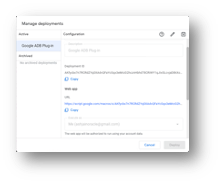
Here I will take you thru the OAUTH client setup for connecting Google sheets to the Autonomous Database after installing the Add-in. As a pre-requisite you will need the Web app URL of the application deployed in Google Sheet.
To create an OAUTH client, you can append /oauth after the schema name of the Autonomous Database URL. For eg: https://fqdn/ords/moviestream/oauth
Click on the button to create a new client and provide the following details:
Name for the client, optional logo, description, flow as “AUTH_CODE”, response type as “CODE”, Redirect URI is the URL of the google scripts web app deployed in the previous step, support email, support URI and leave the required privileges as blank.
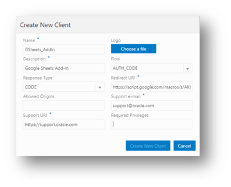
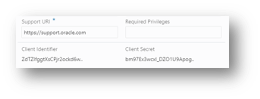
Click on Create New Client button to create the client. Now navigate to the client created and click the edit icon to get the Client Identifier and Client Secret.

Now you are ready to use Google Sheets to query the Autonomous database.
Connect to the Autonomous Database
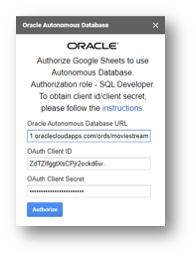
On the google Sheet you should now see a new ribbon item with the name “Ask Oracle”. Click on the “Register” button.

Provide the information captured earlier (ADB URL, Client ID and Client Secret) and click “Authorize”.
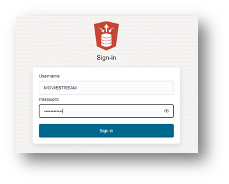
This should launch a new browser tab for you to provide the login credentials to the ADB.
Click sign in and on the next screen click “Approve” to allow redirect to Google Sheets.
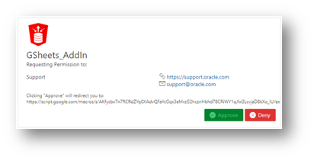
You should see the following screen. You can close this browser tab and start using the Google Sheets Add-in to query Autonomous Database.

Run Native SQL for analysis using Excel Pivot tables
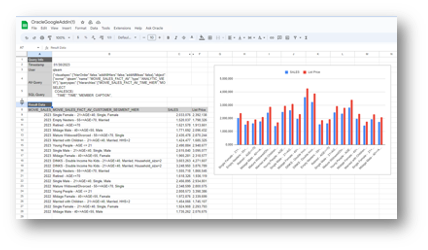
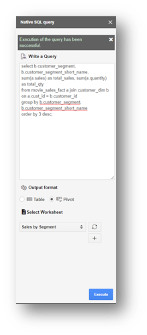
Launch the Native Sql panel by clicking the button in the Autonomous Database ribbon. Let’s run a SQL query on the data we just loaded in the Autonomous Database.
select b.customer_segment, b.customer_segment_short_name, sum(a.sales) as total_sales, sum(a.quantity) as total_qty
from movie_sales_fact a join customer_dim b on a.cust_id = b.customer_id
group by b.customer_segment, b.customer_segment_short_name
order by 3 desc;
Add the above query in the text box under the Write a query label on the right-side panel. Remove any existing SQL you might see from the previous run.
Check the Pivot table checkbox.
Under Select worksheet, click the “+” icon and provide “Sales by Segment” as the name.
Click the check button.
Click Execute.
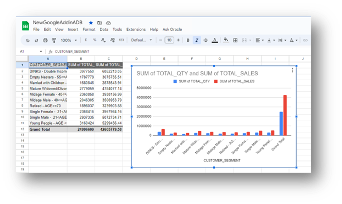
You can then use native Google Sheets native features on the data retrieved, as shown below.
Query an Analytic View
In case you have analytic views created in the Autonomous Database, you can easily query those using the Query Wizard.
On the ribbon, click on “Ask Oracle” and select Query Wizard.
This launches a wizard to query Analytic Views.
First select an Analytic View.
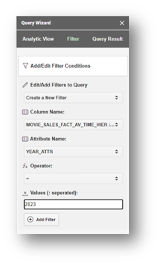
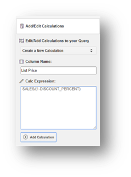
Next, select the measures, hierarchies and levels from those hierarchies and click Next. In the next step you can add filters and create your own calculations. Once the filters and custom calculations are added click Next. In the final step, a summary of the selections made is shown. Users can now choose the output format and run the query against the AV by clicking Execute.
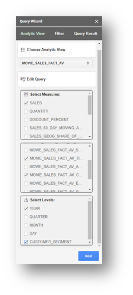
measures & attributes
|
|
|
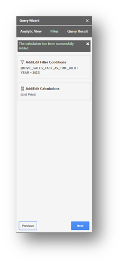
with filter and calculation
|
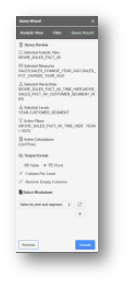
and output format selection
|
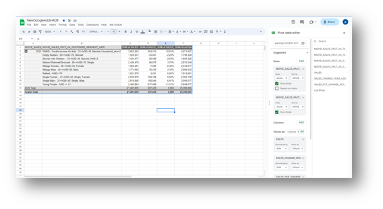
Since we selected a pivot table, summarized information is shown. You can use the native pivot table features to further analyze the data.
Conclusion
We saw that users could easily download the Google Sheets Add-in from Database Actions, set it up, and run queries directly on Autonomous Database. Additionally, users can leverage native Google Sheets capabilities to determine the right metrics to be included in Analytic Views developed using the Data Analysis tool. You can view the demo here.