
Overview
In an environment with multiple Oracle GoldenGate Integrated Extracts capturing from a shared Autonomous Database, we observed increasing capture lag while the Extract processes reported “At EOF”. By correlating capture progress, LogMiner wait events, and redo volume across instances, we identified how workload distribution influenced capture throughput. A coordinated review of instance placement and capture settings helped restore near-real-time replication. This post shares the diagnostic approach and the operational lessons from that investigation.
This post walks through how we found that, step by step, with the queries we used and what their output looked like. It is written for DBAs and SREs who run GoldenGate capture against Autonomous Database Serverless, or against any multi-instance Oracle database.
The ideas worth taking away:
- An Integrated Extract that says “At EOF” is not necessarily caught up. It only means it has received everything the database capture has handed over so far.
- Capture reads redo per instance. Every instance a database is open on adds a redo stream that each capture must read and merge, and the slowest stream sets the pace.
- Read cost depends on all the redo in that stream, not only the redo your own database writes.
- The LogMiner process views tell you, in a few seconds, whether lag comes from reading redo or from handing data to GoldenGate. That one distinction saves hours.
Environment names and identifying details have been generalized. Metrics illustrate the observations from this investigation.
The setup and the symptom
One shared ETL database, which we’ll call Database A, sits at the center of an analytics platform. It is an Autonomous Database Serverless PDB. Upstream Replicats load data from several source systems, ETL jobs transform it, and multiple per-PDB Integrated Extracts capture changes for downstream reporting databases. The Extracts run across multiple OCI GoldenGate deployments.
A second ETL database, Database B, runs the same kind of Extracts on the same GoldenGate deployments. It turned out to be the most useful thing we had, because it gave us a healthy baseline to compare against.
The symptom built up over a few days:
- Several Extracts on Database A showed increasing lag, ranging from about 2.5 hours to about 21 hours during the observation period, while another remained current.
- Every lagging Extract reported “Recovery complete: At EOF”, indicating that it had consumed the changes delivered by the capture process so far.
- The GoldenGate deployments showed low CPU and memory use, and no errors.
- The Extracts on Database B, on the same deployments, had no lag at all.
Together, these observations prompted us to examine the end-to-end capture pipeline, including redo mining and the handoff to Extract. Understanding how Integrated Extract works helped us choose the next diagnostic steps.
How an Integrated Extract really works
An Integrated Extract does not read redo itself. The database does that work, through a LogMiner-based capture process that runs inside the database, one per Extract. The Extract is a client that asks the capture for changes and writes what it receives to trail files.
The capture is a small pipeline of its own:
- Readers read redo. There is one reader for each redo thread the database is open on, and each reader reads its whole thread.
- Preparers turn raw redo into change records.
- The merger puts the changes from all threads back into SCN order. It can only move forward as far as the slowest thread has been read.
- The builder assembles complete transactions and hands them to the capture process, which passes them to the Extract.
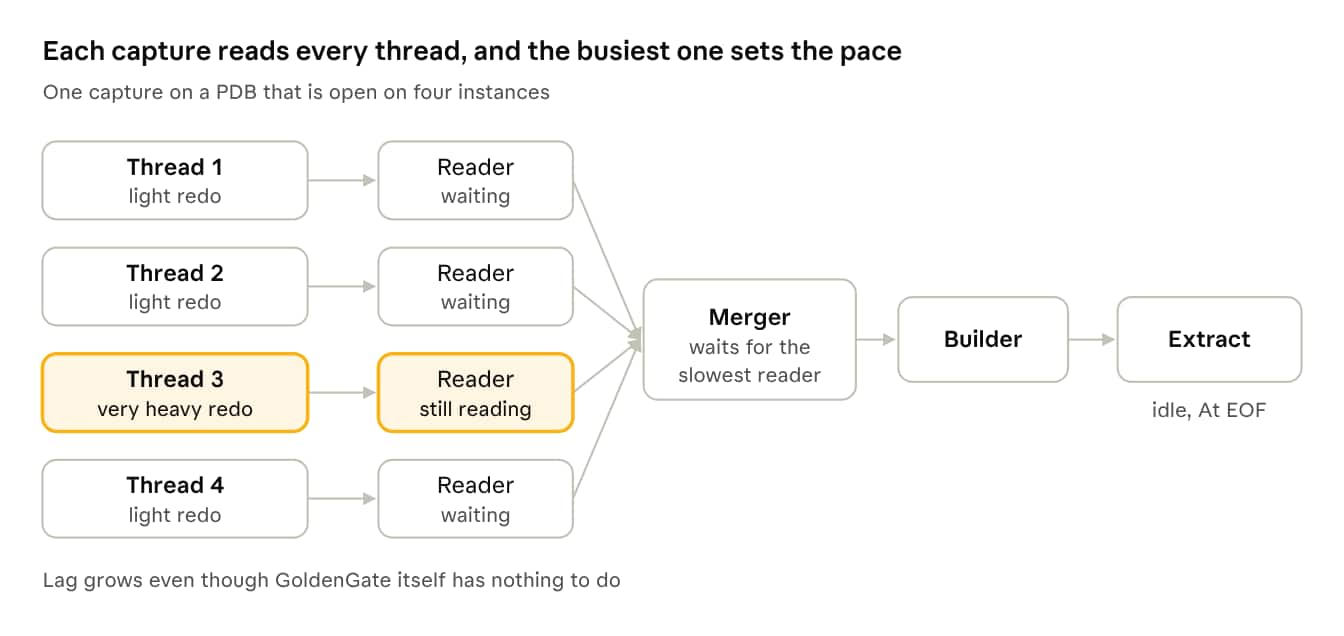
When one thread carries far more redo than the rest, its reader is still working while the others have filled their buffers and wait. The merger can only move as far as that reader has got, so the builder and the Extract sit idle.
Two consequences matter for troubleshooting.
“At EOF” describes the handoff, not the redo. When the Extract reports “Recovery complete: At EOF”, it means it has received everything the capture has delivered so far. If the readers are slow, the builder has nothing to deliver, and the Extract sits idle at EOF even though it is hours behind the source.
The read checkpoint has no log position. A classic Extract shows a redo sequence number and byte offset. An Integrated Extract shows only an SCN and a timestamp, because it never touches the log files. That timestamp is what the lag figure is calculated from.
So when an Integrated Extract is behind but idle, the question to ask is not “what is GoldenGate waiting on” but “which stage of the capture pipeline is holding things up”. The LogMiner process views answer that directly, as we’ll see in the investigation.
Why redo threads matter so much
In a multi-instance database, each instance writes its own redo thread. In a multitenant container, every PDB that is open on an instance writes into that instance’s thread. That is simply how redo works, and it is what makes multitenant databases efficient to run.
For capture, it has three effects:
- More instances means more streams to read. A database open on one instance gives each capture one thread to read. The same database open on four instances gives each capture four threads to read and merge, every time.
- The busiest thread sets the pace. The merger waits for the slowest reader. If one thread carries far more redo than the others, every capture on that database moves at that thread’s speed.
- Read cost follows total redo, not your share of it. A reader has to go through every block in its thread to find the records that belong to its PDB. If a thread carries a lot of redo from other work running on that instance, a capture reads all of it and keeps only a small fraction.
These characteristics are part of capture processing on shared, multi-instance infrastructure. As workloads and instance distribution evolve, redo volume and capture throughput should be evaluated together. In this case, reviewing both provided the context needed to tune the replication workload.
The investigation, step by step
The SQL examples below end with a slash on its own line for execution in SQL*Plus. Most query dynamic performance views; Step 3 also creates a snapshot table, so use an appropriate working schema and privileges.
Step 1: Look at the Extracts from GoldenGate
In the admin client on each deployment:
INFO EXTRACT *
LAG EXTRACT *
SEND EXTRACT EXT_A1, STATUS
We ran STATUS twice, a couple of minutes apart, for each lagging Extract. The read timestamp crept forward more slowly than the clock, and every Extract said “Recovery complete: At EOF”. That told us the Extracts were waiting, not working.
Step 2: Look at every capture from inside the database
SELECT REPLACE(capture_name,'OGG$CAP_') ext, inst_id, state,
       TO_CHAR(capture_message_create_time,'MM-DD HH24:MI') mined_thru,
       ROUND((SYSDATE - capture_message_create_time)*24,2) lag_h
FROM gv$goldengate_capture
ORDER BY lag_h DESC
/
mined_thru is how far the database has read for each Extract, and inst_id is the instance its capture process runs on. The state column (CAPTURING CHANGES, WAITING FOR TRANSACTION, WAITING FOR CLIENT REQUESTS) is worth noting but, on its own, it did not tell us much. Several captures showed WAITING FOR CLIENT REQUESTS whether they were stuck or healthy.
Step 3: Measure direction, not just distance
A single lag figure cannot tell you whether a capture is gaining or losing. We took a snapshot and compared it ten minutes later:
CREATE TABLE gg_lag_snap AS
SELECT capture_name, capture_message_create_time t1, SYSDATE s1
FROM gv$goldengate_capture
/

SELECT REPLACE(a.capture_name,'OGG$CAP_') ext,
       ROUND((c.capture_message_create_time - a.t1)/(SYSDATE - a.s1),2) speed_x,
       ROUND((SYSDATE - c.capture_message_create_time)*24,2) lag_h
FROM gg_lag_snap a JOIN gv$goldengate_capture c ON c.capture_name = a.capture_name
ORDER BY lag_h DESC
/
speed_x is how many minutes of source changes were captured per minute of real time. Above 1.0 means catching up. Most of our captures were between 0.6x and 1.0x, so they were falling further behind every hour.
Step 4: Find which stage of the pipeline is waiting
This was the turning point. Joining the capture to its LogMiner processes and their sessions shows what every reader, preparer, merger and builder is doing at that moment:
SELECT p.role, NVL(s.event,'(not visible)') event, COUNT(*) procs,
       ROUND(AVG(s.seconds_in_wait)) avg_wait_s, MAX(s.seconds_in_wait) max_wait_s
FROM gv$goldengate_capture c
JOIN gv$logmnr_process p ON p.inst_id = c.inst_id AND p.session_id = c.logminer_id
LEFT JOIN gv$session s ON s.inst_id = p.inst_id AND s.sid = p.sid
GROUP BY p.role, NVL(s.event,'(not visible)')
ORDER BY p.role, procs DESC
/
Across the sampled captures, it returned this:
ROLE      EVENT                              PROCS  AVG_WAIT_S  MAX_WAIT_S
builder   LogMiner builder: idle                 8           0           1
merger    LogMiner merger: idle                  8           0           1
preparer  LogMiner preparer: idle               18           0           1
reader    LogMiner reader: redo slot            50         190         595
reader    log file sequential read              13           0           0
reader    ASM IO for non-blocking poll           1           0           0
Fifty of the 64 readers had filled their buffers and were waiting, some for almost ten minutes, while 13 were actually reading redo. Every builder, merger and preparer was idle. The sampled waits pointed to redo reading as the stage to investigate next, particularly the readers still processing their threads.
As a rule of thumb for this view:
| What you see | What it means |
|---|---|
| Most readers in “redo slot” for minutes, builders idle | Gated on reading redo. Look at the redo threads. |
| A builder in “queue full” for minutes, its readers not reading | Data is ready and the Extract is not taking it. Look at the handoff. |
| A builder in “queue full” for seconds at a time | Normal. A healthy capture handing data over. |
| Preparers waiting on memory | Capture memory is too small for the transactions. |
| Readers in “redo (idle)”, waits of seconds | Healthy. The capture has reached the end of available redo. |
Step 5: Look at the redo threads
Next we checked which instances the PDB was open on, and how much redo each thread was writing. v$archived_log covers the whole container, which is exactly what we wanted here:
SELECT inst_id, name, open_mode FROM gv$pdbs ORDER BY inst_id
/

SELECT thread#, COUNT(*) logs,
       ROUND(SUM(blocks*block_size)/1024/1024/1024,1) gb,
       ROUND(SUM(blocks*block_size)/1024/1024/1024 /
             NULLIF((MAX(next_time)-MIN(first_time))*24,0),1) gb_per_hour
FROM v$archived_log
WHERE first_time >= SYSDATE - 2/24 AND dest_id = 1
GROUP BY thread# ORDER BY thread#
/
The PDB was open on four instances. Two of those threads were each carrying roughly 1.4 to 1.8 TB of redo an hour. Database A’s own changes, by comparison, came to only a few MB a second. Each capture’s reader for those two threads had to work through all of that volume to find a small number of relevant records.
To confirm which thread was holding each capture back, we compared how far each capture had registered logs on each thread:
SELECT consumer_name,
       MAX(CASE WHEN thread#=1 THEN TO_CHAR(next_time,'DD HH24:MI') END) t1,
       MAX(CASE WHEN thread#=2 THEN TO_CHAR(next_time,'DD HH24:MI') END) t2,
       MAX(CASE WHEN thread#=3 THEN TO_CHAR(next_time,'DD HH24:MI') END) t3,
       MAX(CASE WHEN thread#=4 THEN TO_CHAR(next_time,'DD HH24:MI') END) t4
FROM (SELECT consumer_name, thread#, MAX(next_time) next_time
      FROM dba_registered_archived_log GROUP BY consumer_name, thread#)
GROUP BY consumer_name
/
The thread furthest behind for each capture was one of the two busy threads, every time.
Step 6: Compare with the healthy database
We ran Steps 2 and 4 against Database B. It was open on a single instance, its readers waited seconds rather than minutes, and its Extracts were current. Per-read latency was in the same range on both databases. The difference was the amount of redo each reader had to get through, not how fast it read.
That comparison is what made the conclusion clear to everyone involved. Same GoldenGate deployments, same Extract design, different redo picture, different result.
What changed, and why it mattered
We reviewed the workload timeline alongside capture metrics. Three changes over approximately three weeks provided useful context for understanding the observed throughput:
| When | What changed | Effect on capture |
|---|---|---|
| Three weeks earlier | Source transactions grew larger | LogMiner preparers began waiting on memory, as capture memory was close to its 1 GB setting. Capture slowed but kept up. |
| Day 1 | ECPU raised from 32 to 200 to speed up late-running ETL jobs | The ETL jobs recovered. The PDB, previously open on one instance, now opened on four, so every capture read and merged four redo threads instead of one. Lag began to build slowly. |
| Day 8 | An instance restart, after which the PDB reopened on a different set of instances | Two of the PDB’s instances were also running very redo-heavy work, about 1.4 to 1.8 TB an hour. Lag grew quickly, to as much as 21 hours. |
The ECPU increase improved ETL completion times for the application workload. In this environment, the PDB was subsequently open on more instances, which also increased the number of redo threads processed by each capture. The operational lesson is to validate both application performance and replication throughput after a significant capacity change.
The memory pressure was real but secondary. Raising capture memory from 1 GB to 2 GB brought the preparer memory waits to zero and helped a little. The lag stayed, because the readers were still waiting on the busy threads.
The resolution
The investigation combined reader wait events, redo volume per thread, capture progress, and the comparison with Database B. The application, GoldenGate, and Autonomous Database teams used this shared evidence to review workload placement and agree on a targeted adjustment. Instance placement is managed by the Autonomous Database service, so any service-level adjustment was coordinated with the responsible team.
The coordinated adjustment left the PDB open on instances with a redo profile better aligned to the capture workload. A full database move was not required. New changes were generated on the remaining threads, while captures continued processing the earlier backlog.
Investigating a separate handoff pattern
During recovery, one Extract showed a different throughput pattern. Its LogMiner view showed:
ROLE      EVENT                              N  MAX_WAIT_S
builder   LogMiner builder: queue full       1          77
merger    LogMiner merger: redo slot         1          46
preparer  LogMiner: other                    2          46
reader    LogMiner reader: redo slot         8         131
The builder had changes ready and had been waiting more than a minute to hand them over, with everything behind it backed up. The capture process session sat in SQL*Net message from client, while the Extract reported “At EOF”. Each side was waiting for the other, and data moved only in short bursts. The database had no large transaction in flight for it, so this was not a big batch working its way through.
Before restarting it, we checked how far back it would re-read:
INFO EXTRACT EXT_A1, SHOWCHThe Recovery Checkpoint was only seconds behind the current read position, so a restart would re-read almost nothing. We stopped it, confirmed it showed STOPPED, and started it again. The capture rebuilt its LogMiner session within a few minutes, and the Extract moved from about 0.9x to a steady 1.4x and then faster.
A restart is a fix for a stalled handoff, not for a read-gated capture. We did not restart the other Extracts, because their pattern showed they were waiting on redo, and a restart would only have cost them startup time.
Watching the recovery
After the placement adjustment, capture lag did not decrease immediately. Captures first needed to process redo generated before the change. This expected backlog behavior is important when assessing recovery.
Each lagging capture was still reading redo written before the adjustment, including redo from the previously busy threads. The benefit became visible after its mined-through timestamp passed the time of the change. We refer to that transition as “crossing the change point”.
The numbers made it very clear:
| Phase | Typical capture speed |
|---|---|
| Before the change | 0.6x to 1.0x, falling behind |
| After the change, still reading older redo | 1.0x to 1.3x, roughly holding |
| After crossing the change point | 1.6x to 5x, catching up fast |
The Extract that was closest to current crossed first and caught up within a few hours. The ones that were 20 hours behind took the longest, because they had the most old redo to get through first. Within about a day and a half all Extracts were back to normal running lag of a few minutes.
Estimating when you’ll be caught up
A capture running at a speed above 1.0x closes its gap by (speed minus 1) hours every hour. So a rough estimate is:
Hours to catch up ≈ lag in hours / (capture speed - 1)
Valid when capture speed is greater than 1.0x.
Fifteen hours of lag at 2.0x takes about fifteen hours. The same lag at 1.2x takes about seventy-five. That difference is why it’s worth knowing whether a capture has crossed the change point before you give anyone an ETA.
Choosing a useful measurement window
- Short windows can mislead. Captures move in waves. Over thirty seconds a healthy capture can show 0x or 10x. We stopped judging anything on less than about five minutes of data, and preferred thirty.
- Long averages can mask recent improvements. A trend script that averaged over 48 hours told us one Extract would need another 79 hours. It was caught up in about five, because the 48-hour average was dominated by the slow days before the fix. A window of the last one or two hours gives a more representative ETA.
Don’t forget the Replicats
Once the Extracts were moving, we checked every downstream Replicat:
INFO REPLICAT *
LAG REPLICAT *
INFO EXTRACT EXT_A1, DETAIL
INFO REPLICAT REP_A1, DETAIL
The question is whether a Replicat has a backlog of its own, or is just waiting on its Extract. Every one of ours was “At EOF” and reading the exact trail position its Extract was writing. Their lag was simply their Extract’s lag, so they caught up at the same moment, with nothing extra to do.
Operational recommendations
Here’s what we changed in how we run GoldenGate capture on Autonomous Database, and what we’d suggest to anyone doing the same.
1. Treat scaling as a replication change too
A large ECPU change can change how many instances a database runs on. If GoldenGate captures from that database, more instances means more redo threads for every Extract to read. Before scaling a capture source, we now get the database, application and GoldenGate owners in one short conversation, and we size from measured CPU use rather than from symptoms.
2. Keep capture sources on as few instances as the workload needs
Our healthy database ran on one instance with no lag at all. Ask the Autonomous Database team what ECPU level keeps your database on one or two instances, and check whether your real peak workload fits under it.
3. Watch redo per thread, not just lag
Lag tells you something is wrong after hours. Redo per thread, together with reader waits in gv$logmnr_process, tells you within minutes. We now alert on capture lag, redo per thread on the database’s instances, and readers sitting in “redo slot” for long stretches.
4. Check placement after every maintenance window
Autonomous Database Serverless rotates instances during patching, which is normal and keeps the service healthy. It does mean the instances your database runs on can change. We now run a short check after each window: capture lag, which instances the PDB is open on, and redo per thread since the window. After one recent window, our PDB moved to instances carrying 10 to 50 GB of redo an hour, which is exactly what you want to see. Having the numbers in hand also makes any follow-up with the Autonomous Database team quick and factual.
5. Bring evidence, not conclusions
The LogMiner wait breakdown, the redo per thread and the healthy comparison database were what moved things forward. Every team involved could see the same facts, and the fix followed naturally.
6. Sample more than once
Several of our early readings looked like a GoldenGate problem and turned out to be a pause between waves. Two or three samples a minute apart would have saved us some back and forth.
7. Restart an Extract only for the right reason
A restart clears a stalled handoff. It does nothing for a capture that is waiting on redo. Check SHOWCH first so you know how much it will re-read.
Appendix: a small diagnostic toolkit
These are the queries we found most useful, gathered in one place. They’re read-only, and each ends with a slash so you can paste it straight into SQL*Plus.
What each capture is doing, in plain words. This one rolls up the reader, builder and capture state for every Extract and labels the result:
WITH x AS (
  SELECT REPLACE(c.capture_name,'OGG$CAP_') e, c.inst_id, c.capture_message_create_time thru,
         MAX(CASE WHEN p.role='builder' THEN s.event END) bev,
         MAX(CASE WHEN p.role='builder' THEN s.seconds_in_wait END) bwait,
         SUM(CASE WHEN p.role='reader' AND s.event NOT LIKE '%redo slot%' THEN 1 ELSE 0 END) rr,
         MAX(CASE WHEN p.role='reader' AND s.event LIKE '%redo slot%' THEN s.seconds_in_wait END) rwmax
  FROM gv$goldengate_capture c
  JOIN gv$logmnr_process p ON p.inst_id = c.inst_id AND p.session_id = c.logminer_id
  LEFT JOIN gv$session s ON s.inst_id = p.inst_id AND s.sid = p.sid
  GROUP BY c.capture_name, c.inst_id, c.capture_message_create_time)
SELECT e extract, inst_id,
       ROUND((SYSDATE - thru)*24,2) lag_h,
       CASE WHEN bev LIKE '%queue full%' AND rr = 0 AND bwait > 120 THEN 'Data ready, waiting on Extract'
            WHEN bev LIKE '%queue full%' THEN 'Handing data to Extract'
            WHEN (SYSDATE - thru)*24 < 0.5 THEN 'Current'
            WHEN rwmax > 60 THEN 'Reading redo, slow thread holding it'
            ELSE 'Reading redo, flowing' END doing
FROM x ORDER BY lag_h DESC
/
The capture process session itself. Useful when you suspect a handoff stall:
SELECT REPLACE(c.capture_name,'OGG$CAP_') ext, c.state, s.event, s.seconds_in_wait,
       c.total_messages_captured, c.total_messages_enqueued
FROM gv$goldengate_capture c
JOIN gv$session s ON s.inst_id = c.inst_id AND s.sid = c.sid AND s.serial# = c.serial#
/
Large transactions held by a capture. No rows means nothing big is in flight:
SELECT component_name, cumulative_message_count, total_message_count,
       TO_CHAR(first_message_time,'MM-DD HH24:MI:SS') first_msg
FROM gv$goldengate_transaction
/
From the GoldenGate admin client:
SEND EXTRACT EXT_A1, STATUS
SEND EXTRACT EXT_A1, SHOWTRANS
STATS EXTRACT EXT_A1, LATEST, REPORTRATE SEC
INFO EXTRACT EXT_A1, SHOWCH
Run STATUS twice a couple of minutes apart. If neither the read time nor the write position moves, the Extract is stalled. If both move slowly, look at the database side first.
Closing thoughts
This investigation illustrates why capture lag is best understood through several related signals. Extract status, capture progress, LogMiner wait events, and redo volume each describe a different stage of the pipeline. Correlating them helped us distinguish redo processing from the handoff to Extract and choose targeted actions.
If you take one thing from this post, let it be this: when an Integrated Extract is behind but idle, look at gv$logmnr_process before anything else. It tells you which stage is waiting, and that tells you who to talk to and what evidence to bring.
The visibility available in Oracle GoldenGate and Autonomous Database supported a collaborative, evidence-based investigation. Reviewing application capacity, redo workload, and capture behavior together helped restore near-real-time replication and improve our operational checks.