What is an Oracle Stream Analytics:
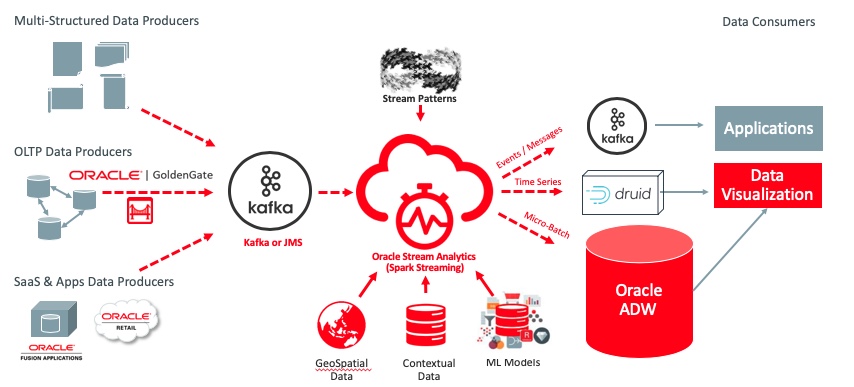
Oracle Stream Analytics (OSA) is an in-memory technology for real-time analytic computations on streaming big data. Oracle Stream Analytics can automatically process and analyze large scale real-time information by using sophisticated correlation patterns, enrichment, and machine learning algorithms. The streaming big data can originate from IoT sensors, web pipelines, log files, point-of-sale devices, ATM machines, social media, transactional databases, NoSQL databases or any other data source. OSA offers a compelling, friendly and visually stunning real-time streaming analytics user experience for business users to dynamically create and implement instant insight solutions. The best part of this tool is that it allows users to explore real-time data through live charts, maps, visualizations, and graphically build streaming pipelines without any hand-coding. OSA executes in a scalable and highly available clustered Big Data environment, using Apache Kafka and Apache Spark Streaming integrated with Oracle’s Continuous Query Engine to address critical real-time use cases in modern enterprises.
-
Detecting real-time fraud based on anomaly detection machine learning algorithms.
-
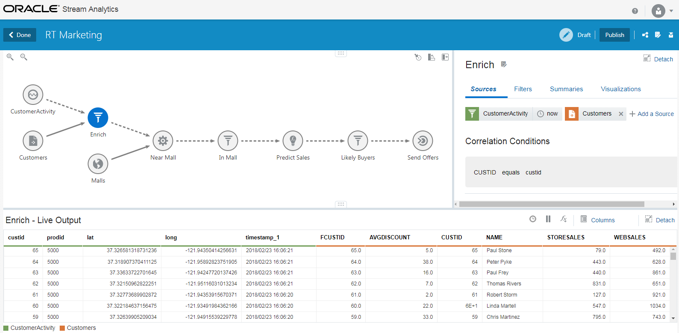
Offering real-time marketing offers based on customer location and loyalty.
-
Tracking transaction losses and margins in real-time to renegotiate with vendors and suppliers.
-
Improving asset maintenance by tracking healthy operating parameters and pro-actively scheduling maintenance.
-
Improving margins by continuously tracking demand and optimizing markdowns instead of randomly lowering prices.
-
Re-adjusting prices by continuously tracking demand, inventory levels, and product sentiment on social media etc.
-
Instantly identifying shopping cart defections and improving conversion rates.
-
Upselling products and services by instantly identifying customer’s presence on the company website.
-
Improving asset utilization by tracking the average time it takes to load and unload merchandise.
-
Improving turnaround time by preparing dock and staff based on the estimated arrival time of fleet.
-
Transportation: Monitor all airline’s operational events to eliminate flight delays
-
Revising schedule estimates based on actual time to enter and exit loading zones, and so on.
Technology Use-cases:
-
Build complex event processing pipelines by blending and transforming data from disparate transactional and non-transactional sources.
-
Perform temporal analytics based on time and event windows.
-
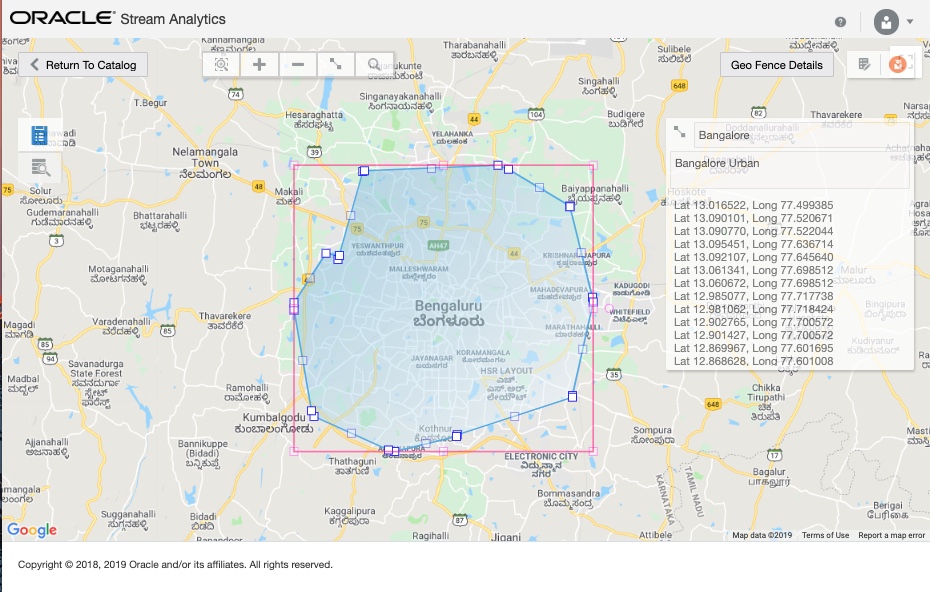
Perform location-based analytics using built-in geo-spatial patterns.
-
Detect patterns in time-series data and execute real-time actions.
-
Build operational dashboards by visualizing processed data streams.
-
Use Machine Learning models such as regression to score current events and predict the next events.
-
Run ad-hoc queries on the results of processed data streams.
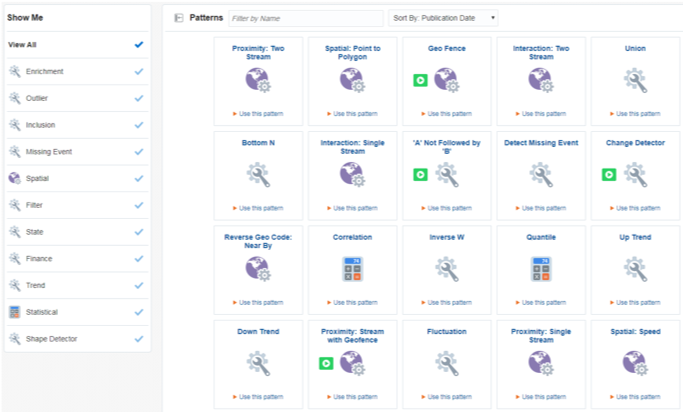
For example, patterns can detect correlated events, such as a door closing within 10 seconds of opening it, spikes in values, such as a temperature spike of 30% outside of the average within a given time, or detecting a W-pattern in financial trading. Patterns can also detect if a weight of manufactured items is slowly trending lower or the reading falls outside acceptable norms.
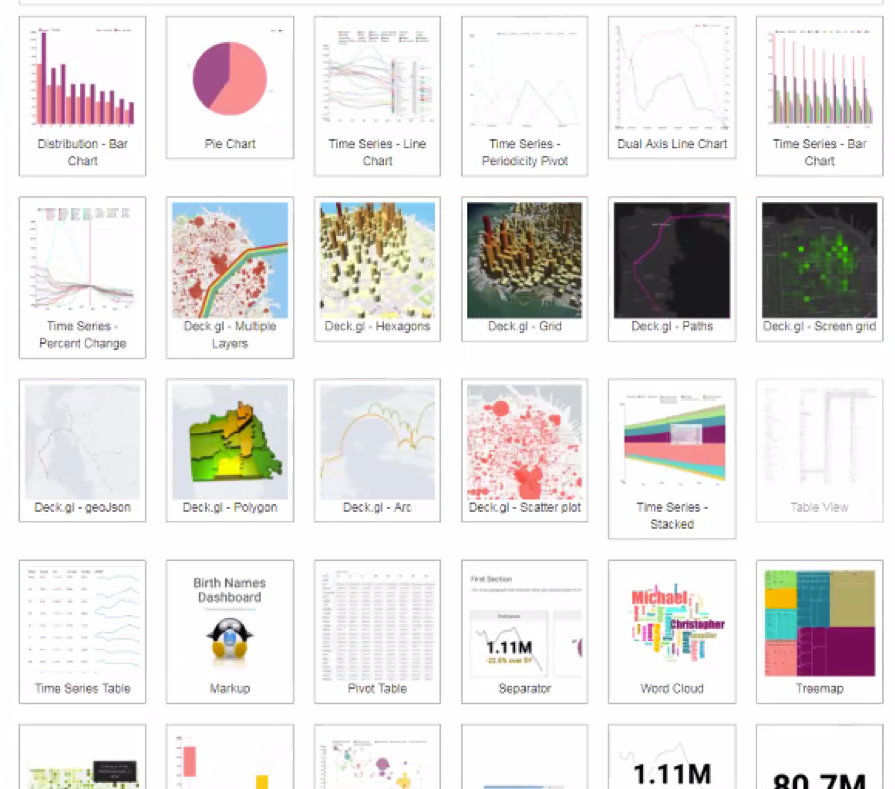
Oracle Stream Analytics includes an extensive library of 30+ visualization charts which are based on Apache Superset, which is an easy to use interface to create and explore data. A druid based cube can be created using Stream Analytics and data can be explored using interactive charts. Some of the charts are Distribution Chart, Sunburst, Word Cloud, Sankey, Time Series Chart, Treemap, Directed force Layout, Calendar Heatmap, World Map, Box Plot, Filter Box, Bubble Chart, iFrame, Bullet Chart, Streaming Chart, Table View, Big Number with Trendline, Parallel Coordinates, Markup, Big Number, Heatmap, Pivot Table etc