Until recently, you were only able to monitor deployment related metrics such as CPU Utilization, OCPU Consumption, Memory Utilization, and so on. With the recent updates in OCI Monitoring and OCI GoldenGate, you can now monitor replication related metrics too. The Oracle Cloud Infrastructure Monitoring service lets you to monitor your cloud resources using the Metrics and Alarms features actively and passively.
OCI GoldenGate is now integrated with OCI Application Performance Monitoring (APM). APM service provides deep visibility into the performance of applications and provides the ability to diagnose issues quickly to deliver a consistent level of service, including the monitoring of the multiple components and application logic spread across clients, third-party services, and back-end computing tiers, on premises or in the cloud.
Using Metrics Explorer of OCI Monitoring, you can create alarms and notifications related to your replication processes. Use APM to create visual dashboards that monitor OCI GoldenGate deployment and replication health.
In this blog you’ll learn about the metrics available, how to use them for troubleshooting, how to create alarms & notifications with Metrics Explorer in OCI Monitoring and how to create dashboards with APM.
OCI GoldenGate Metrics, Definitions, Troubleshooting, and Actions you can take
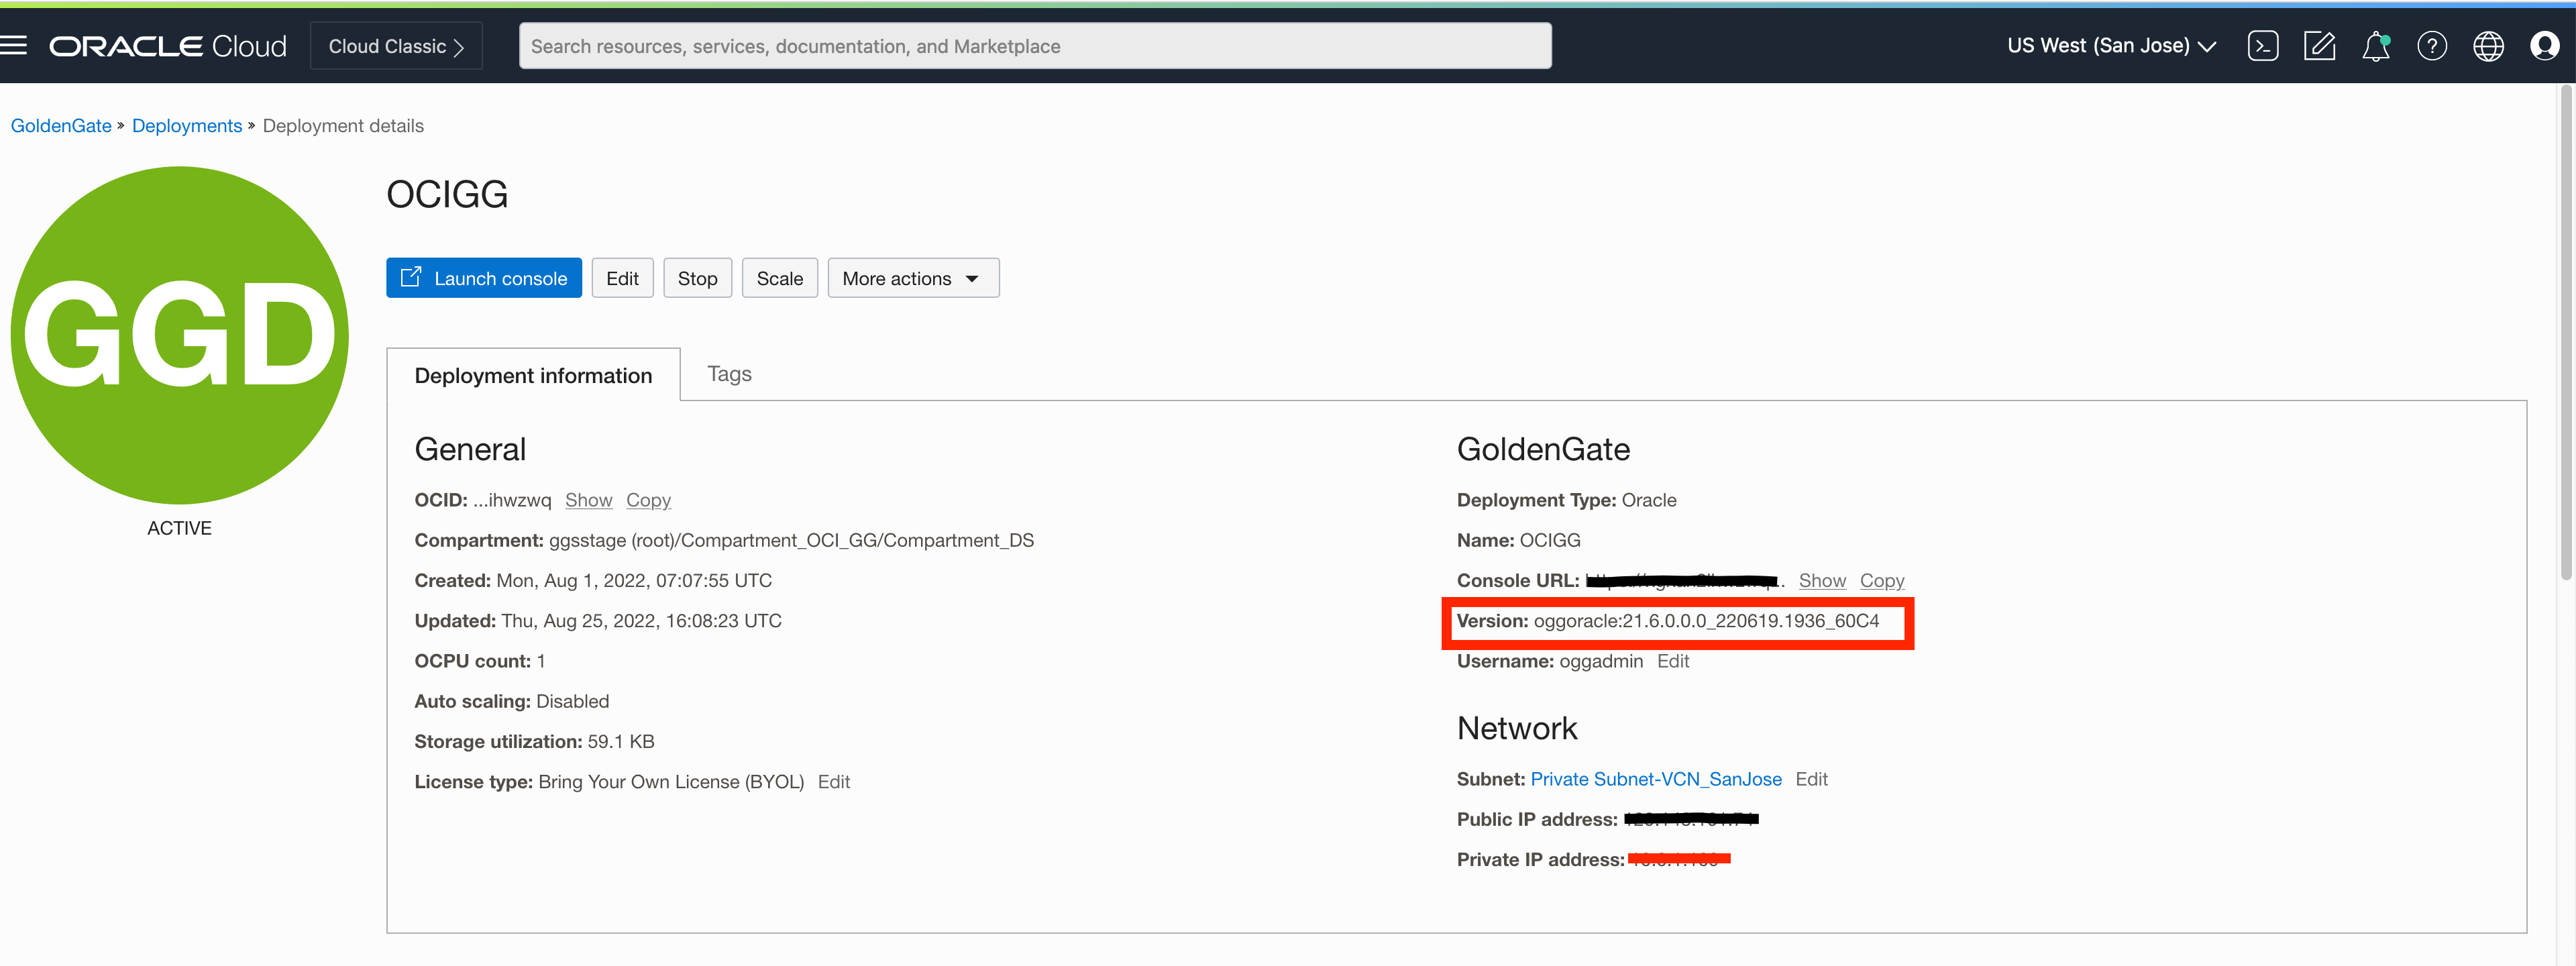
Your deployment must be on version 21.6.0.0.0_220619.1936_602 or higher to leverage the complete list of OCI GoldenGate metrics. You can check your deployment version from deployment details.
In the below table, you can see the full list of available metrics, their definitions, possible root causes and reccomended actions which can be taken. Oracle recommends you to monitor all the metrics for troubleshooting & diagnosis. If the issue is not resolved with the recommended actions, you can raise a support ticket and mention the problem with the actions taken.
| Definitions | Additional Details | Reccomendations | |
|---|---|---|---|
| CPU Utilization | Total CPU usage percentage by all consumer groups |
Check CPU Utilization if: |
– Add additional OCPUs to your deployment – If Autoscaling is not enabled, enable Autoscaling – Check storage size and trail size, if high purge trail files |
| Deployment Health | Overall percentage health of services | There are 4 services: Administration Service, Distribution Service, Receiver Service, and Performance Metrics Service) If all running healthy, score is expected is %100. If it is %50, it means two of the services are running healthy |
– Check if a process marked as critical to deployment is down |
| Distribution Path Lag | Displays the average lag time of a Distribution Path | If source & target deployments are running in different data centres, there might be network latency issues | |
| Distribution Path Status | Status of the distribution path | If stoped or abended, credentials might have changed, receiver service might be stoped, target deployment is stoped | |
| Extract Lag | The difference, in seconds, between the time that a record was processed by Extract (based on the system clock) and the timestamp of that record in the data source | Extract Lag may have different reasons related to source database performance, network latency or OCI GoldenGate Deployment shape (number of OCPUs assigned), stroage utilization | If Extract Lag is high; – Check CPU Utilization to see if deployment runs out of resources |
| Extract Status | Status of the extract (%100 when Running, %0 when Stopped/ Abended) | If stopped or abended, please check the report file to see the root cause/ error | – Check extract report file to diagnose the issue |
| File System Usage | Percentage of file system used by deployment | If File System Usage is high, – Check trail file size and purge not needed trail files |
|
| Memory Utilization | Percentage of available memory used. Each OCI GoldenGate OCPU assigned to deployment allocates 16 GB of memory | Need for memory is alligned with the size of the data replicated. If enough memory is allocated, each open transaction is kept in memory until a commit record is received | If Memory Utilization is high; – Add additional OCPUs to your deployment |
| OCPU Consumption | Total number of OCPUs used by the deployment | Shows consumed OCPUs for billing. If Autoscaling is enabled, you can monitor the total number of OCPUs consumed | |
| Receiver Path Status | Status of the receiver path (%100 when Running, %0 when Stopped/ Abended) | If stoped or abended, credentials might have changed, receiver service might be stoped, target deployment is stoped | If Receiver Path Status is Stoped/ Abended; – Check credentials |
| Replicat Lag | The difference, in seconds, between the time that the last record was processed by Replicat (based on the system clock) and the timestamp of the record in the trail | If Replicat Lag is high; – Check CPU & Memory Utilization to see if deployment is out of resources |
|
| Replicat Status | Status of the replicat (%100 when Running, %0 when Stopped/ Abended) | If stopped or abended, please check the report file to see the root cause/ error | – Check Replicat Report file to diagnose the issues |
| Swap Space Usage | Percentage of swap space used | As OCI GoldenGate only writes only committed transaction to the trail files, all of the uncommitted transactions are cached in memory. Cache uses both physical memory and swap space (virtual memory). Swap space is located on hard drives to provide additional memory when the physical memory (RAM) is full | – If Swap Space Usage is inreasing, consider adding additional OCPUs to your deployment to increase physical memory (RAM) |
| Temp Space Usage | Amount of temporary space, in gigabytes, used by the deployment | When total cached transaction data exceeds the Cachesize setting, Extract will begin writing cache data to temporary files. It is typically more efficient for the operating system to swap to disk than it is for Extract to write temporary files | – If Temp Space Usage is inreasing, consider adding additional OCPUs to your deployment to increase physical memory (RAM) |
Using Metrics Explorer for Creating Alarms & Notifications
Creating a Metric:
Metrics Explorer is a cloud native service that is integrated with OCI GoldenGate.
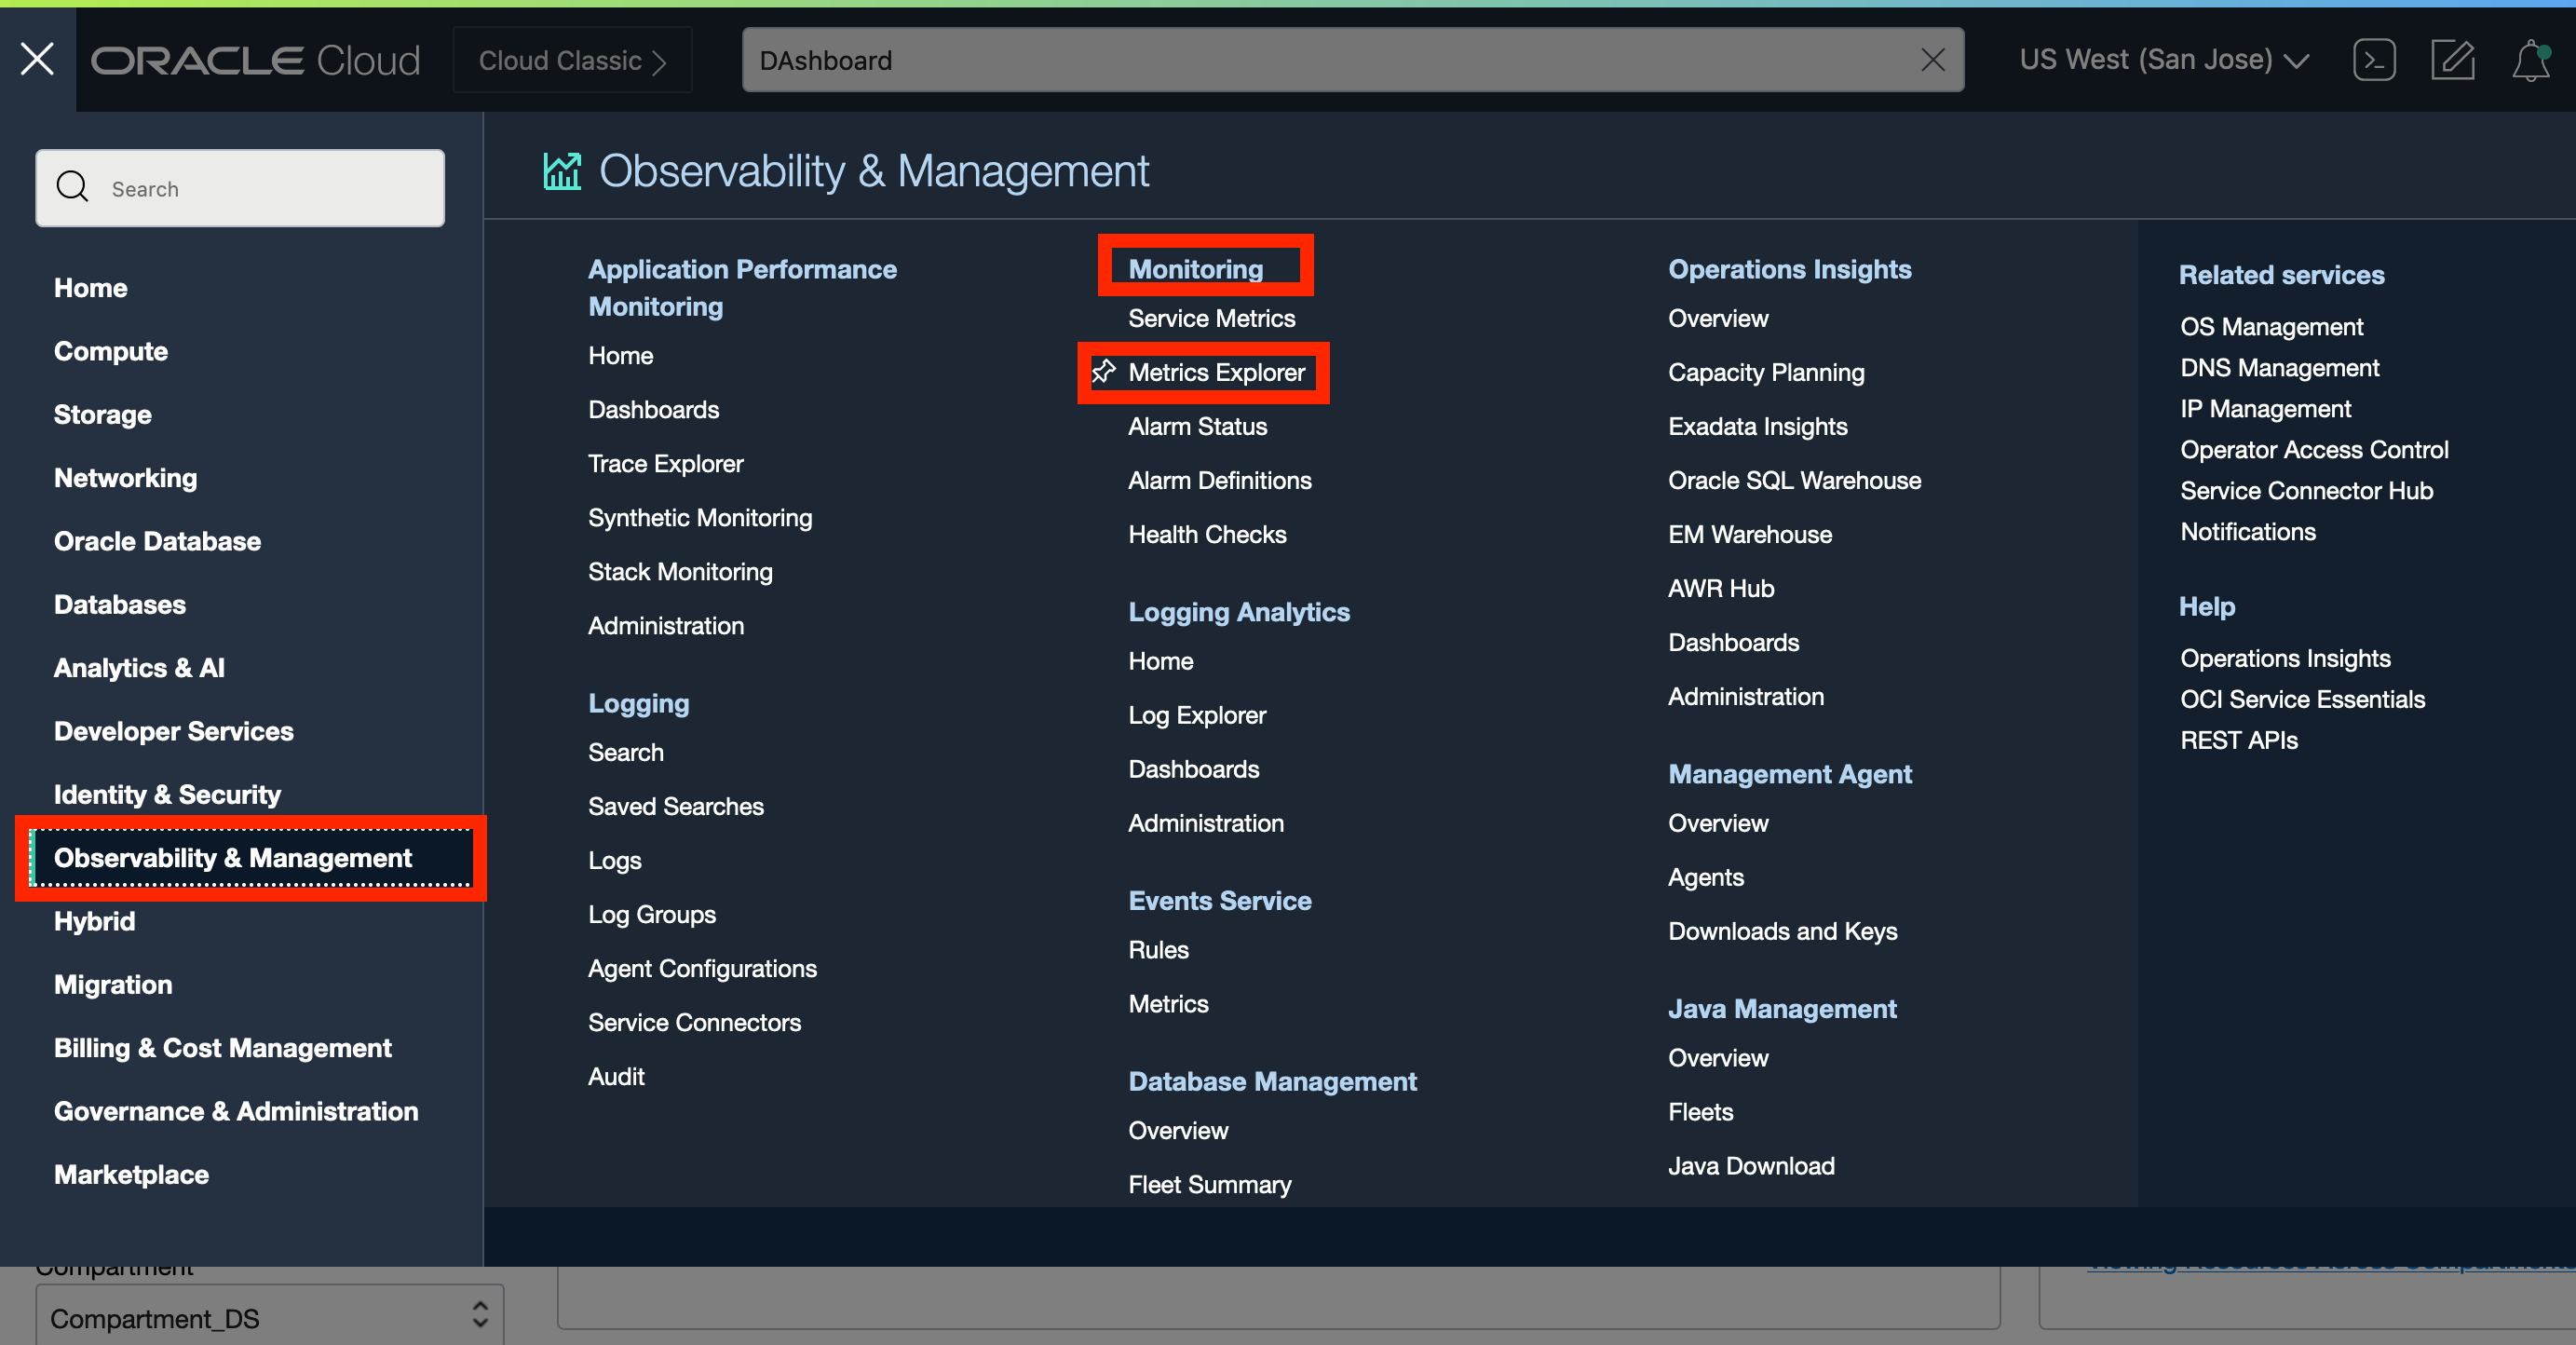
To get to Metrics Explorer, go to Observability & Management, and under Monitoring, click Metrics Explorer in the Oracle Cloud navigation menu.
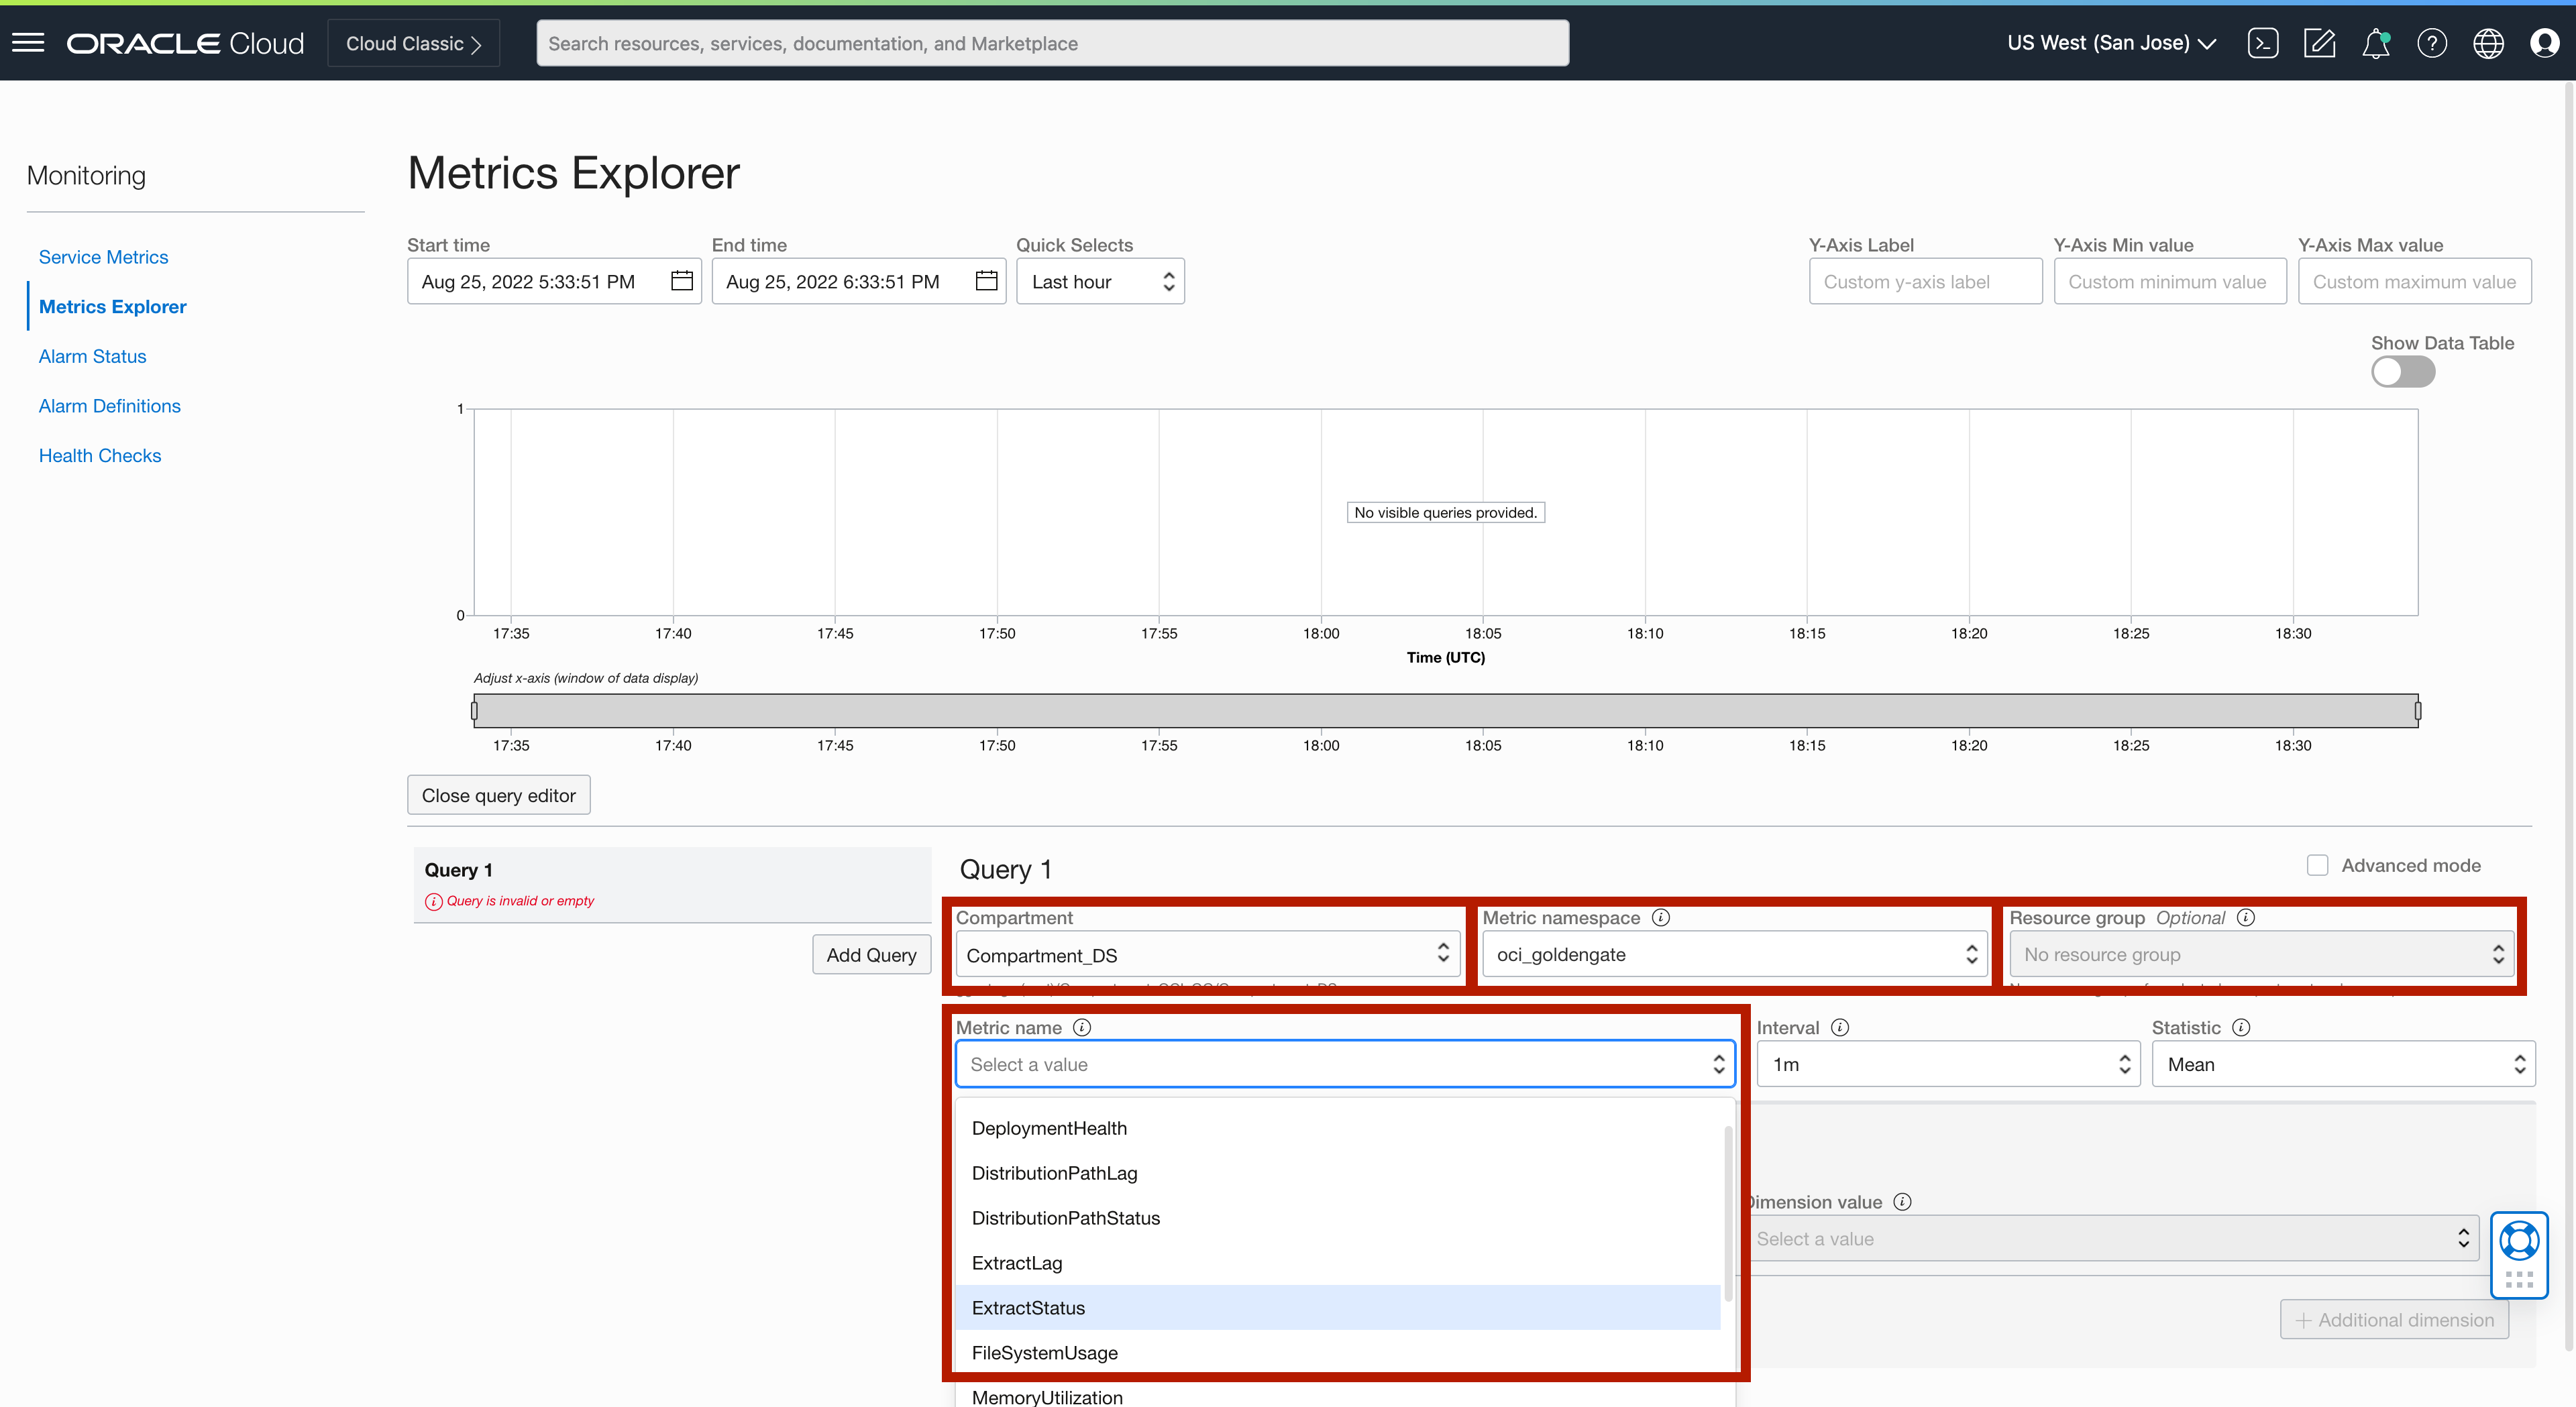
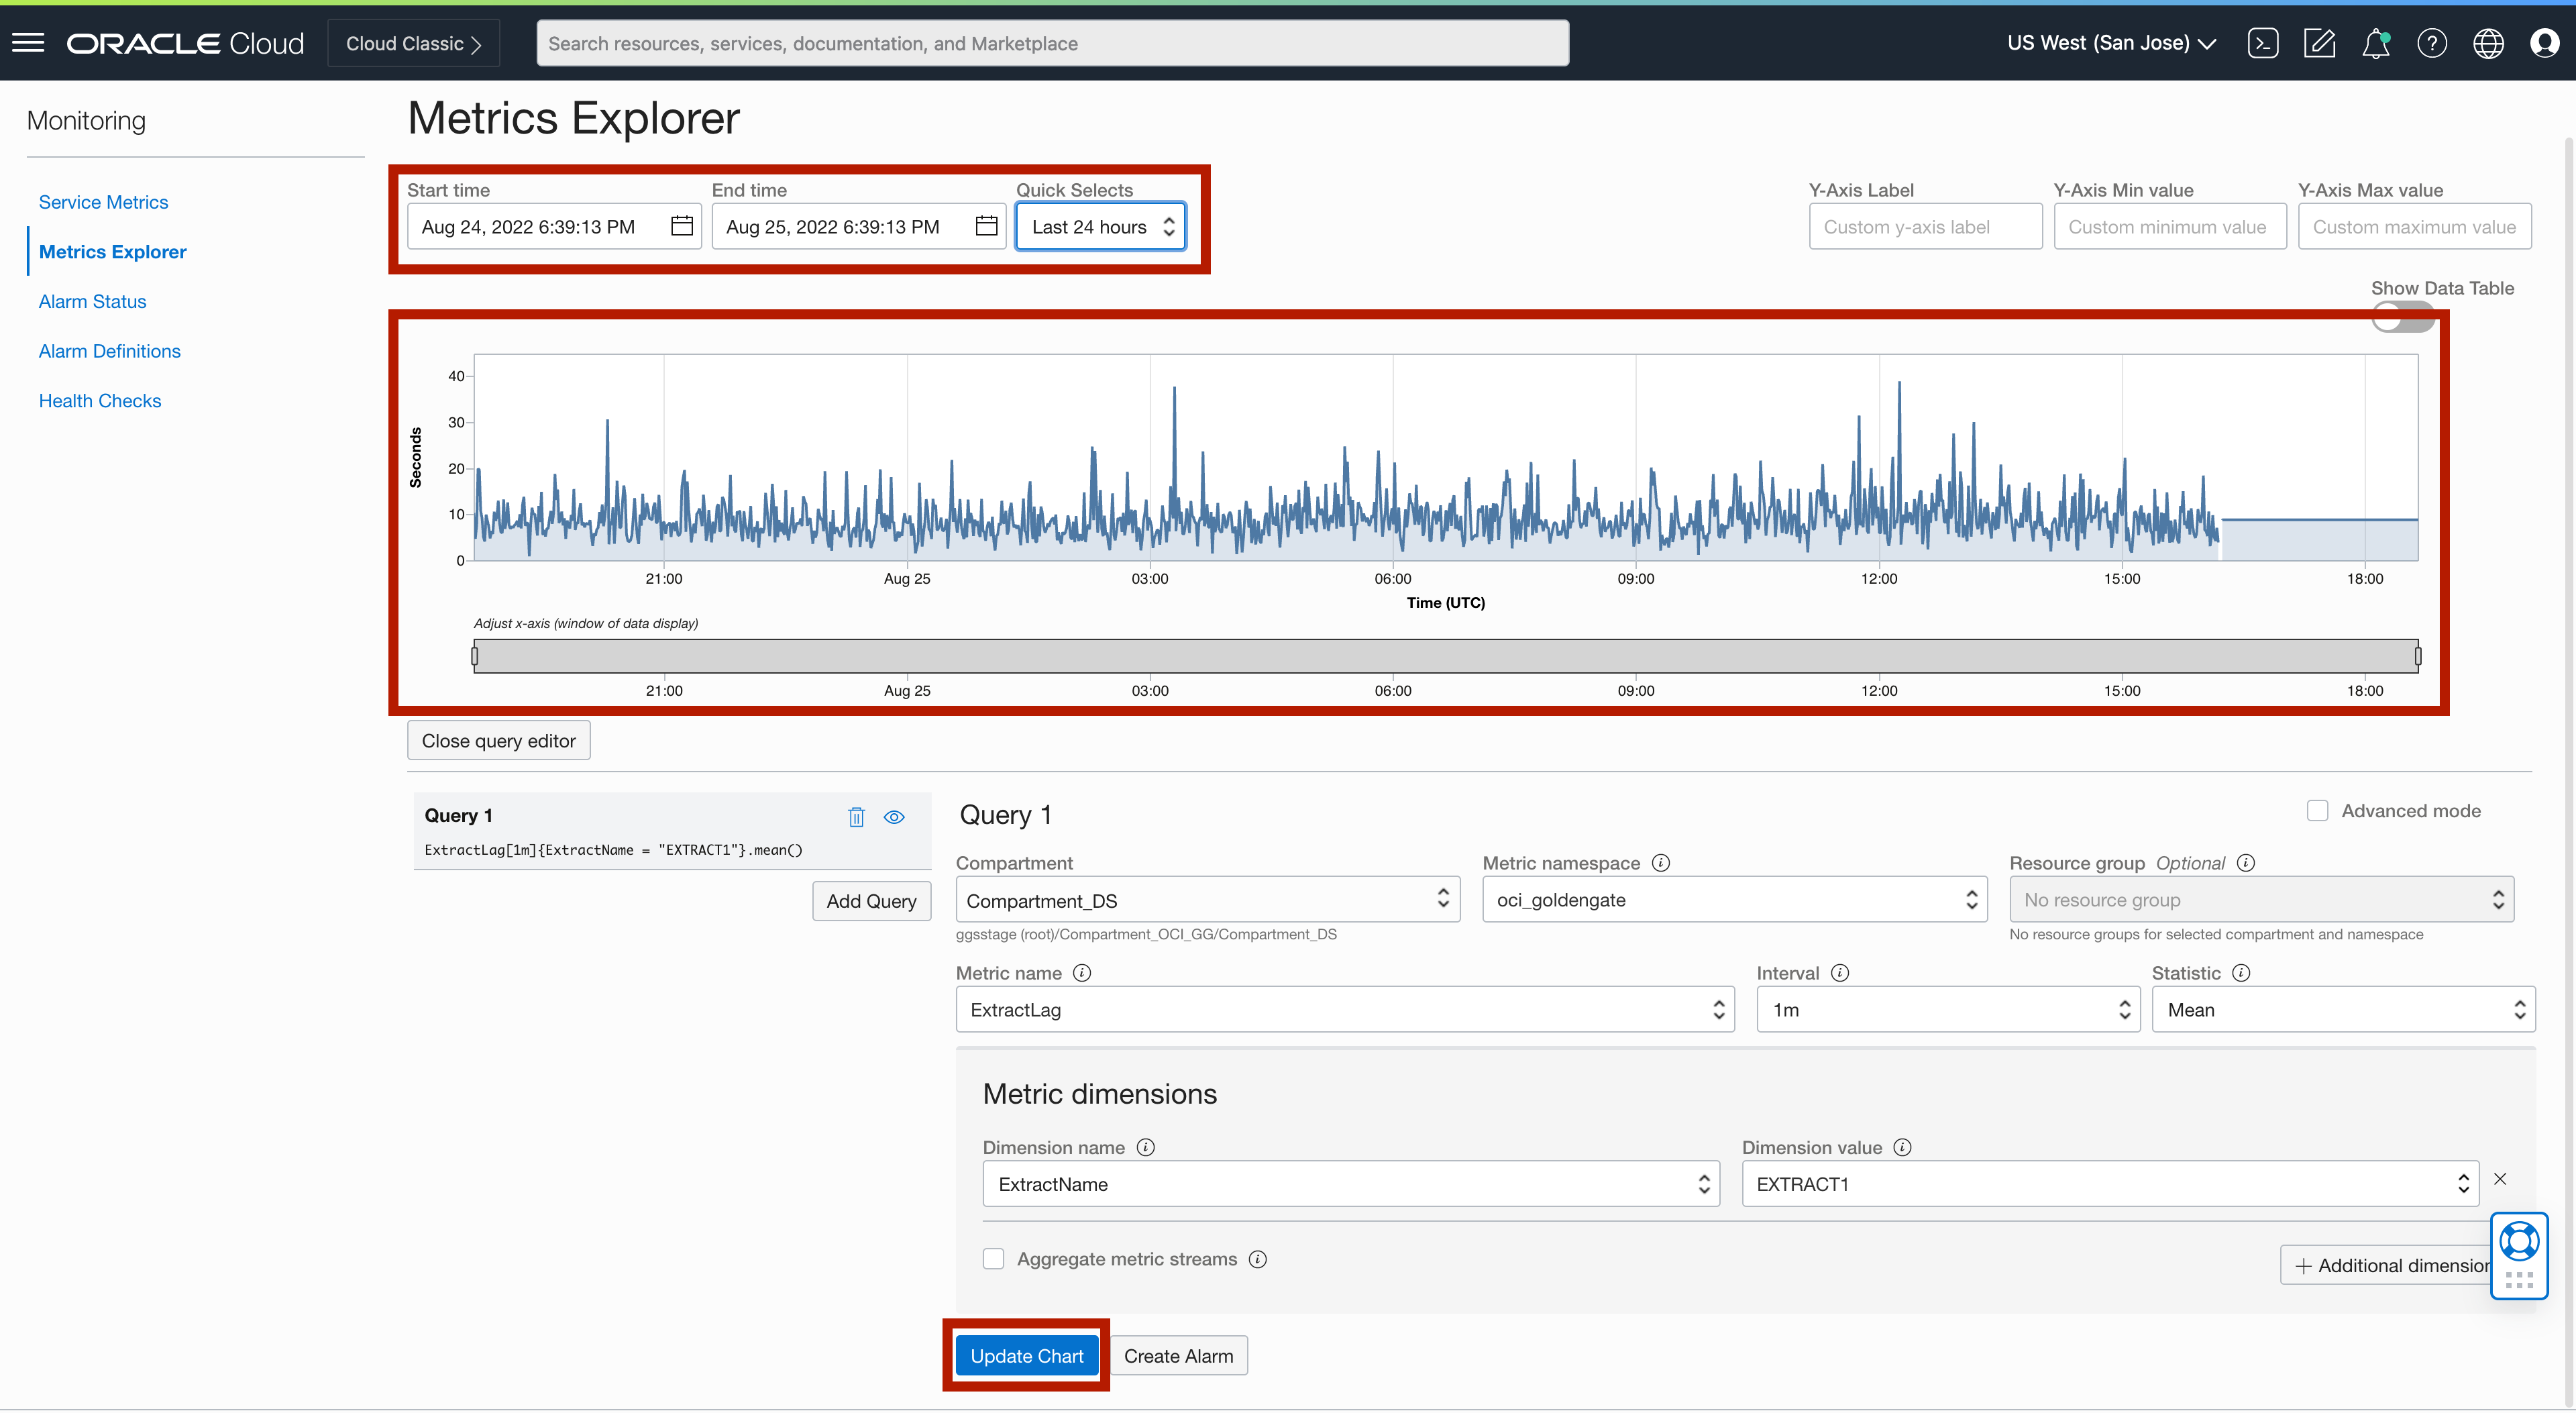
In Metrics Explorer, you’ll see the Query Editor. Select the Compartment where your deployments and connections are located.
Next, select oci_goldengate for Metric Namespace. In Metric Name, select one of the available OCI GoldenGate metrics.
Interval and Statistic need to be defined together with metric name. Interval is the time window used to convert the given set of raw data points. Statistic is the aggregation function applied to the given set of raw data points.
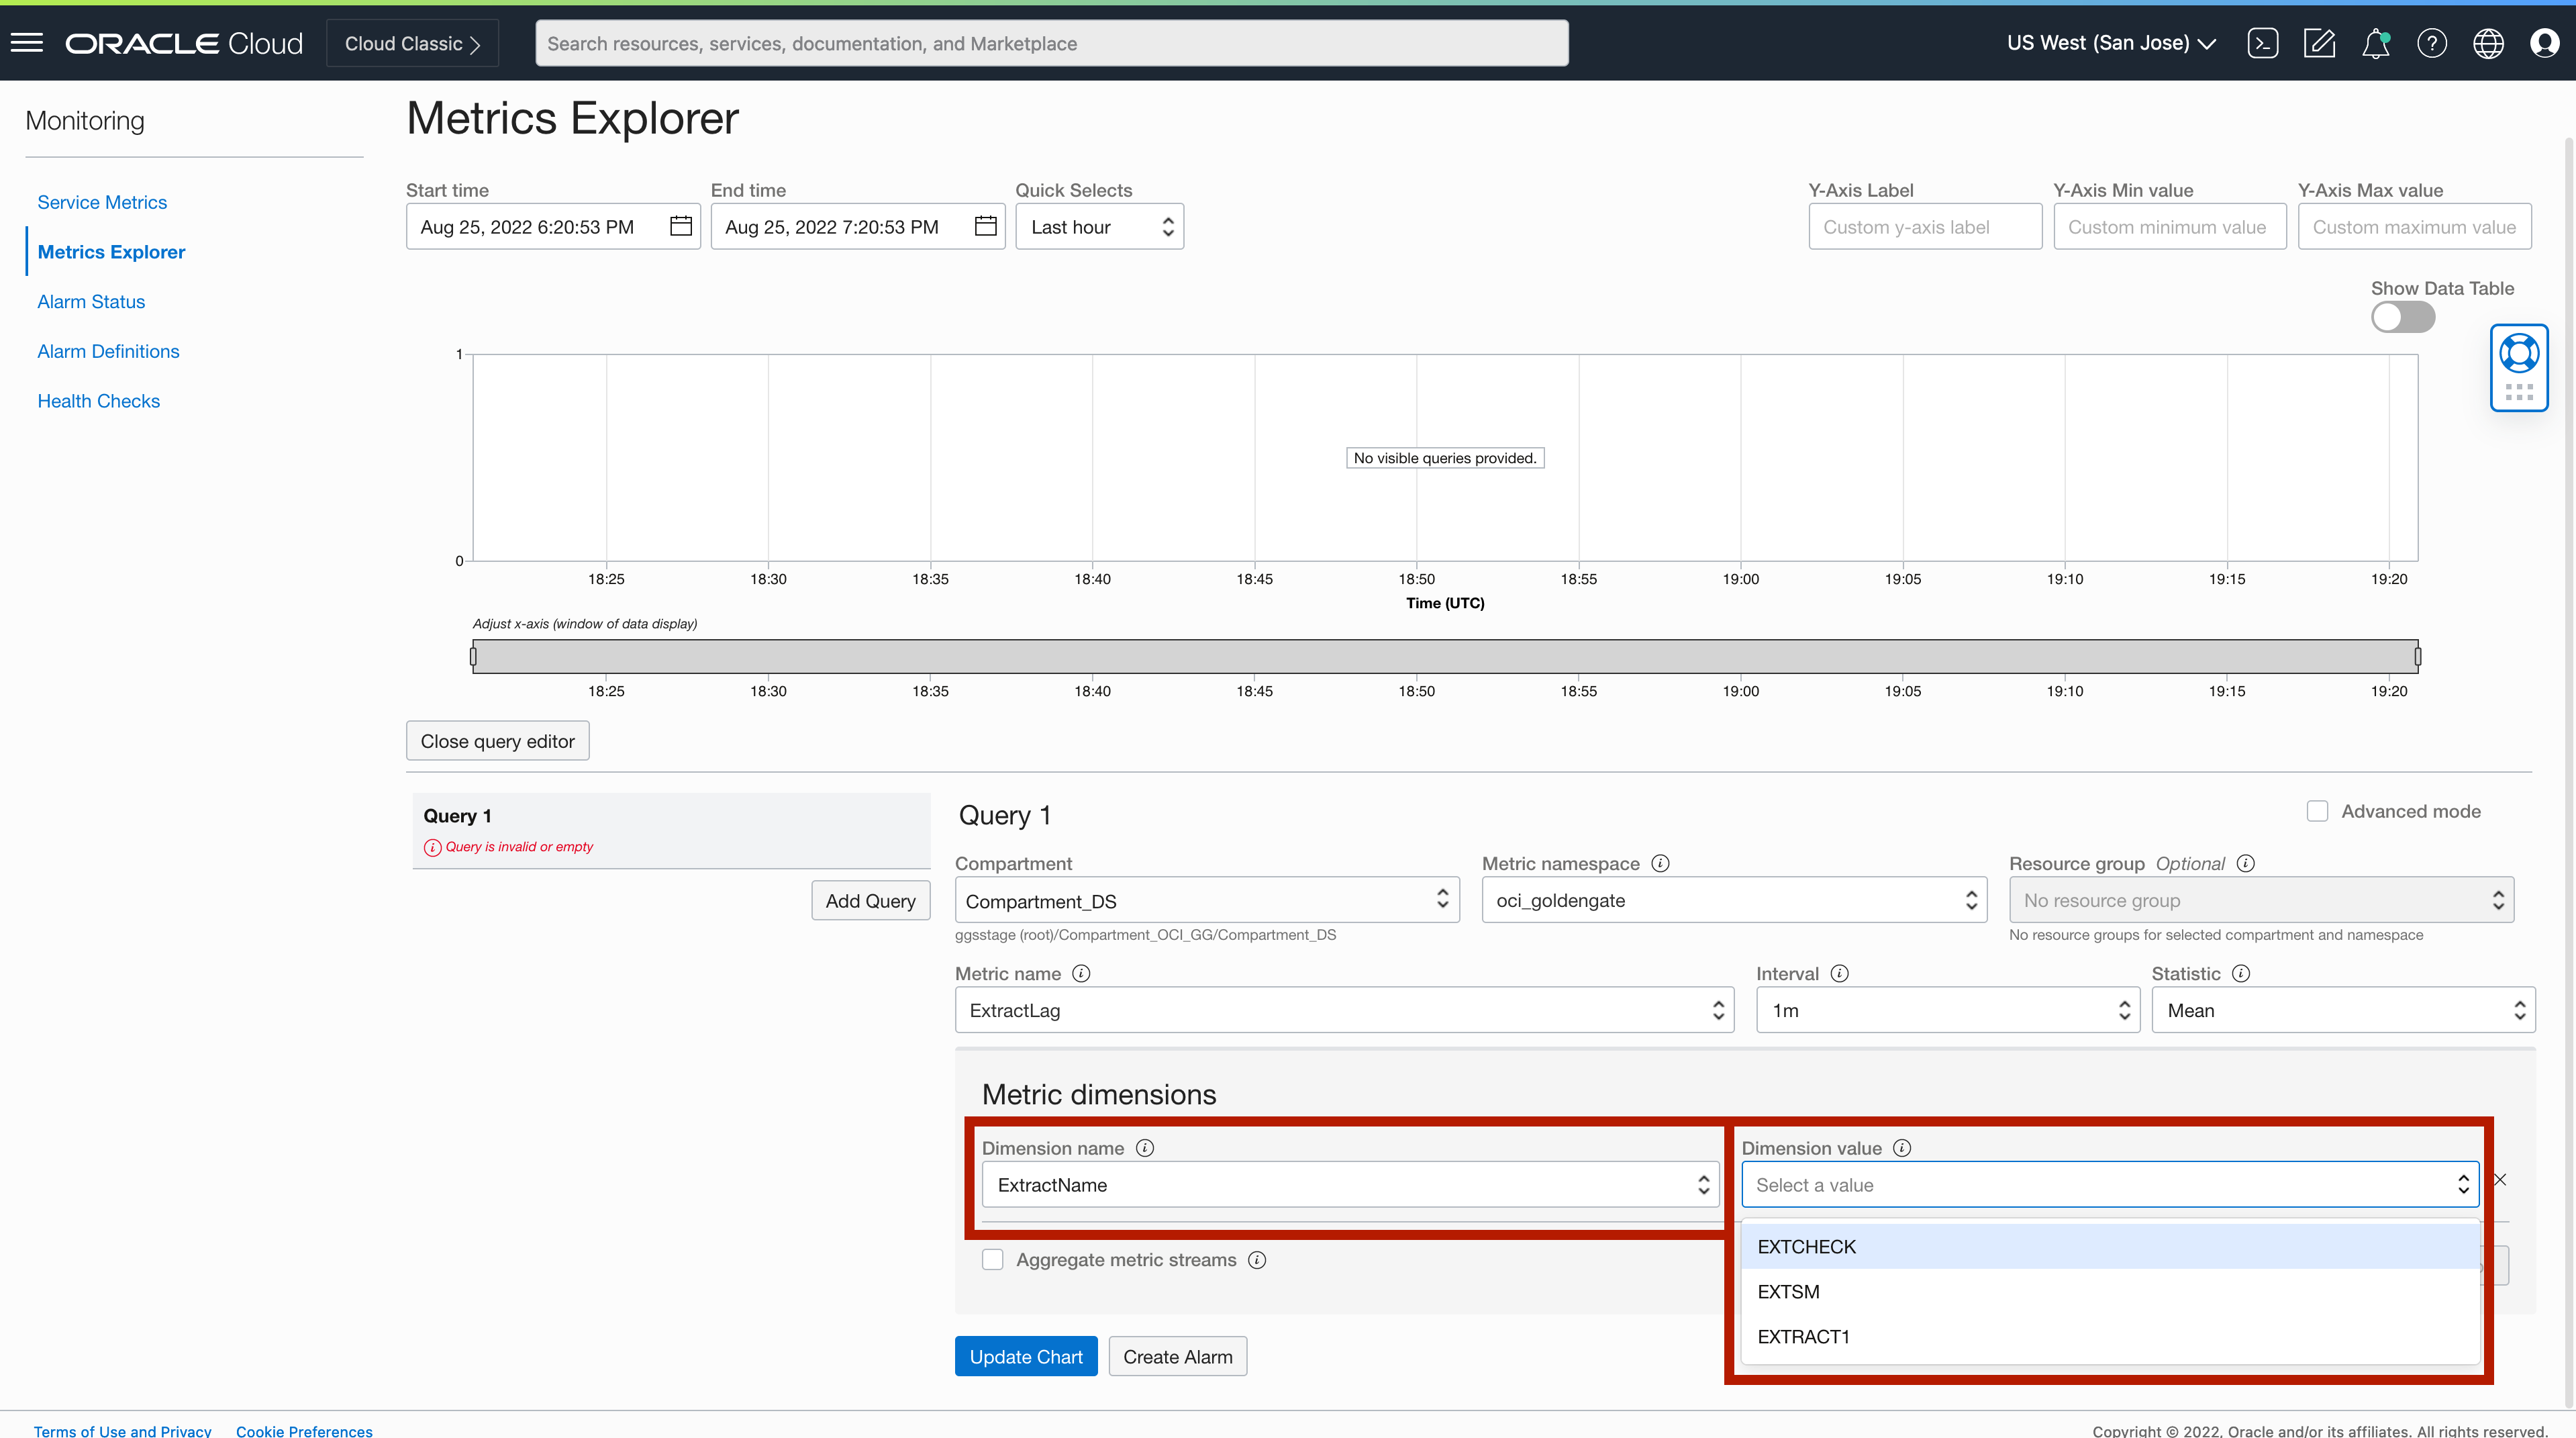
You also need to configure Metric Dimensions. There are two dimensions: Dimension name and Dimension value.
There are 3 different dimension names (name, deploymentid, deploymentName) related to replication process metrics (extract, replicat, distribution path, receiver path). For deployment related metrics, dimension names are: deploymentid and deploymentName.
Dimension value changes depending on the dimension name selected. For example, if ExtractName is selected as dimension name, it would list all the extracts from all the deployments in the selected compartment.
After selecting the query setting and selecting the metric dimensions, you can either update the chart or create an alarm.
If you select Update Chart, a query will be created, along with a single chart showing the trend. You can analyze the Chart using different time frames.
You can create multiple queries here, but only the chart of the selected query is shown. If you want to monitor multiple metrics in parallel, you can use APM Dashboards.
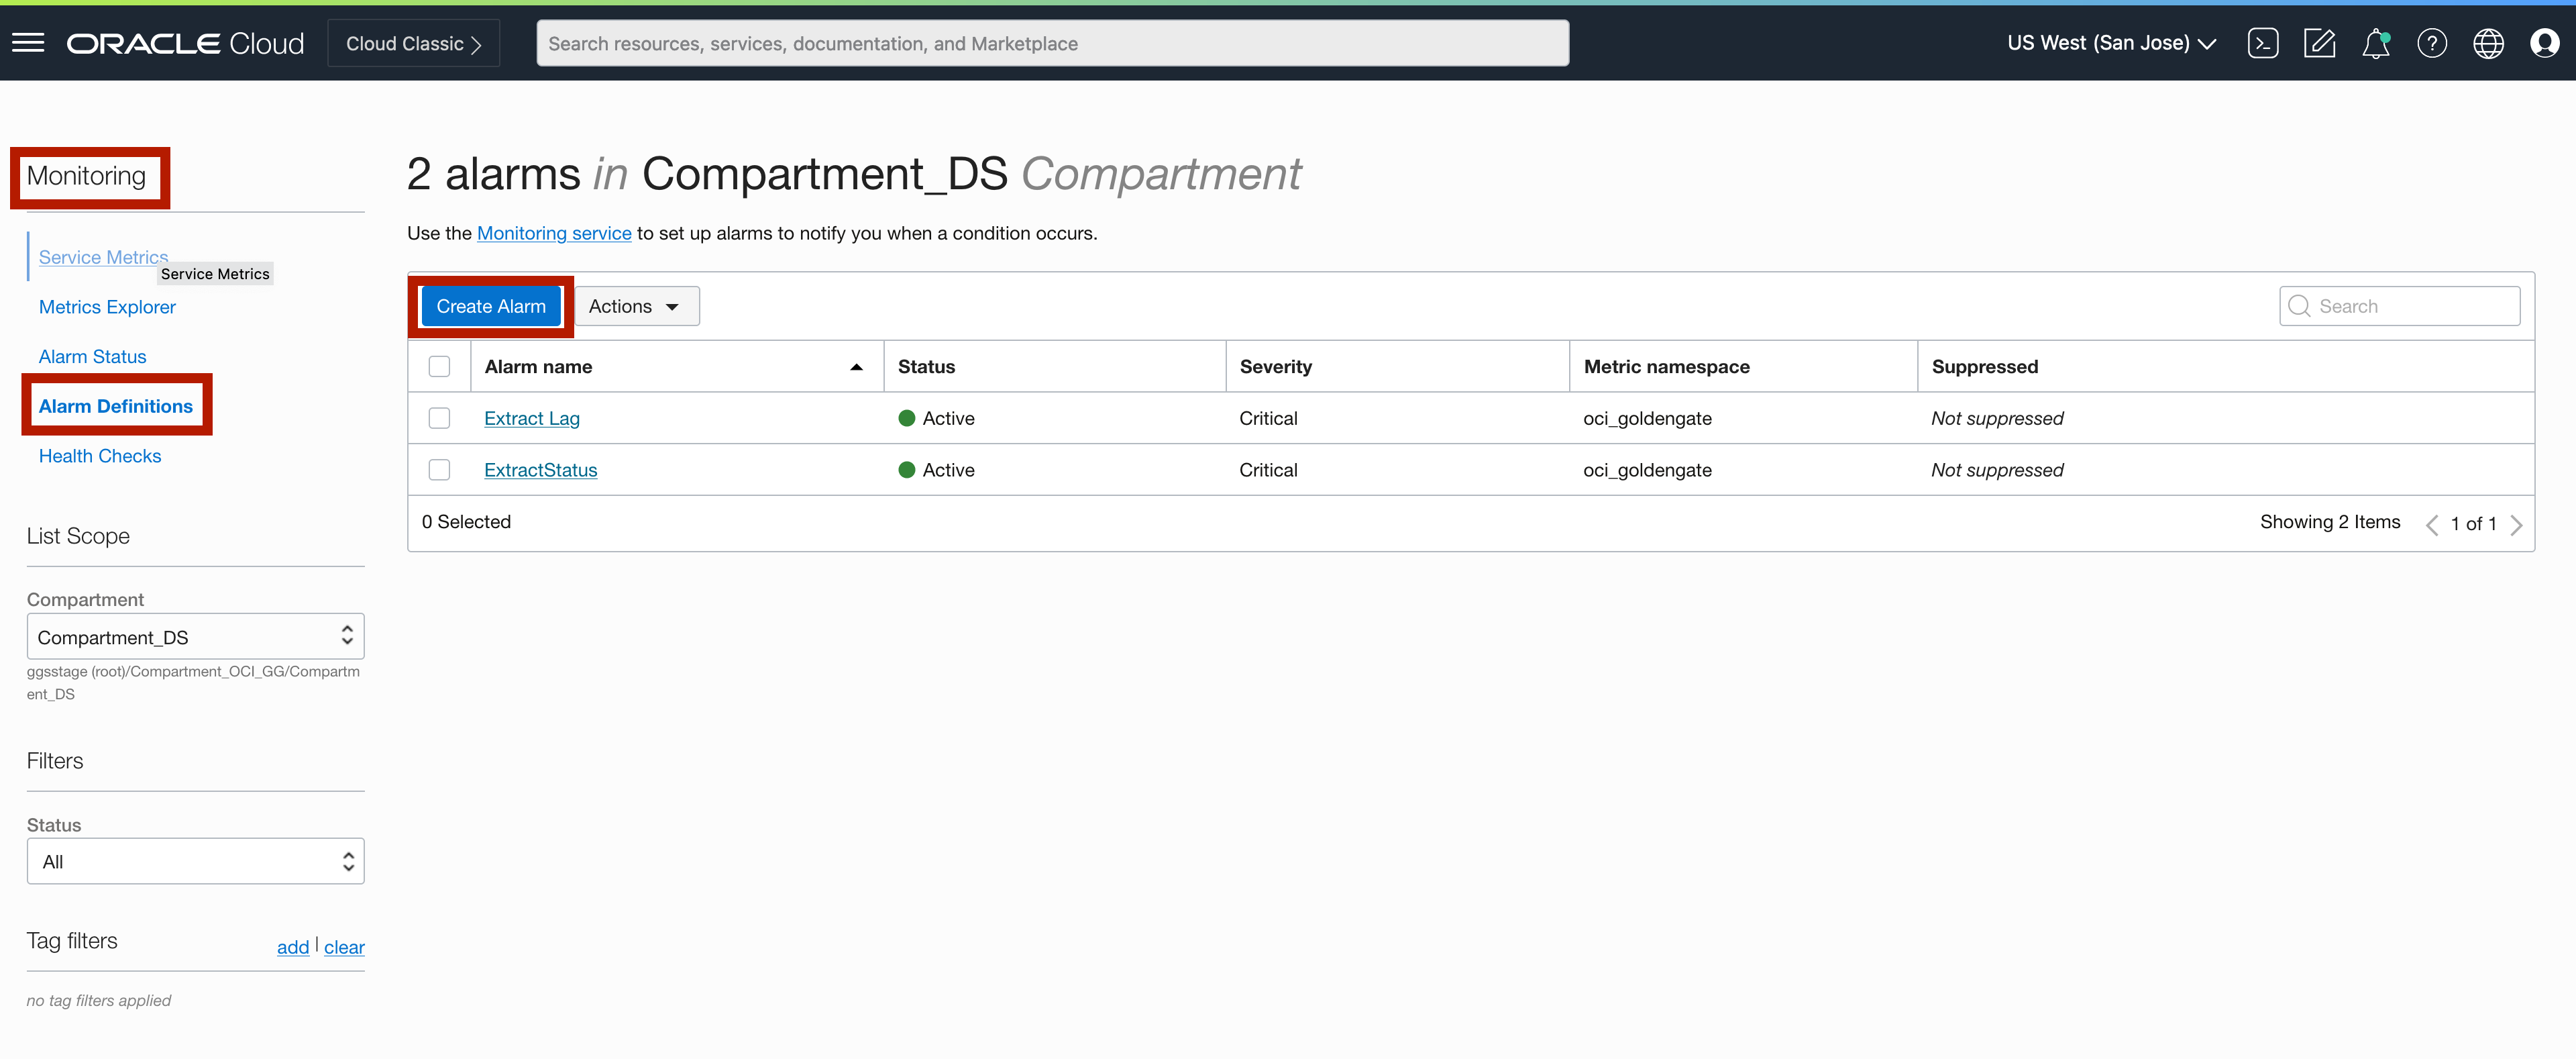
Creating an alarm:
You can create an alarm in Alarm Definitions.
If you select Create Alarm, you can set a rule for triggering an alarm that sends a notification if the metric meets the rule set.
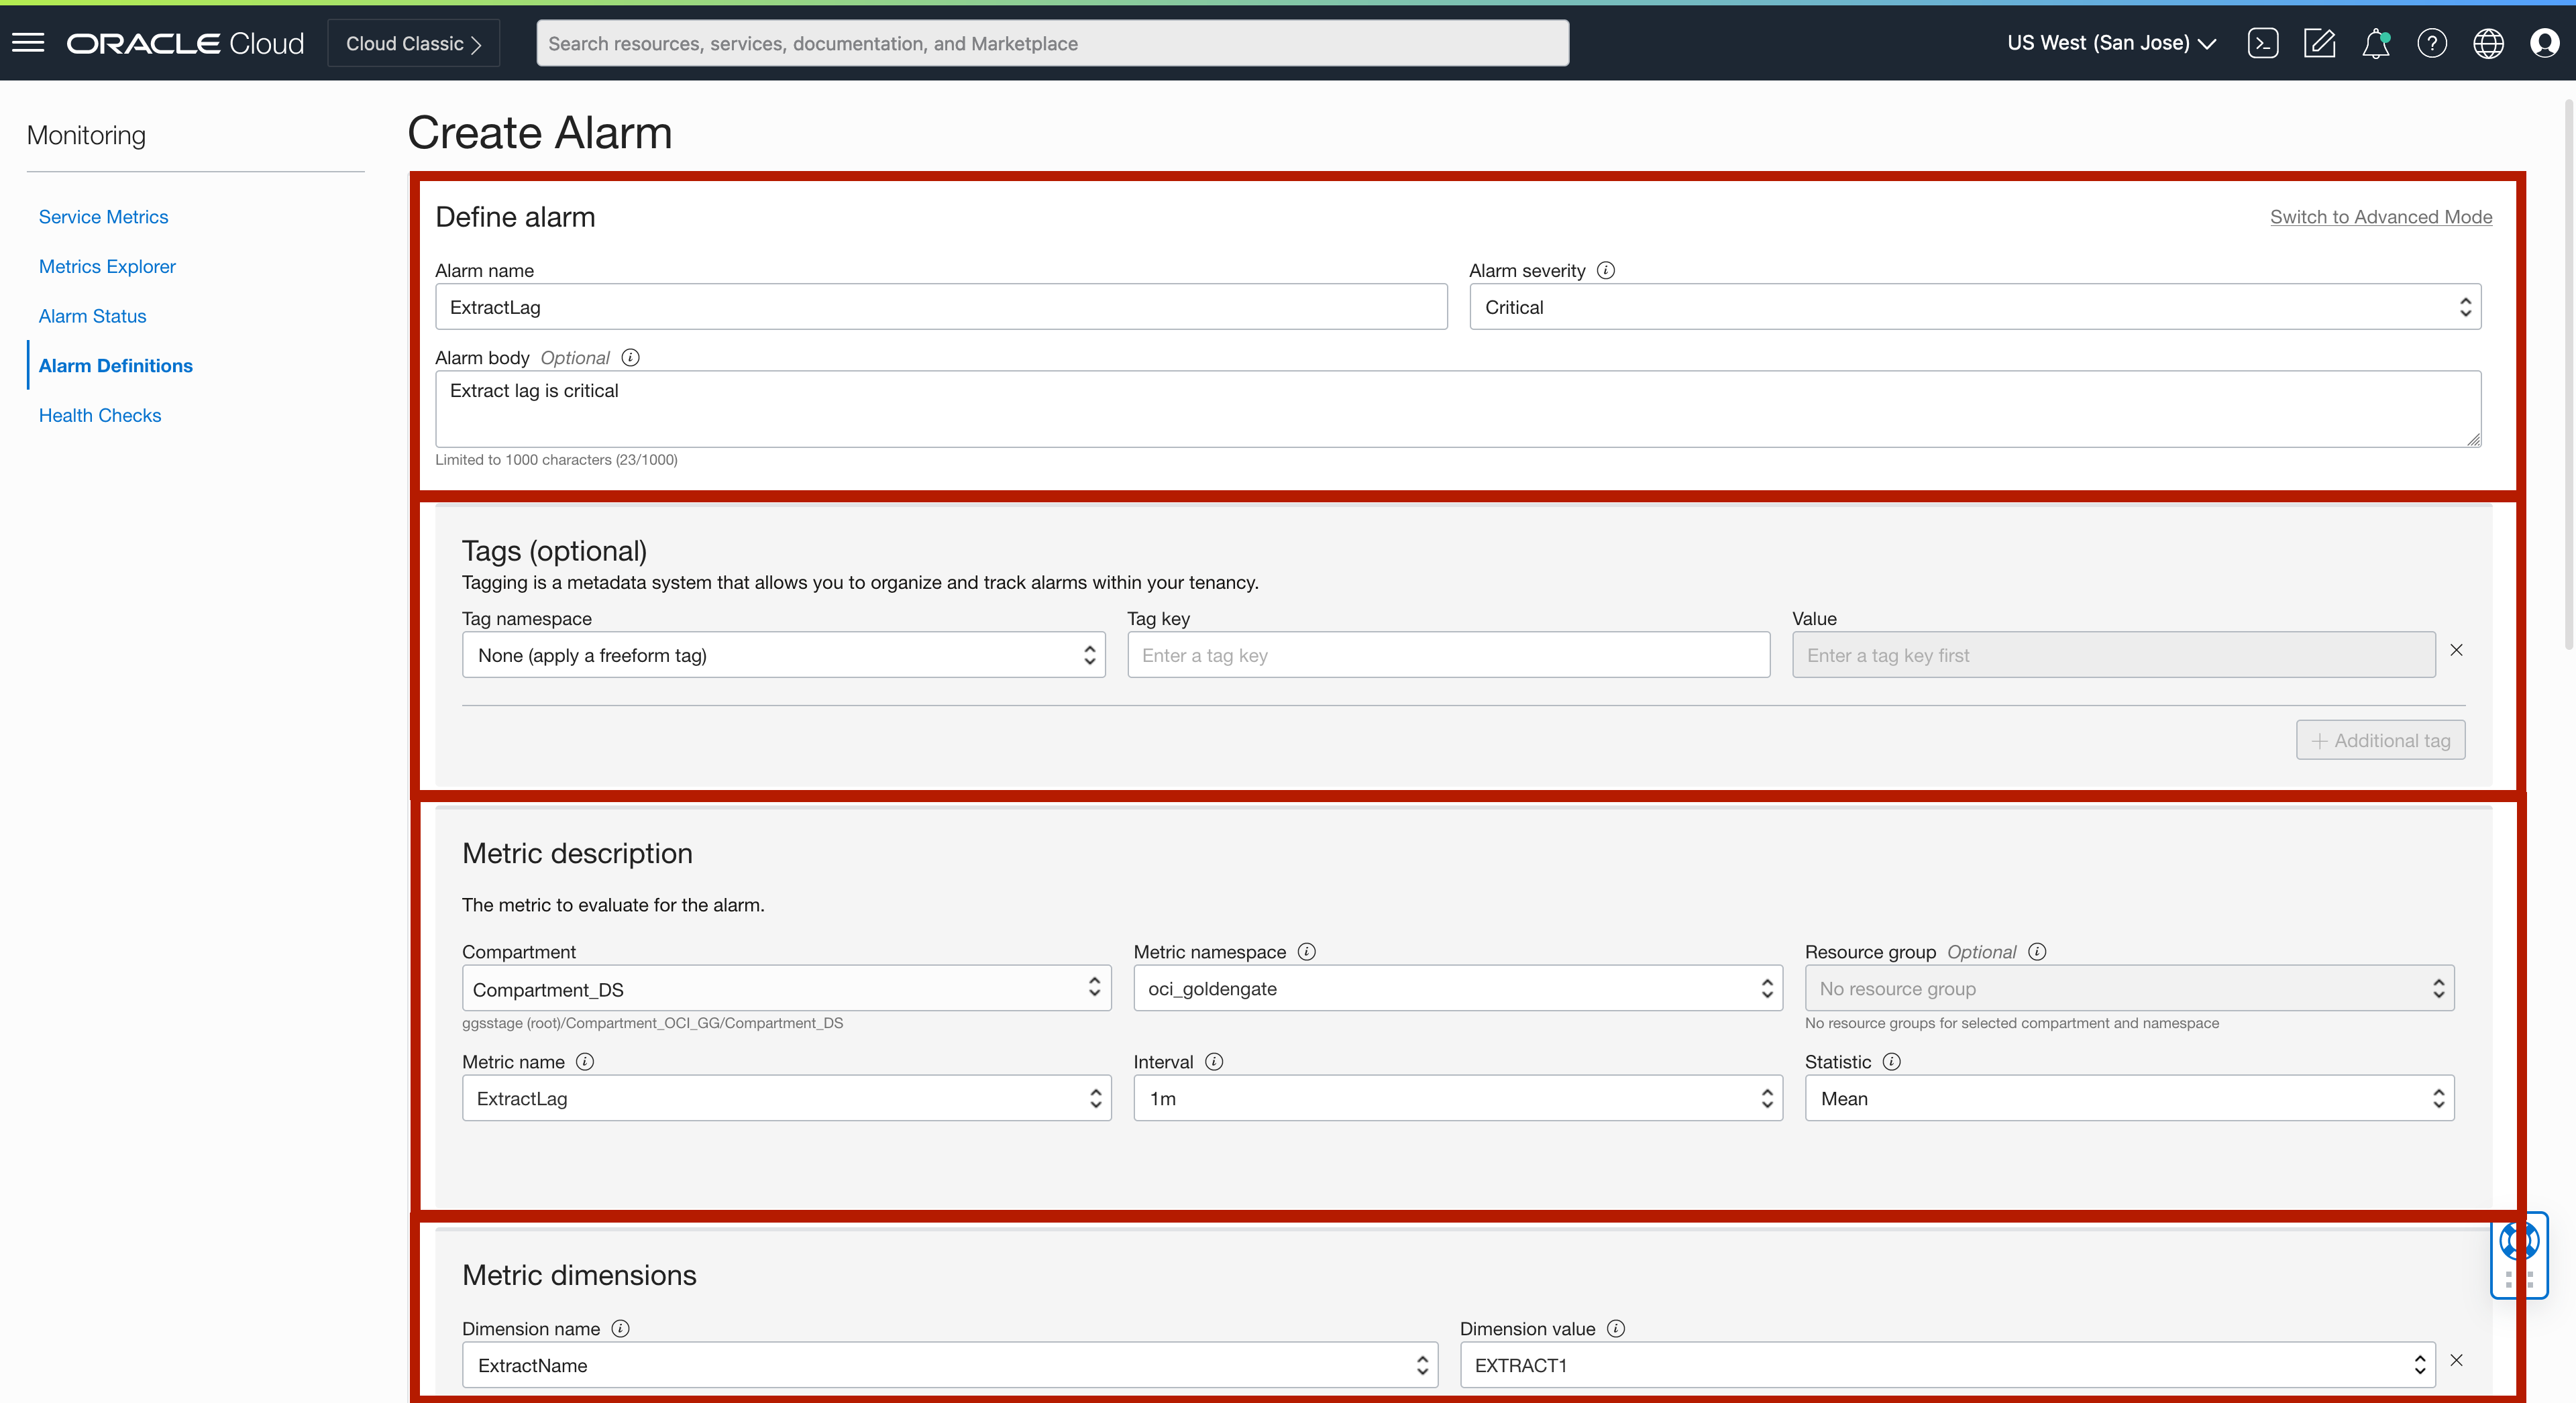
In the Create Alarm screen, provide the following details:
- Alarm Name: The name of the alarm
- Alarm Severity: Severity of the alarm
- Alarm Body: Text message that will be sent with the alarm notification
- Tags (Optional): Tagging an alarm would help with organize your alarms
- Metric Description:
- Compartment: Where OCI GoldenGate deployment is running
- Metric Namespace: oci_goldengate
- Metric Name: Name of the metric which would be monitored for notifications
- Interval: The frequency data points are aggregated
- Statistic: Aggregation fucntion
- Metric Dimension: Filter of the metric that would be used for monitoring
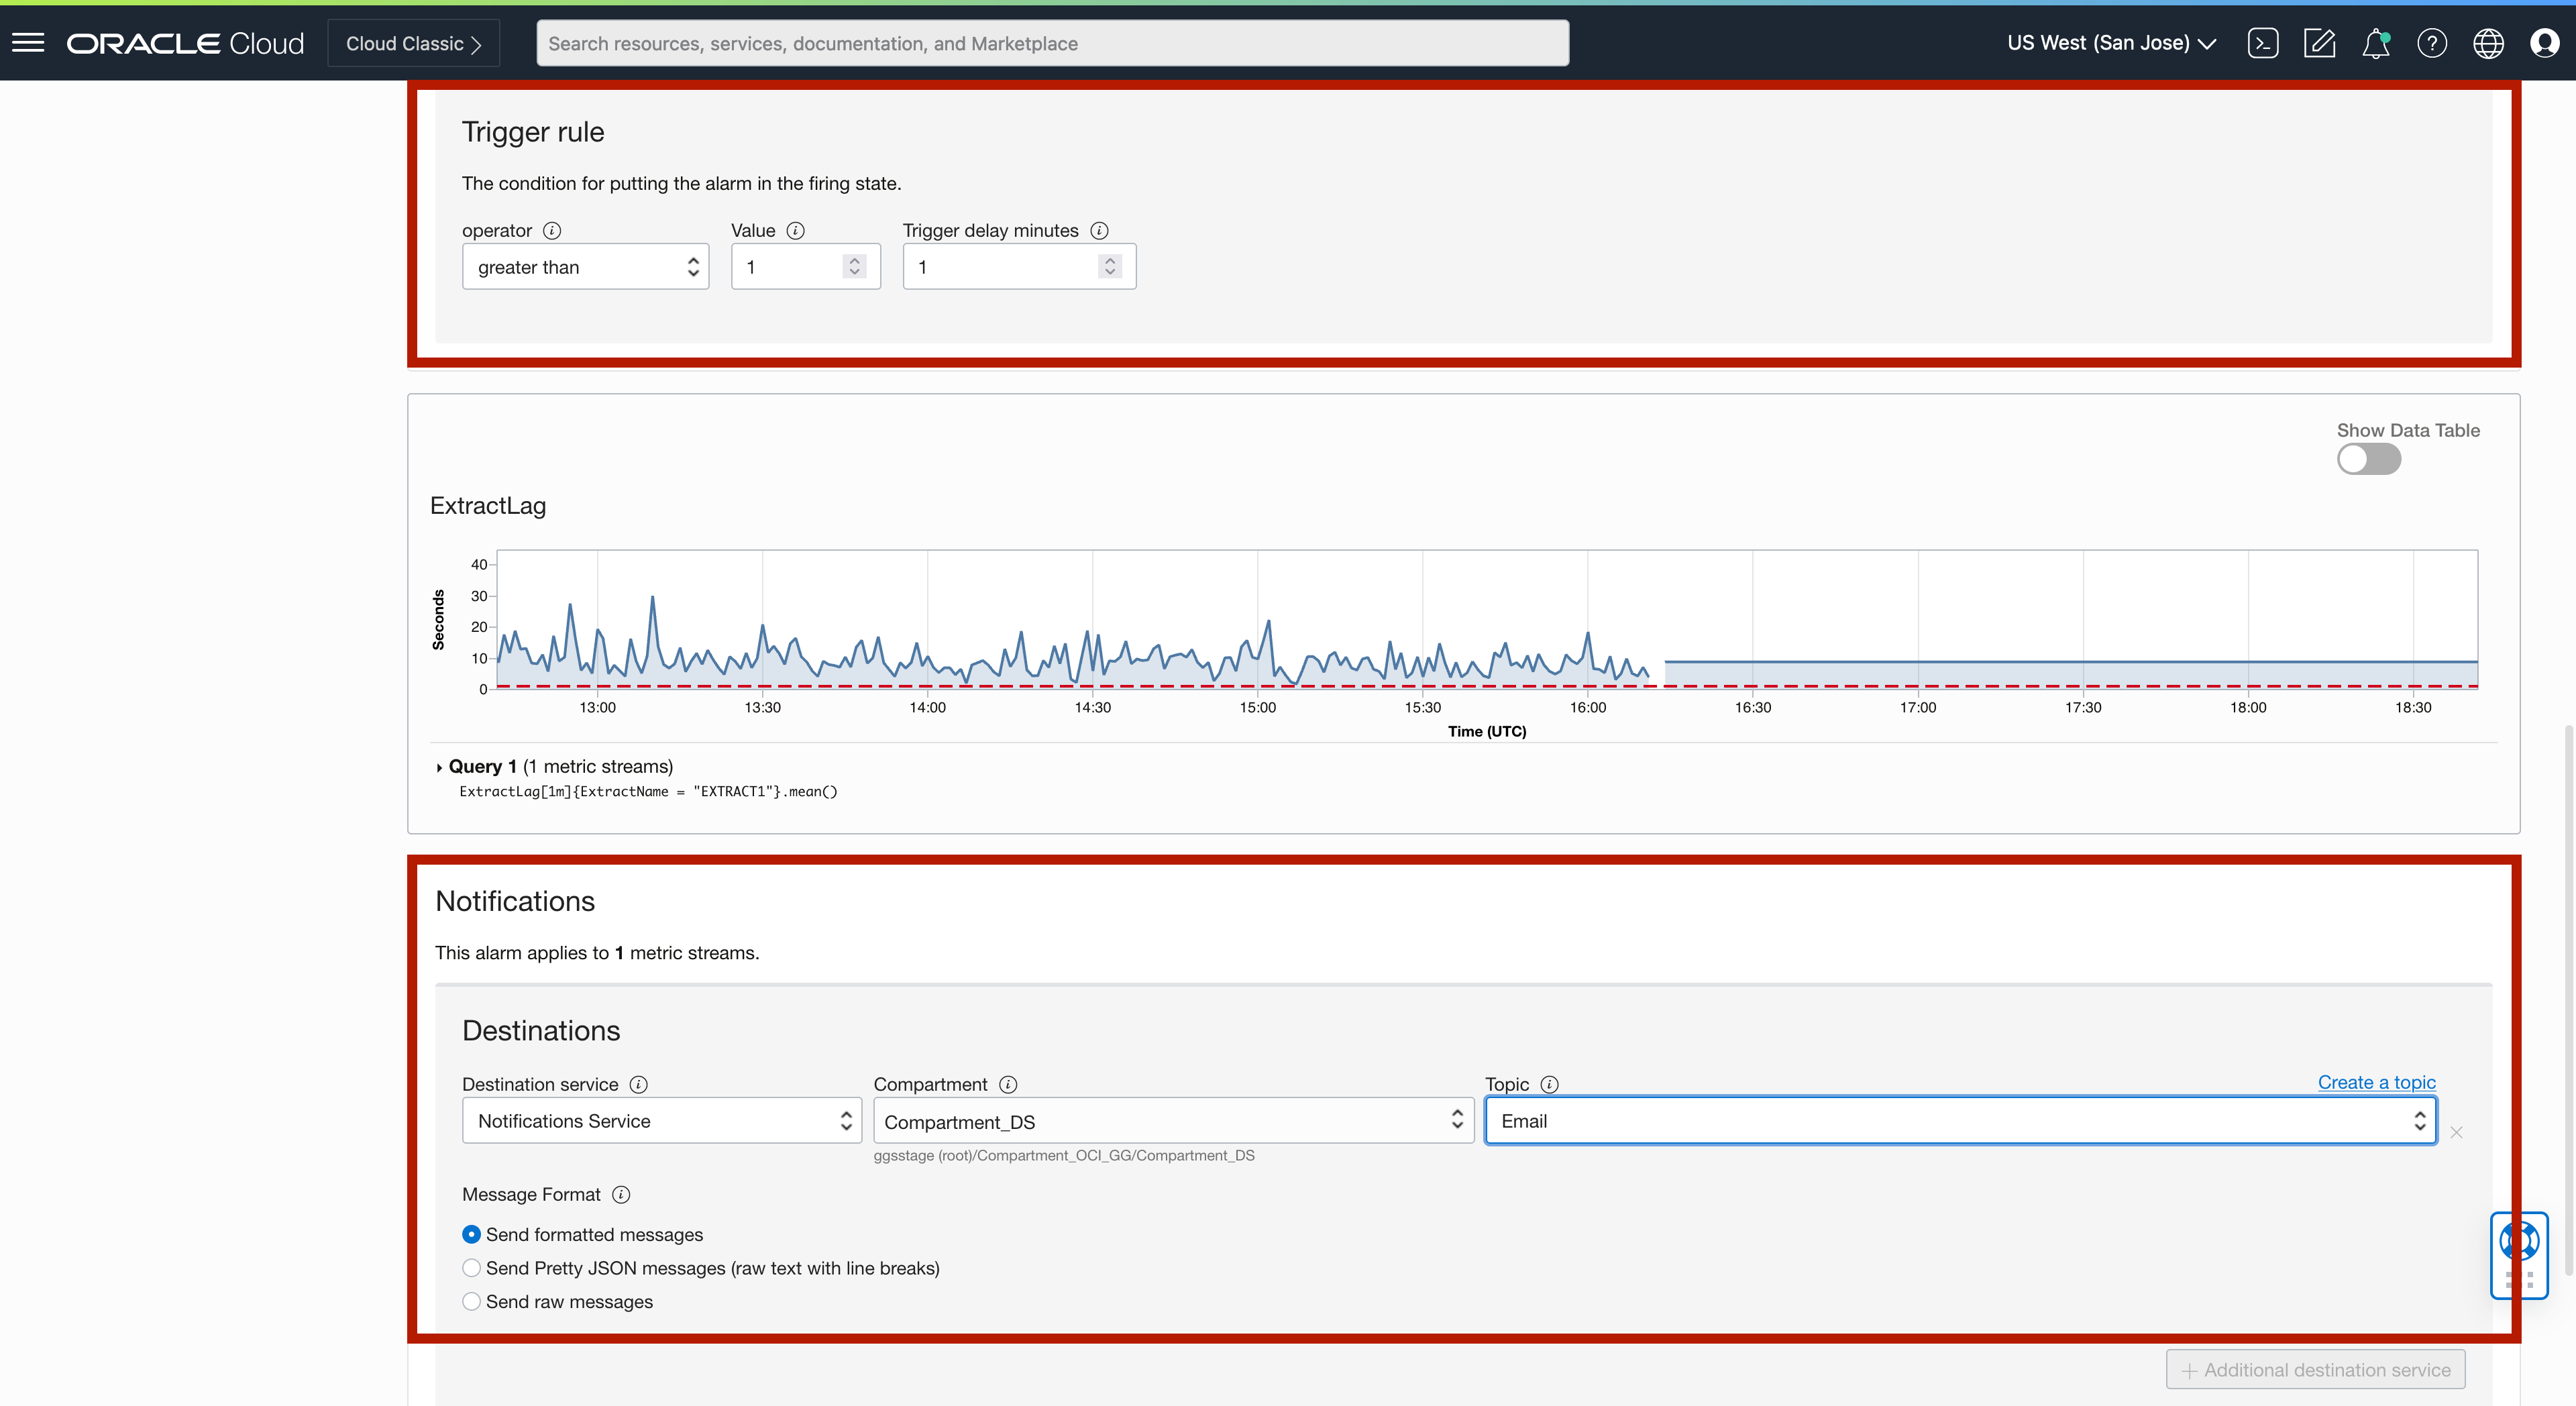
- Trigger Rule: The condition for putting the alarm in the firing place
- Notifications:
- Destination Service: Defaulted to Notifications Service
- Compartment: Compartment where alarm will be created
- Topic: Channel used for sending notifications when this alarm is in the firing state. You can use an existing one or create a new one. Topic comes with 6 different subscription protocols (channels): Email, Function, Https, PagerDuty, Slack, SMS (for available countries)
- Message Format: The format to use in notification messages
- Enable This Alarm: Needs to be selected to set the alarm in an active state
Click Save Alarm.

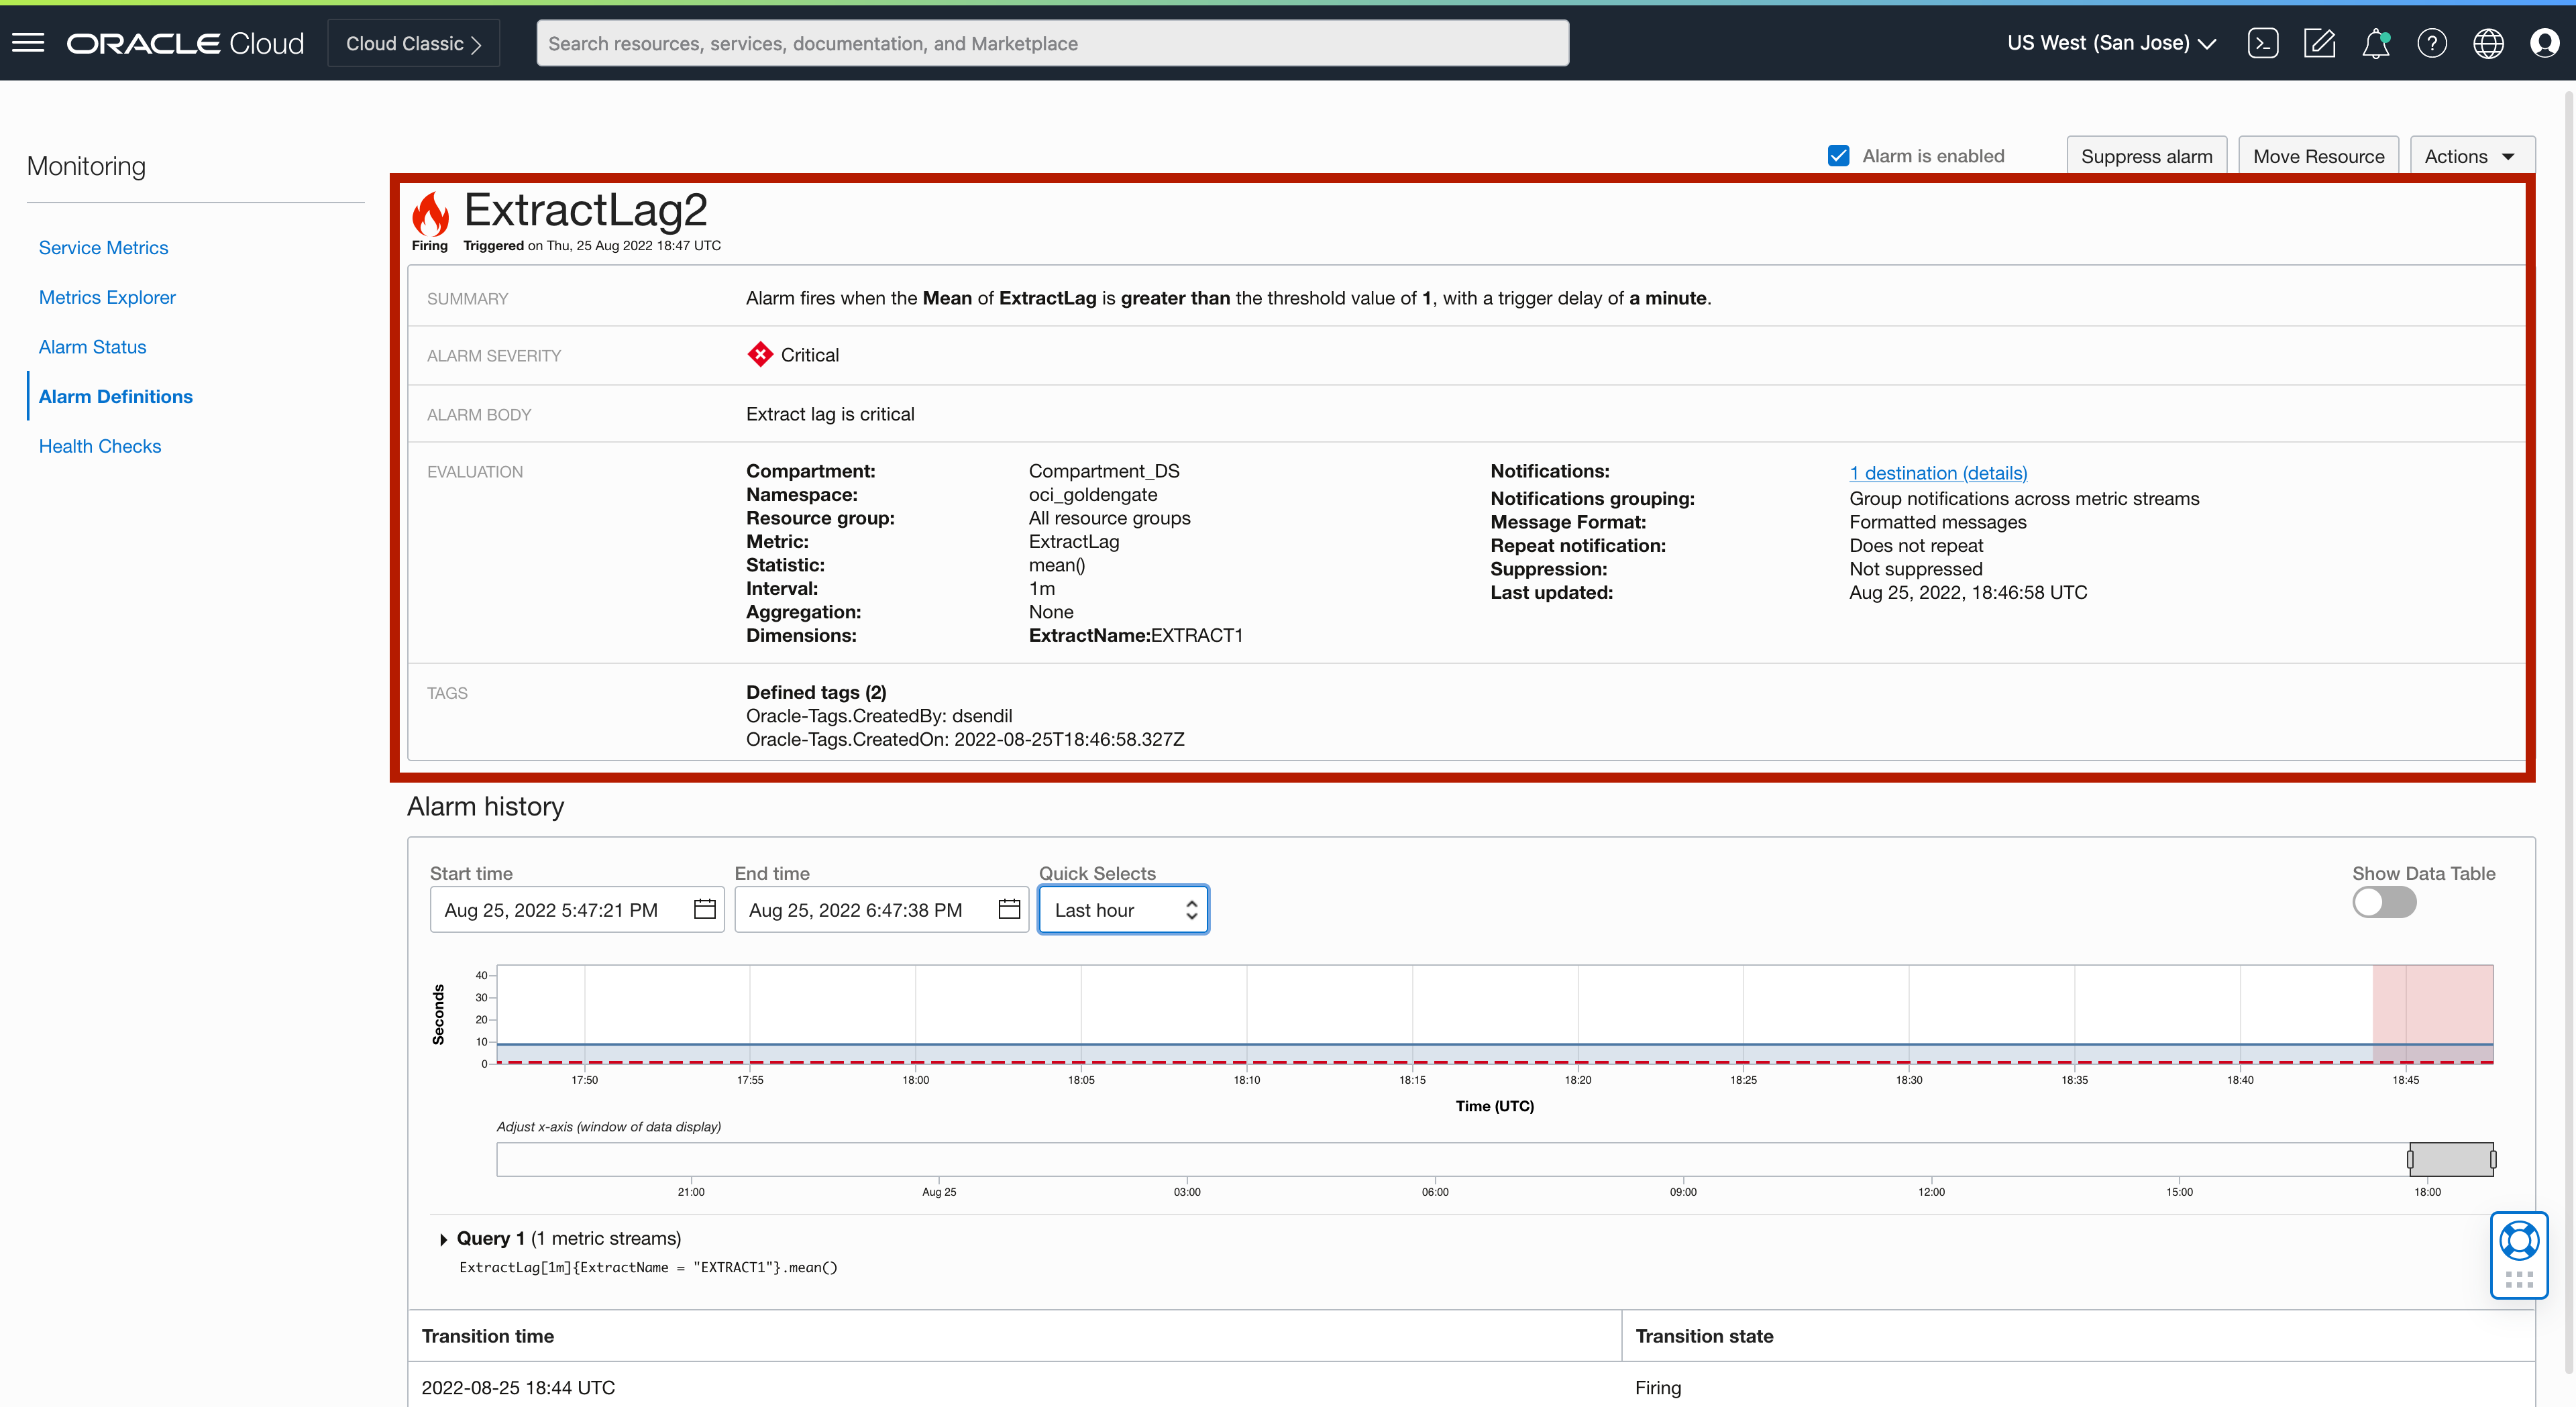
After the alarm is created, you can see the details of the alarm.
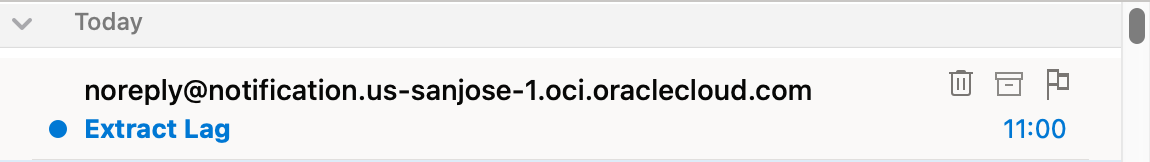
When the alarm is fired, you’ll receive a message through the channel that you set up in topic. In my case, I configured email and received the following email.
Using Application Performance Monitoring Dashboards (APM) to Monitor OCI GoldenGate
OCI Application Performance Monitoring (APM) is a service that provides deep visibility into the performance of applications, offers the ability to diagnose issues quickly to deliver a consistent level of service. This includes monitoring multiple components and application logic spread across clients, third-party services, and back-end computing tiers, on-premises or in the cloud.
APM Dashboards is natively integrated with OCI GoldenGate. You can create dashboards to monitor various OCI GoldenGate metrics. If needed, you can monitor other OCI service metrics together with OCI GoldenGate metrics in the same dashboard. This would give you the ability to diagnose the issues more easily.
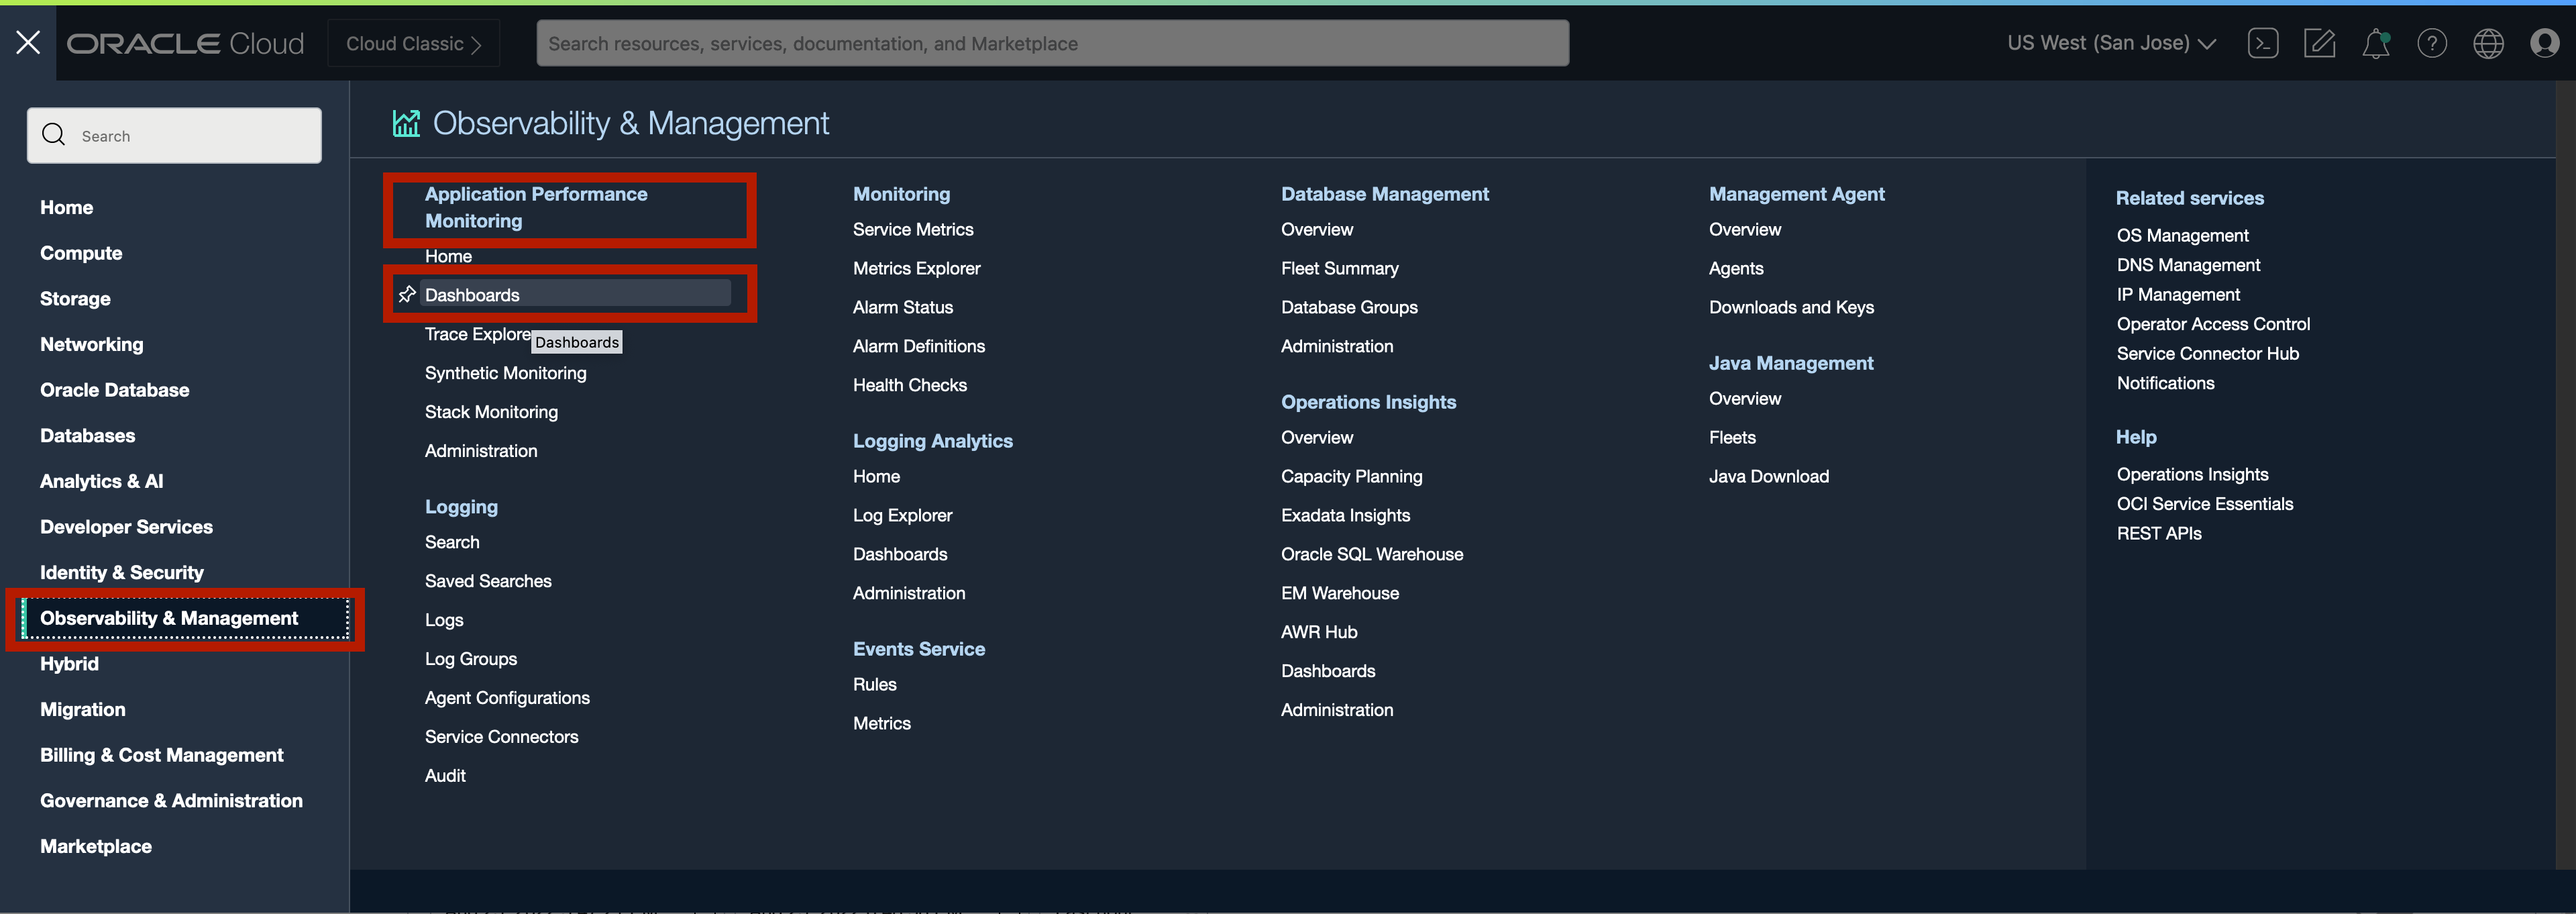
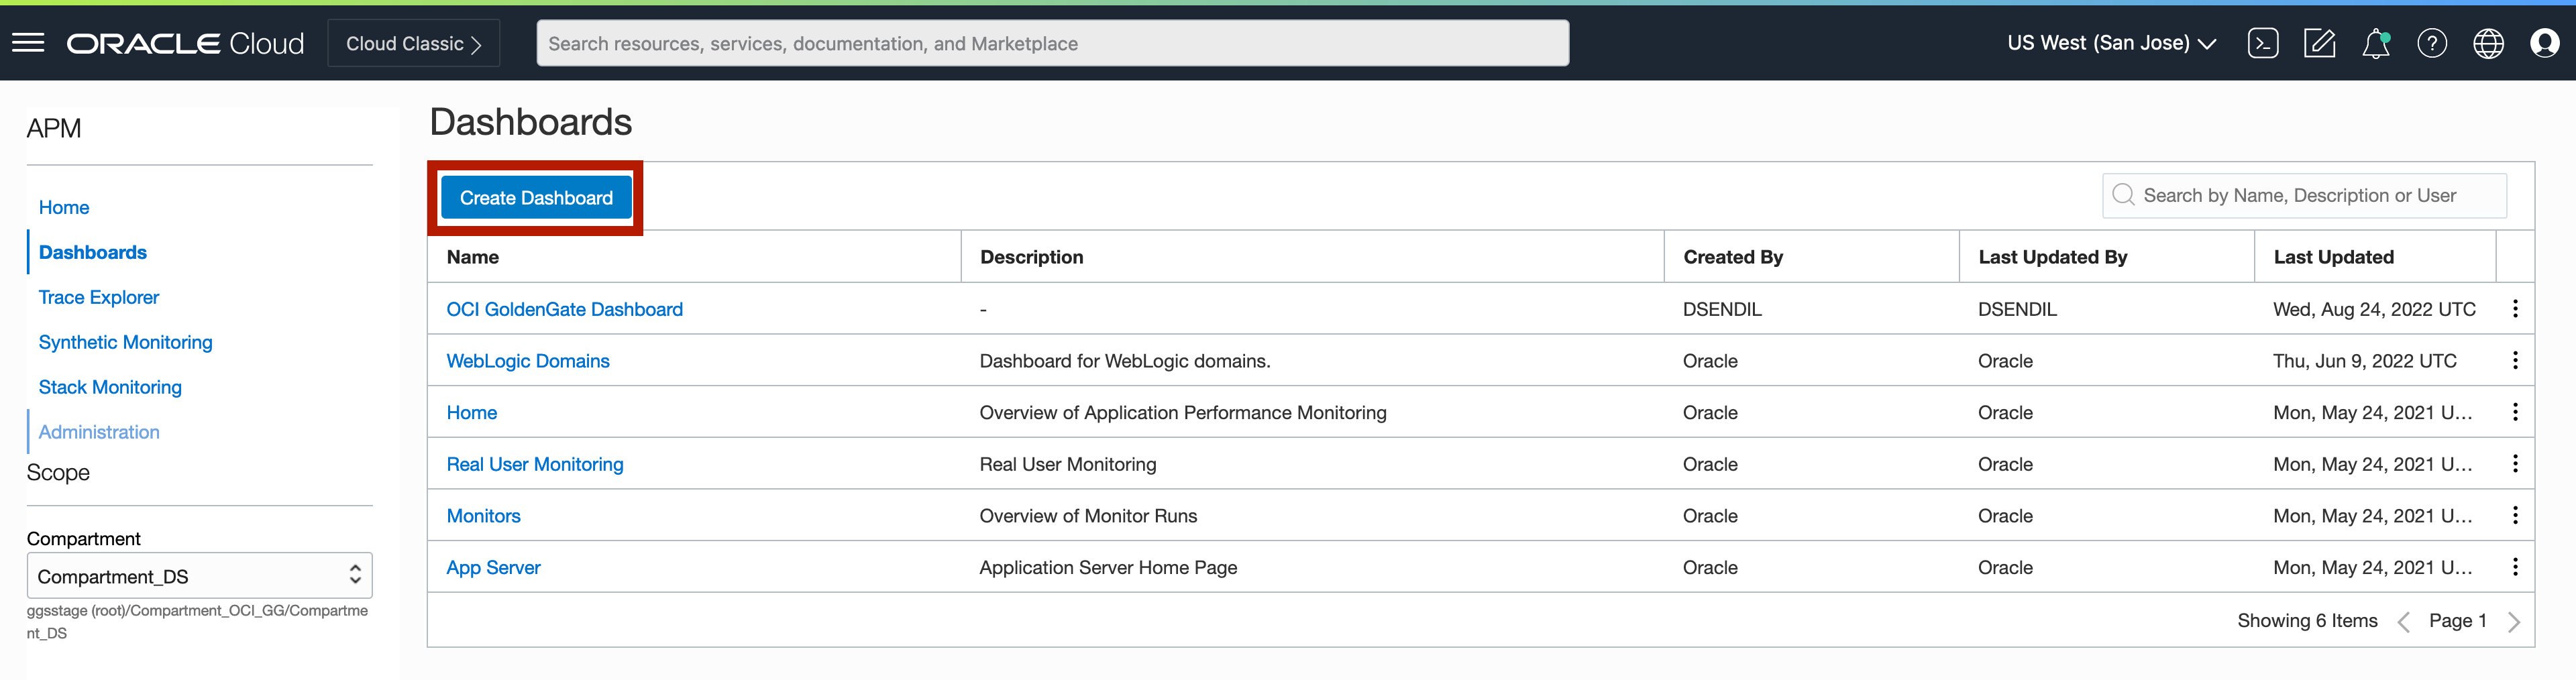
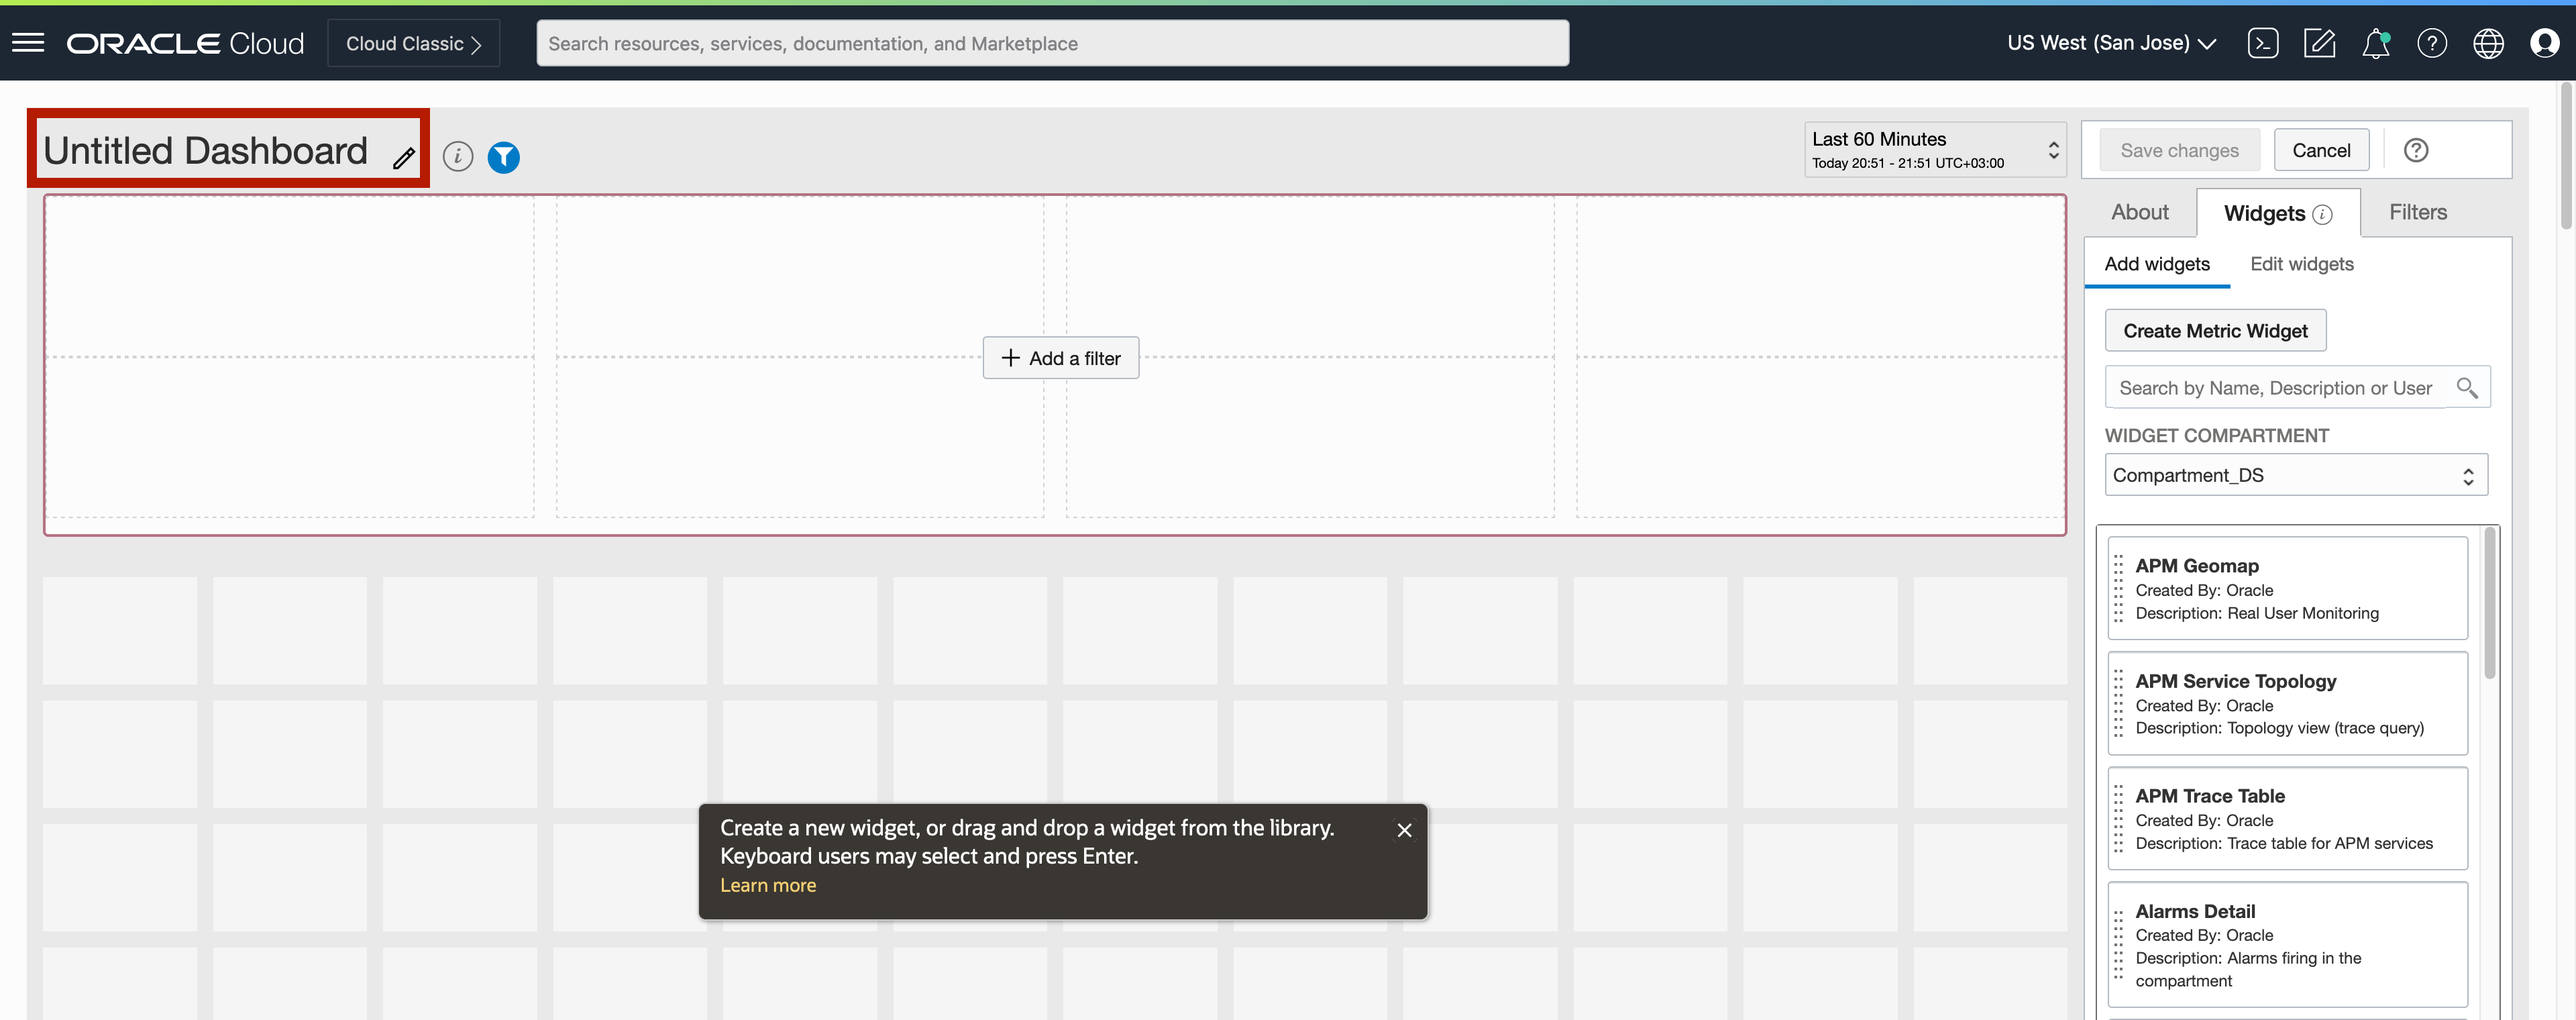
To get to APM, go to Observability & Management, and under Application Performance Monitoring, click Dashboards. Click Create Dashboard.
To Name your dashboard, click on the top left of the screen or in About field on the right.
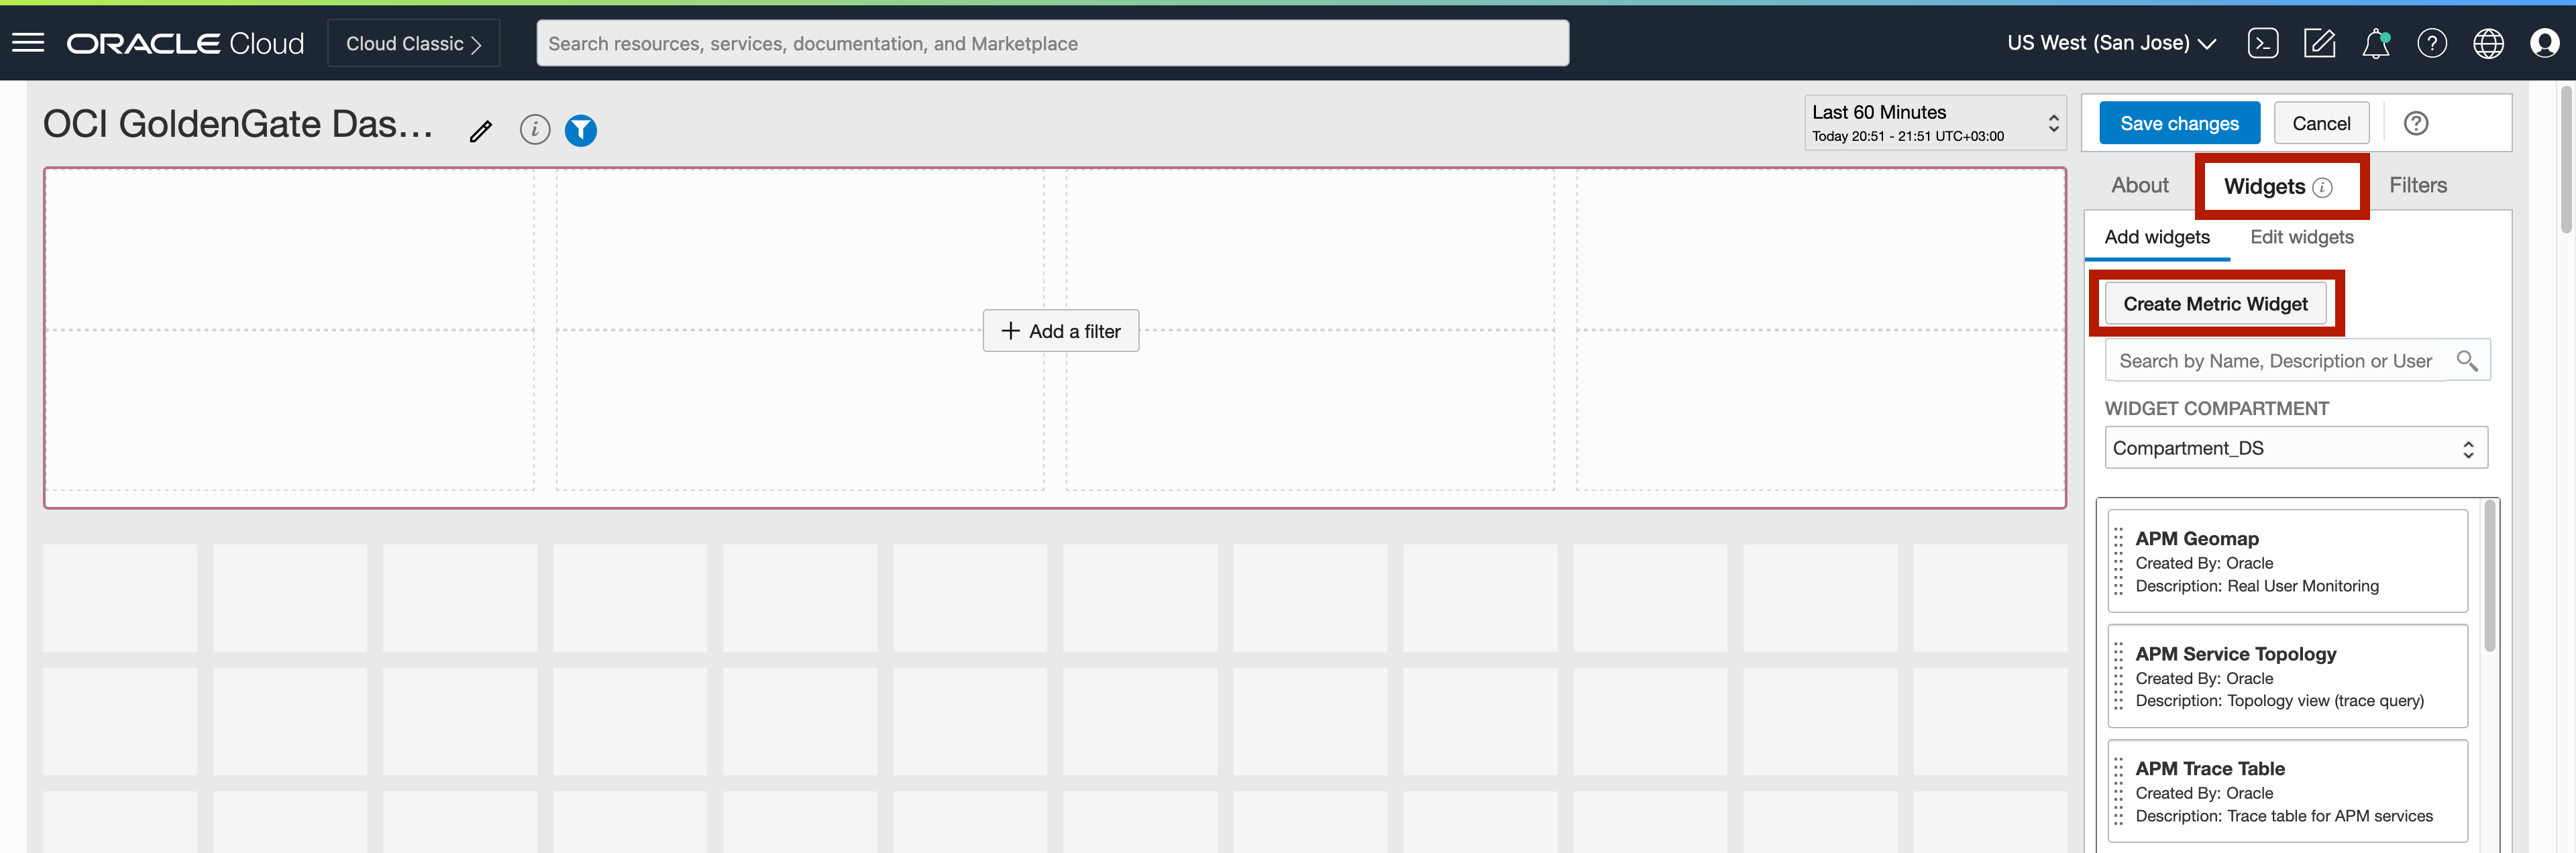
To add visuals/ metrics to your dashboards, you need to add Widgets. Widget is a mini-report that can display the metric in various presentation styles. Toa dd a widget, click Create Metric Widget in widgets.
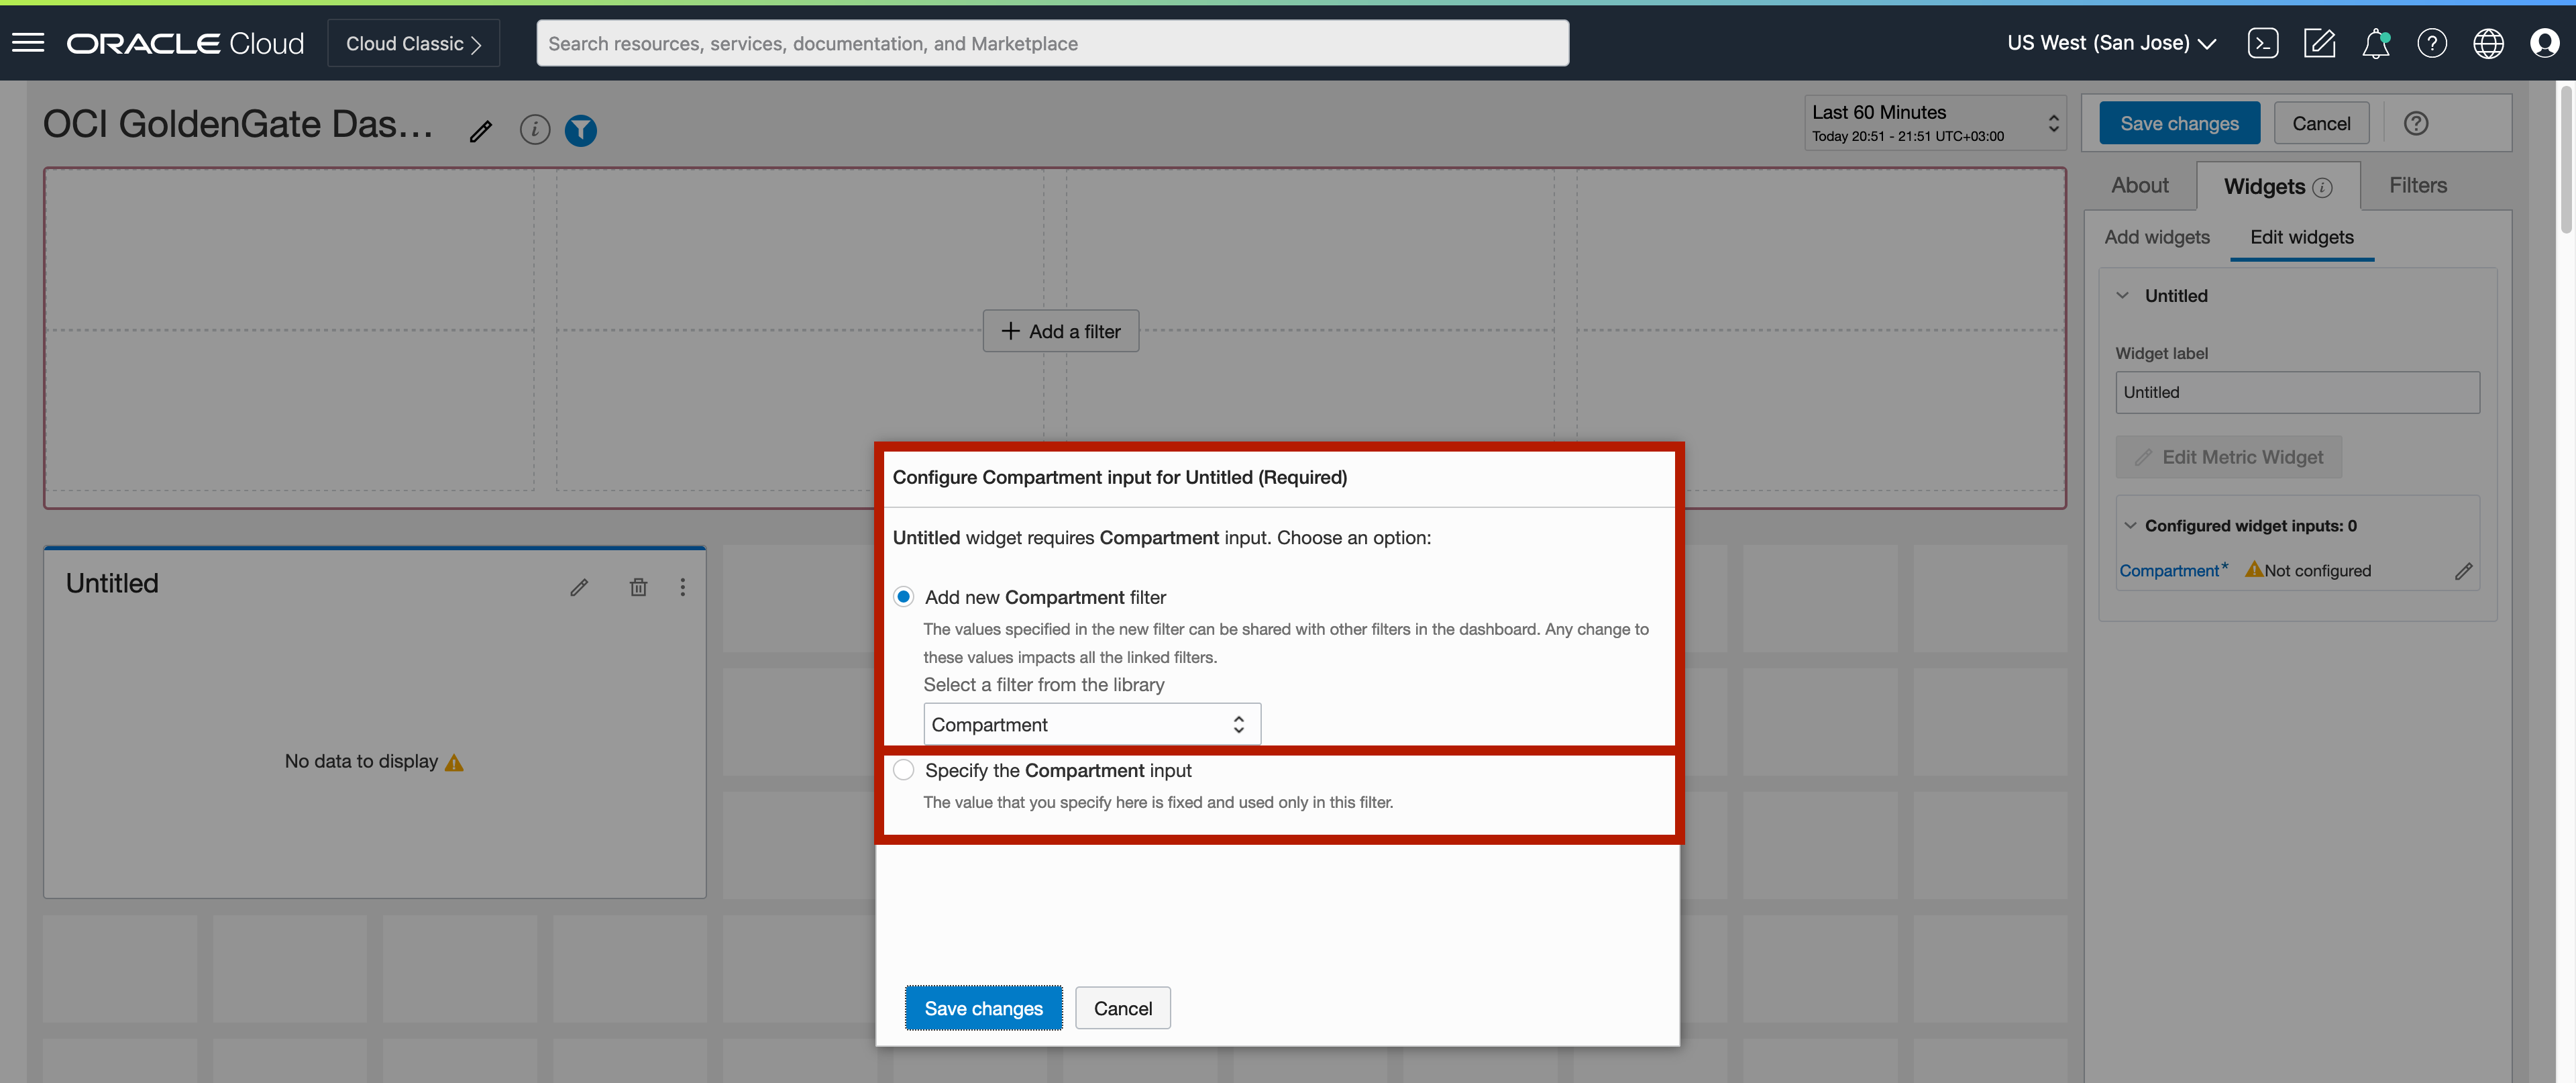
In the pop-up screen, you can add new compartment filter or specify the compartment input. If you add a new compartment filter, it will add a drop-down list to your dashboard in which you can navigate between different compartments. If you select specify the compartment input, it will be fixed and used only as the selected compartment.
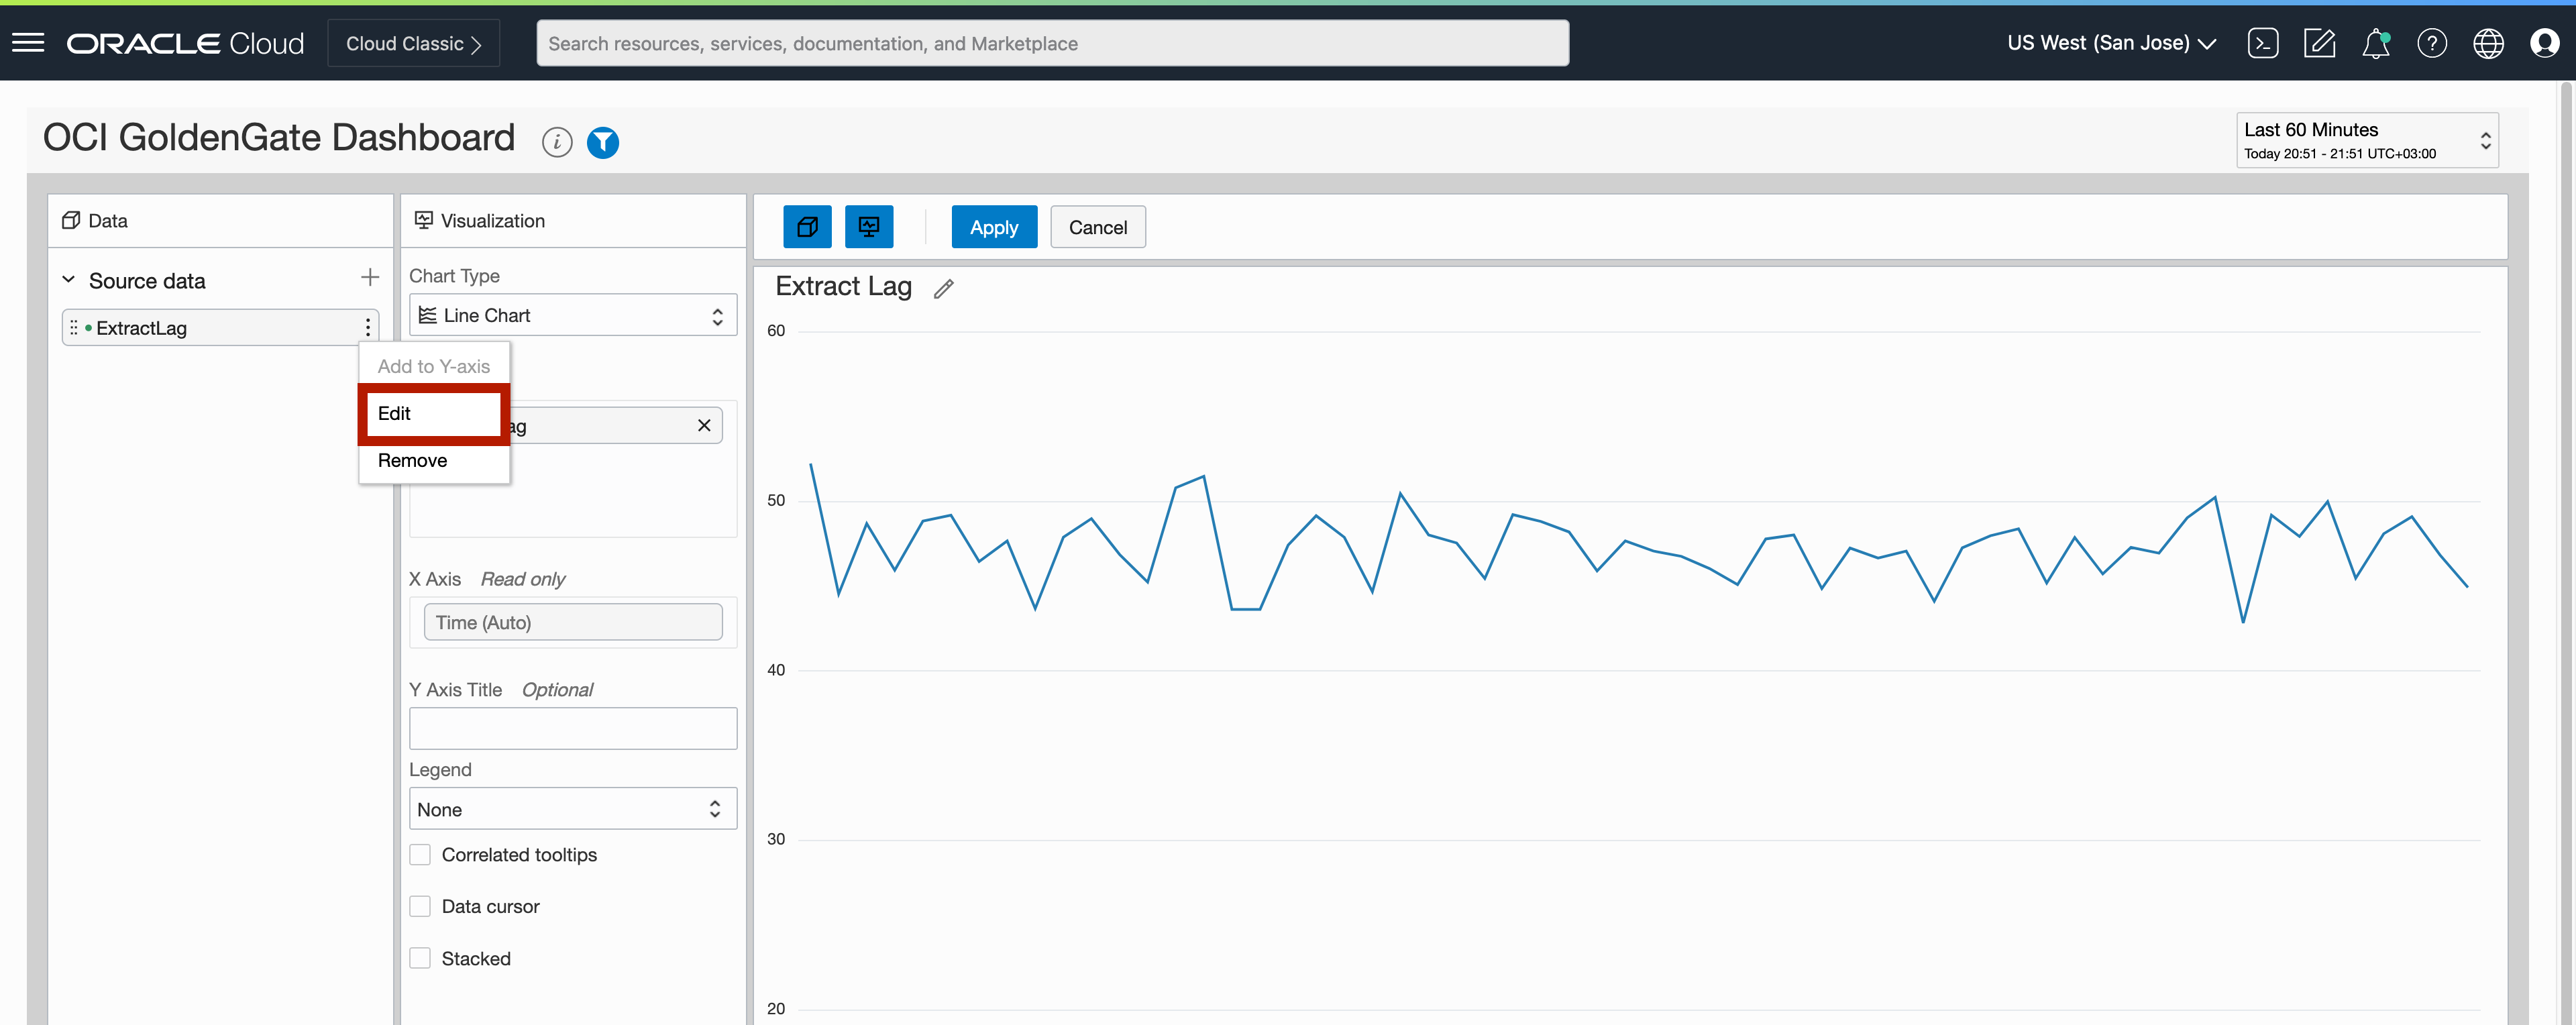
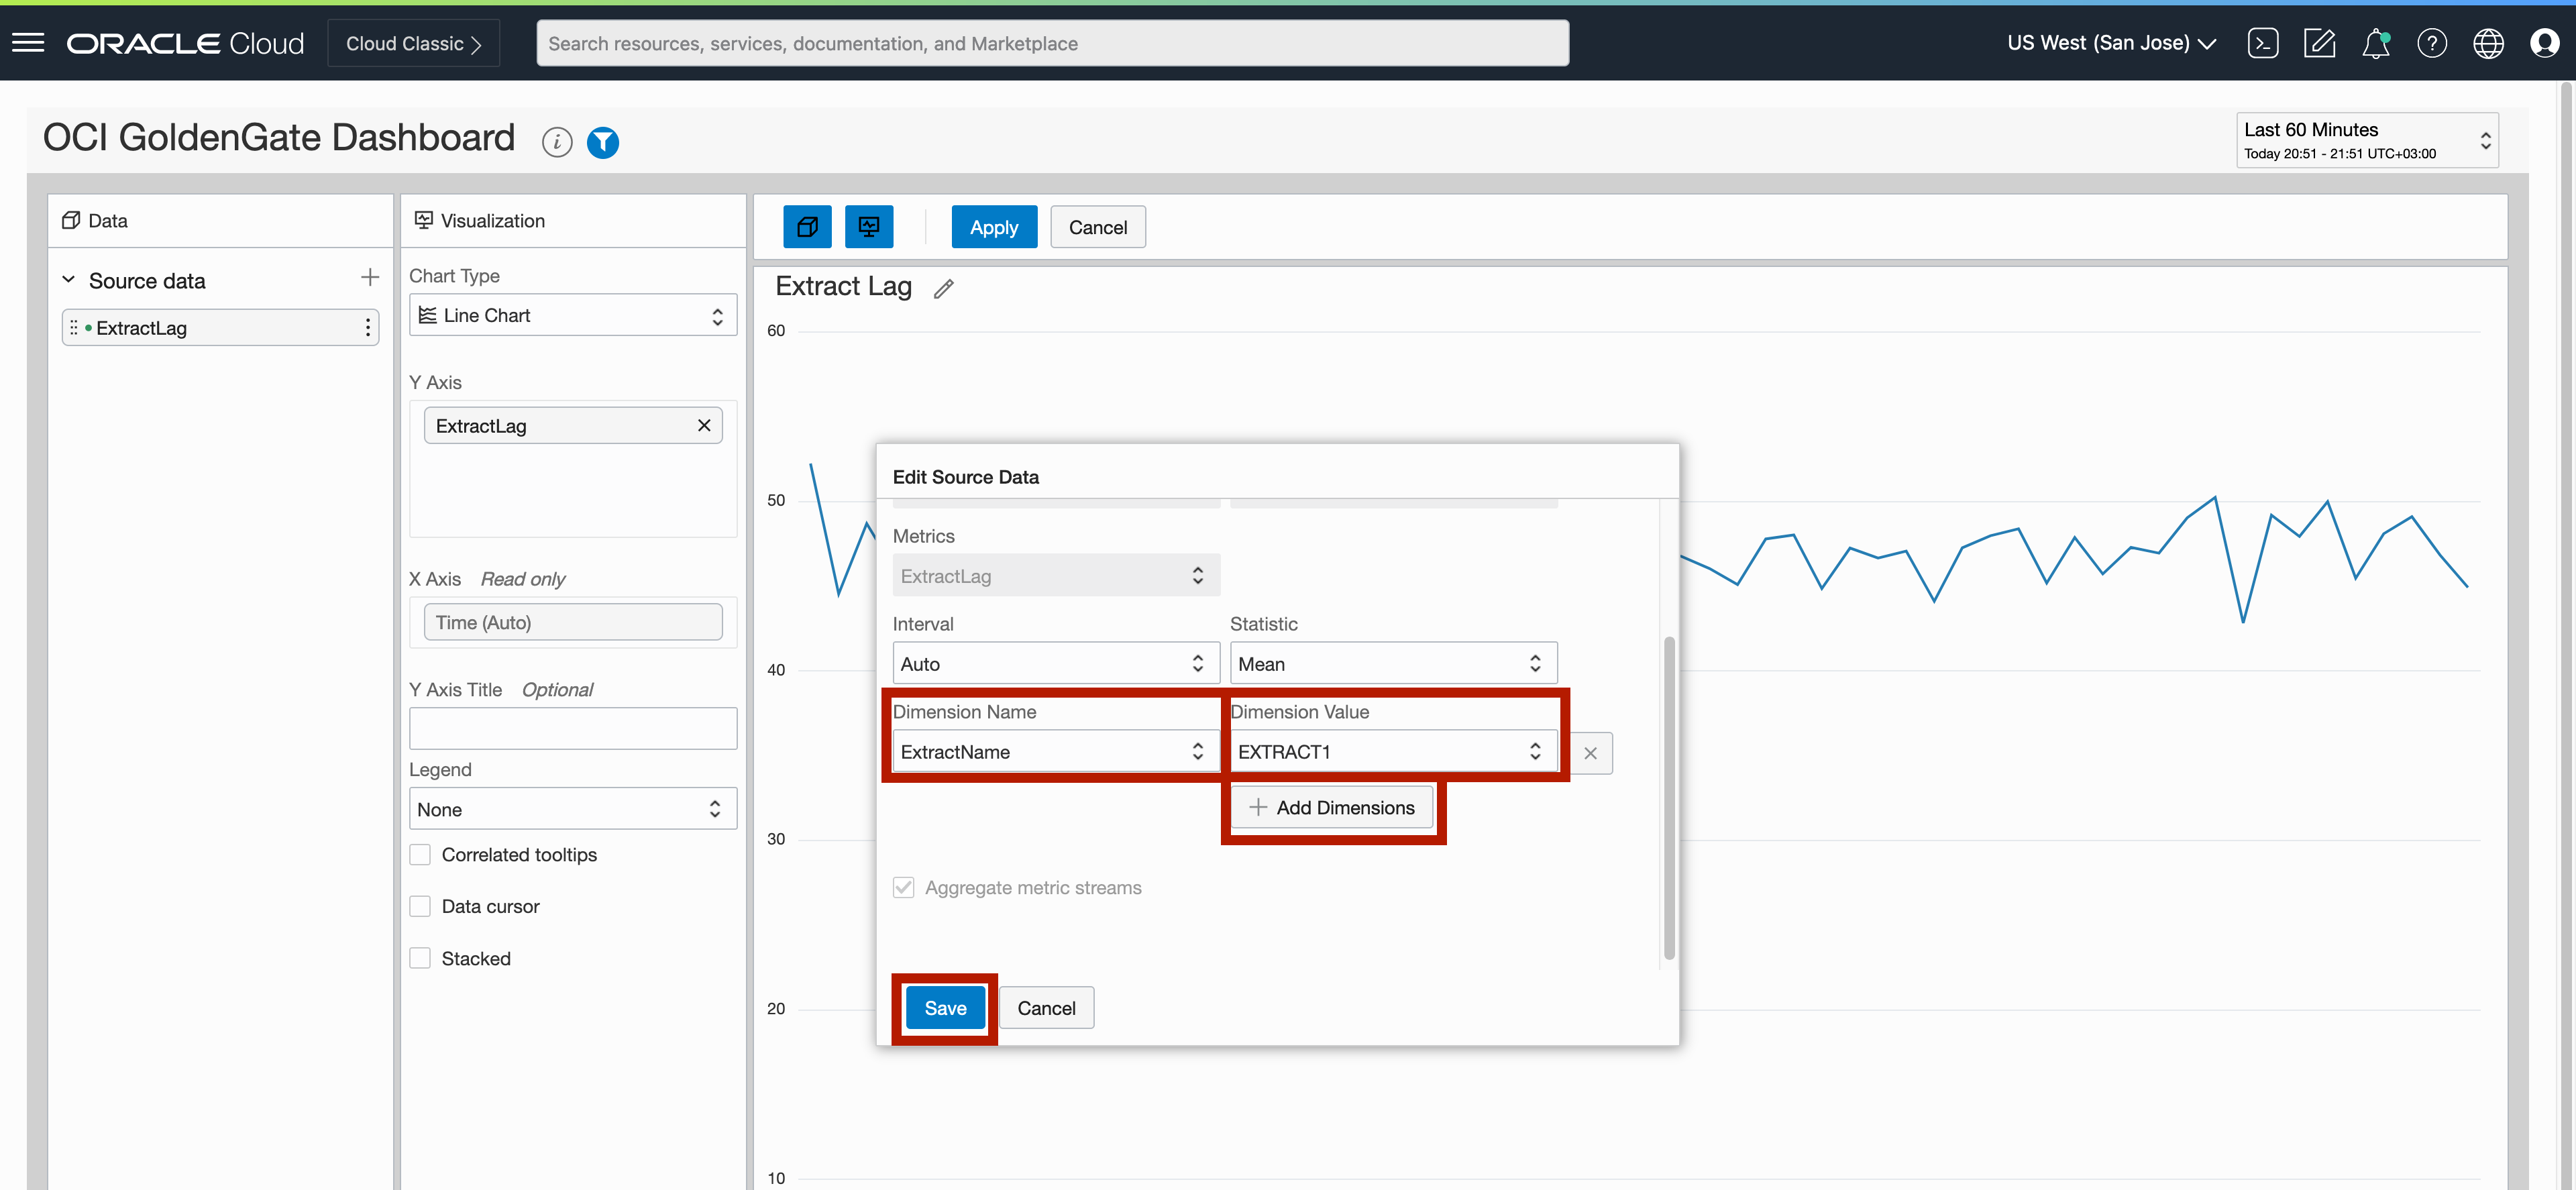
You can name your widget by clicking on the Untitled field. On Data field, you can add Data Sources to your widget. To do that, you can click on + icon. In the Add Source Data screen, you can select the Namespace as oci_goldengate. In Metrics field, you can either select a specific metric or add all the metrics by selecting All Metrics. After creating the widget, click to three dots next to your widget and click Edit. In Edit Source Data screen, you can click Add Dimensions to select the Dimension Value. You can drill down to replication related metrics by selecting Dimension Name and Dimension Value. Click Save to apply changes.
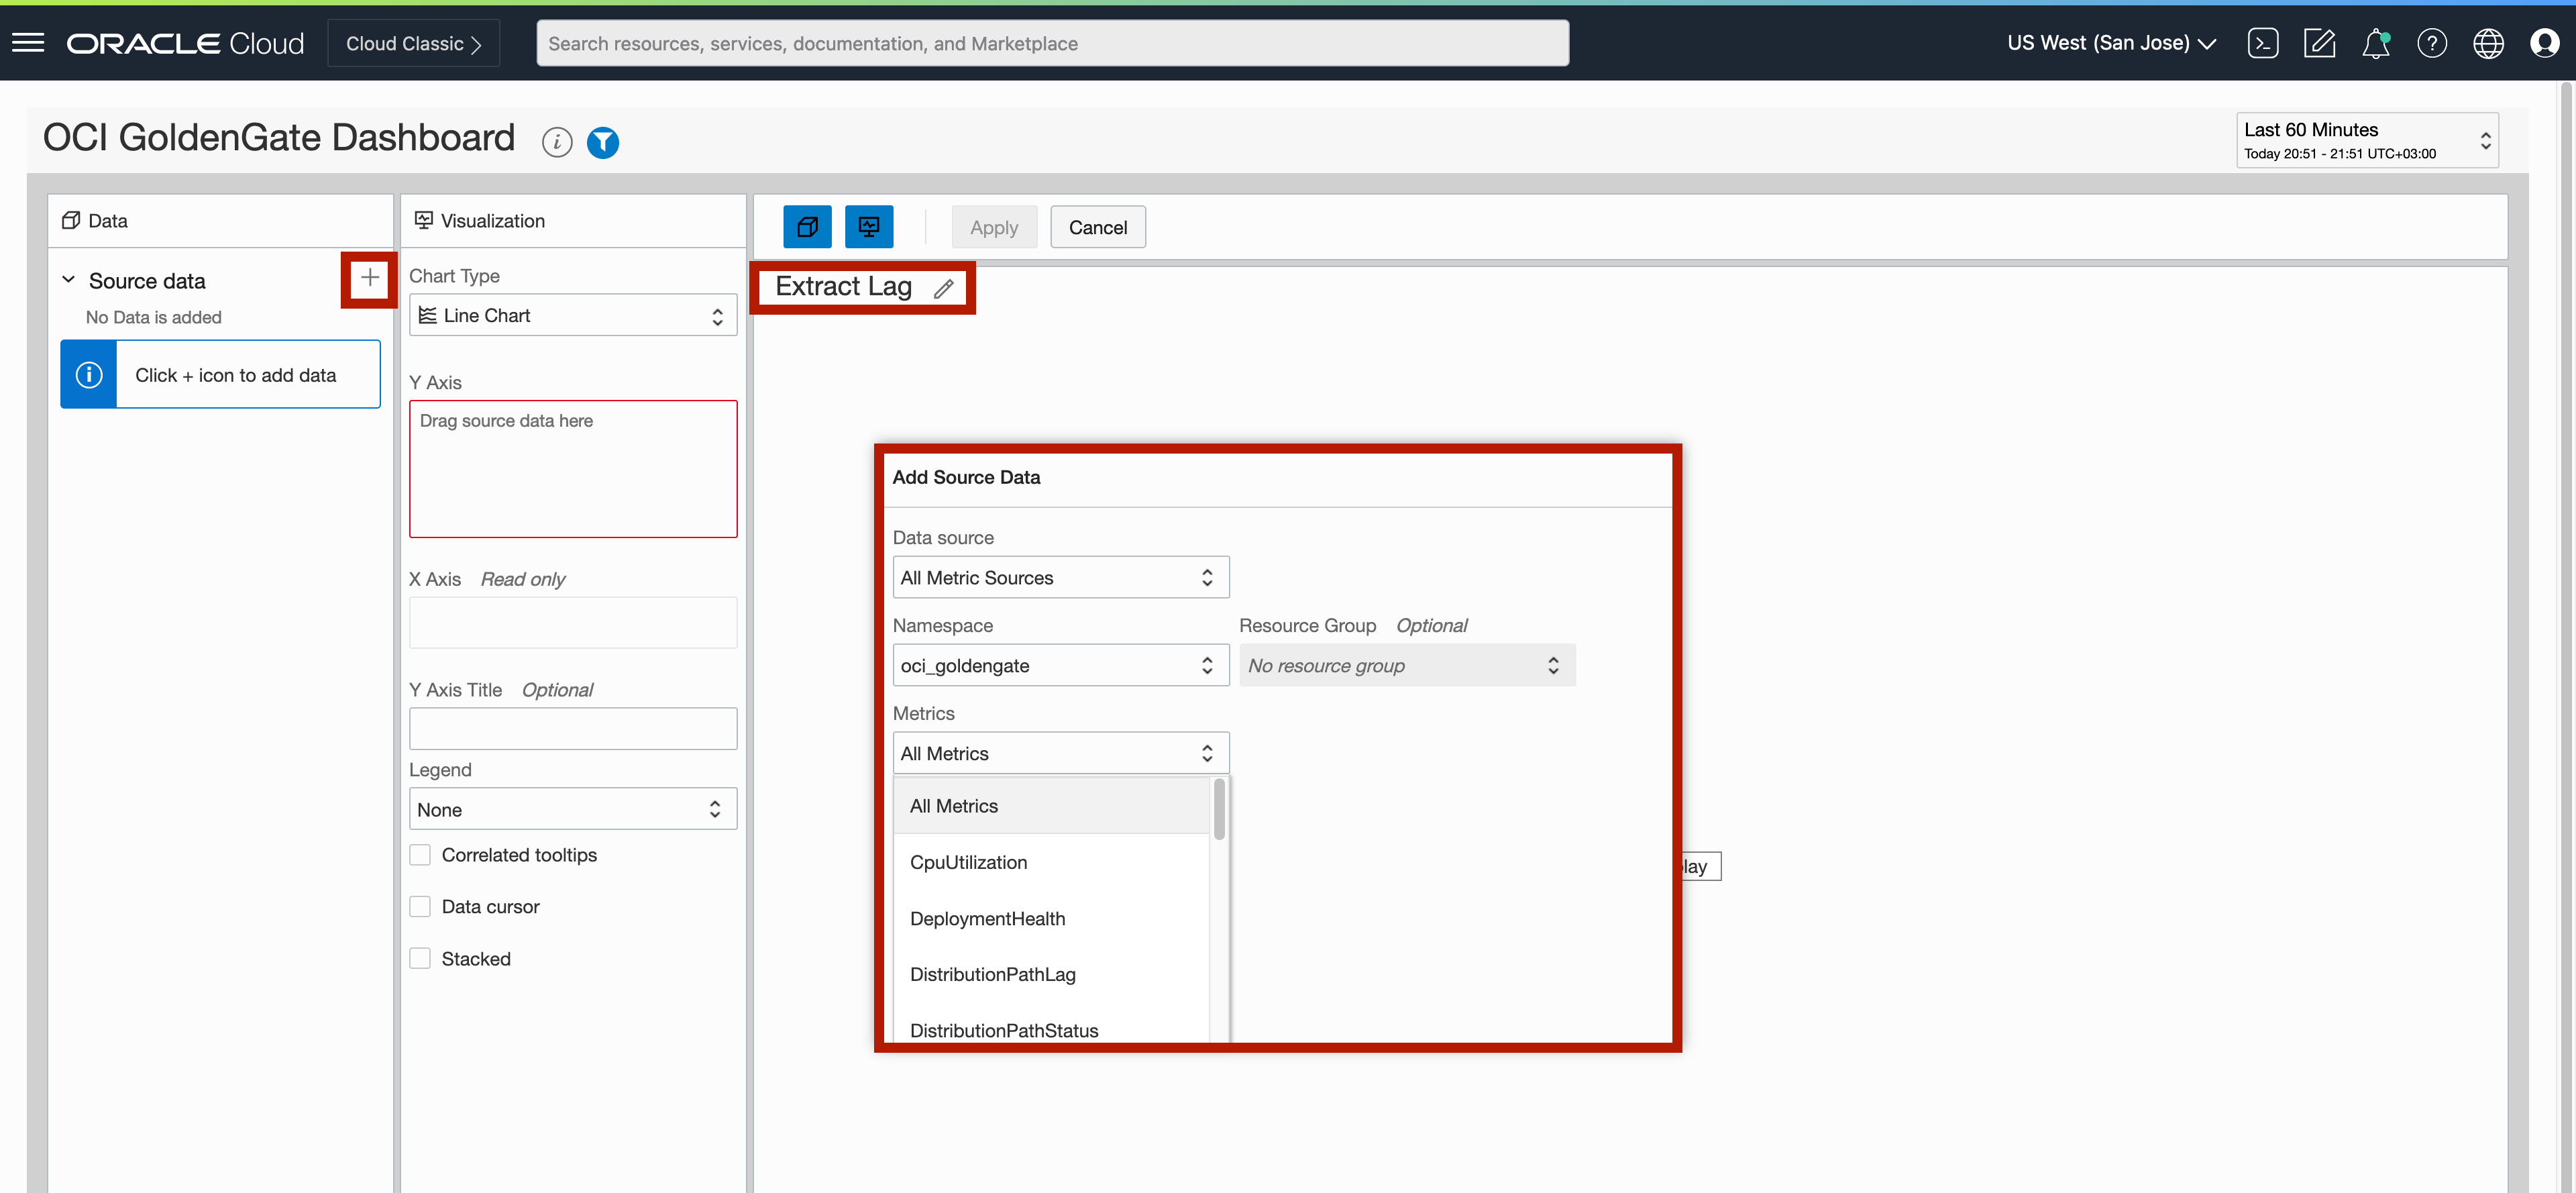
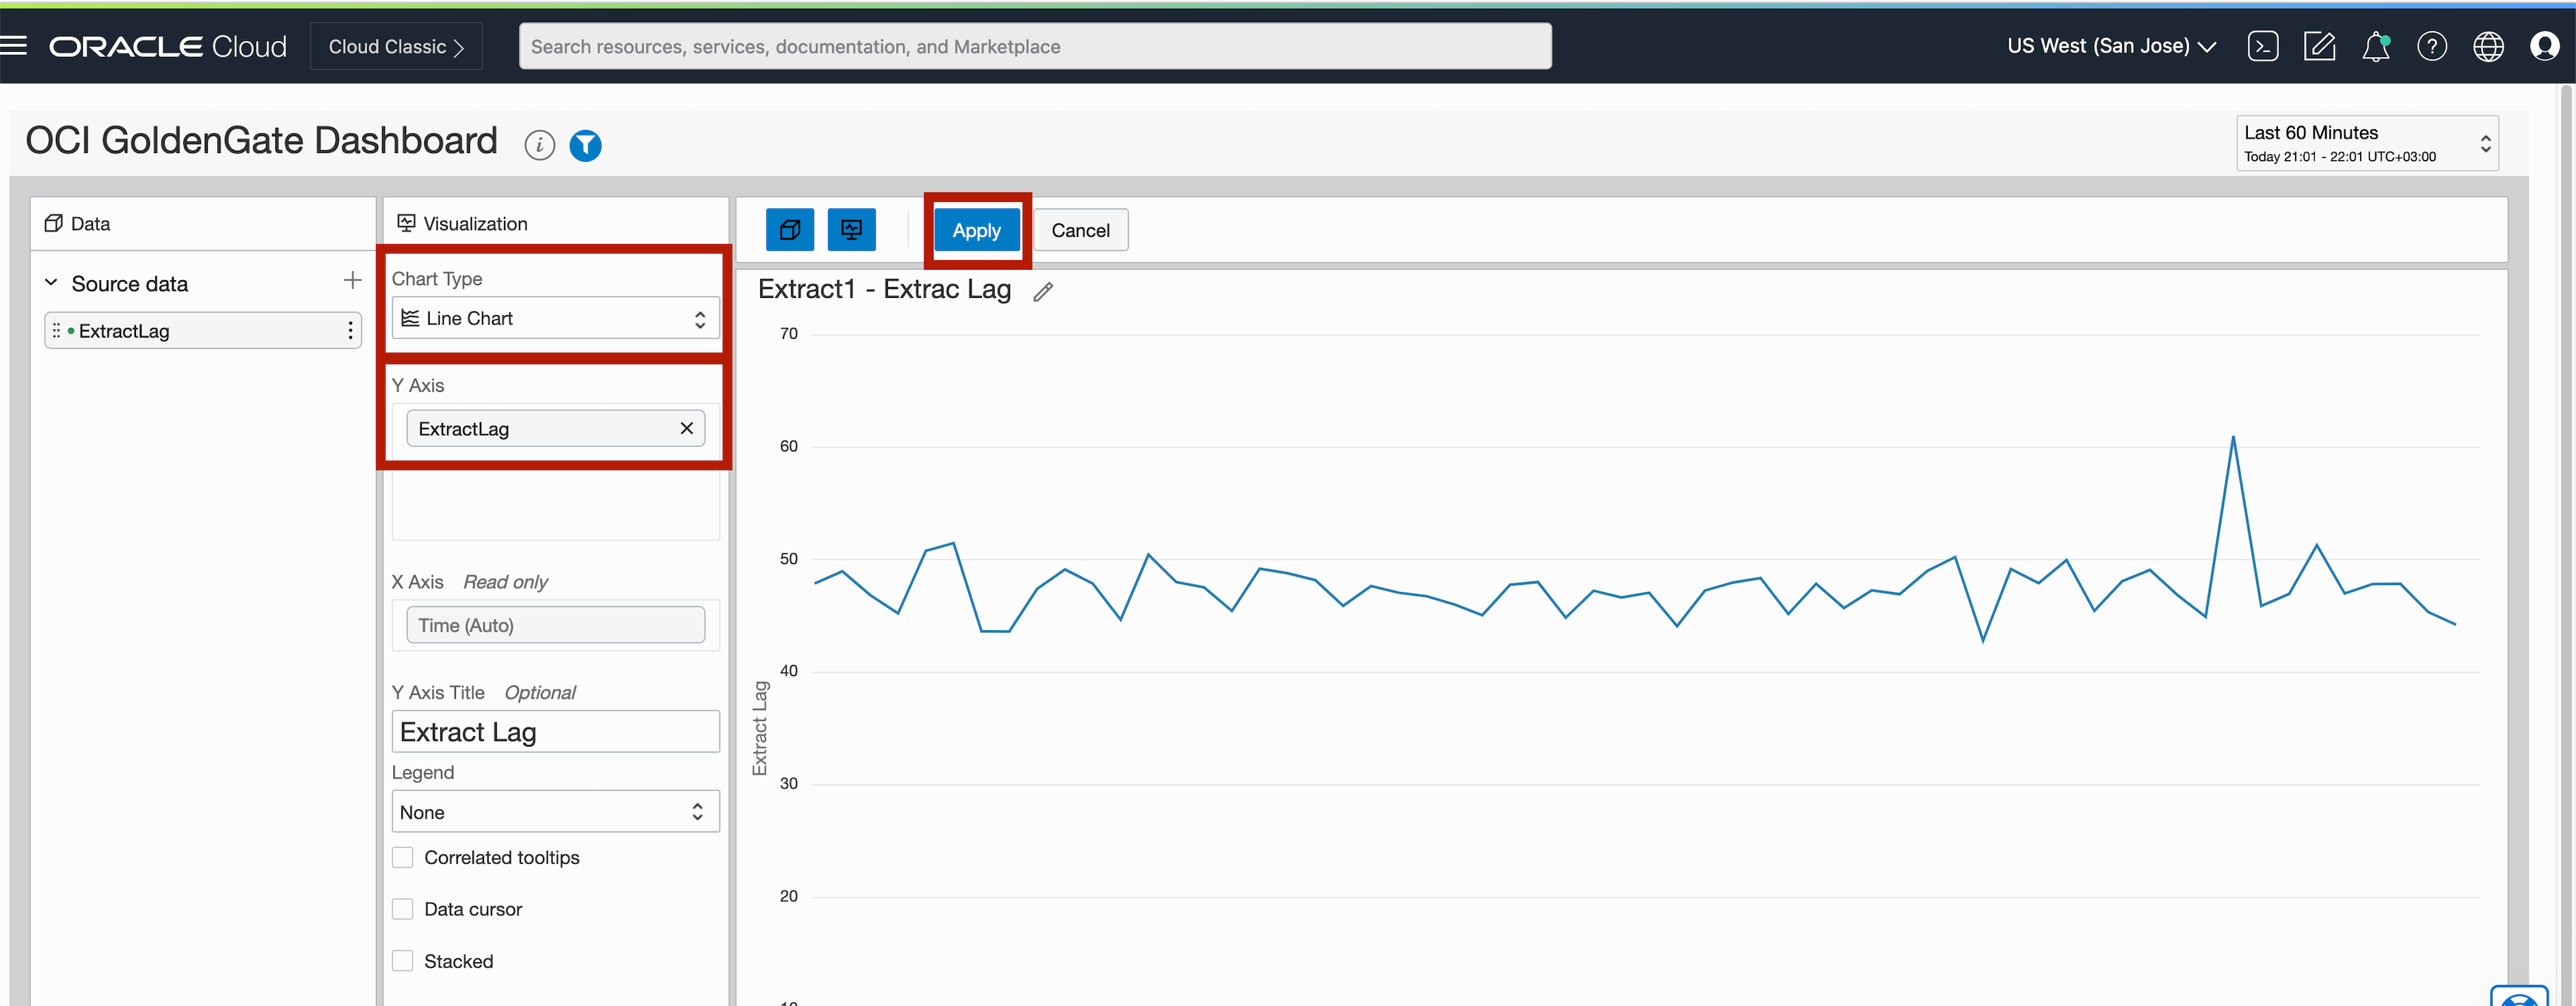
To add the source data to visual, you can drag & drop source data into Y Axis in Visualization. You’ll notice that screen is updated with the visual. If needed, you can change the Chart Type to change into bar chart or area chart. Once the visual is ready, you can click Apply and your widget will be added to dashboard.
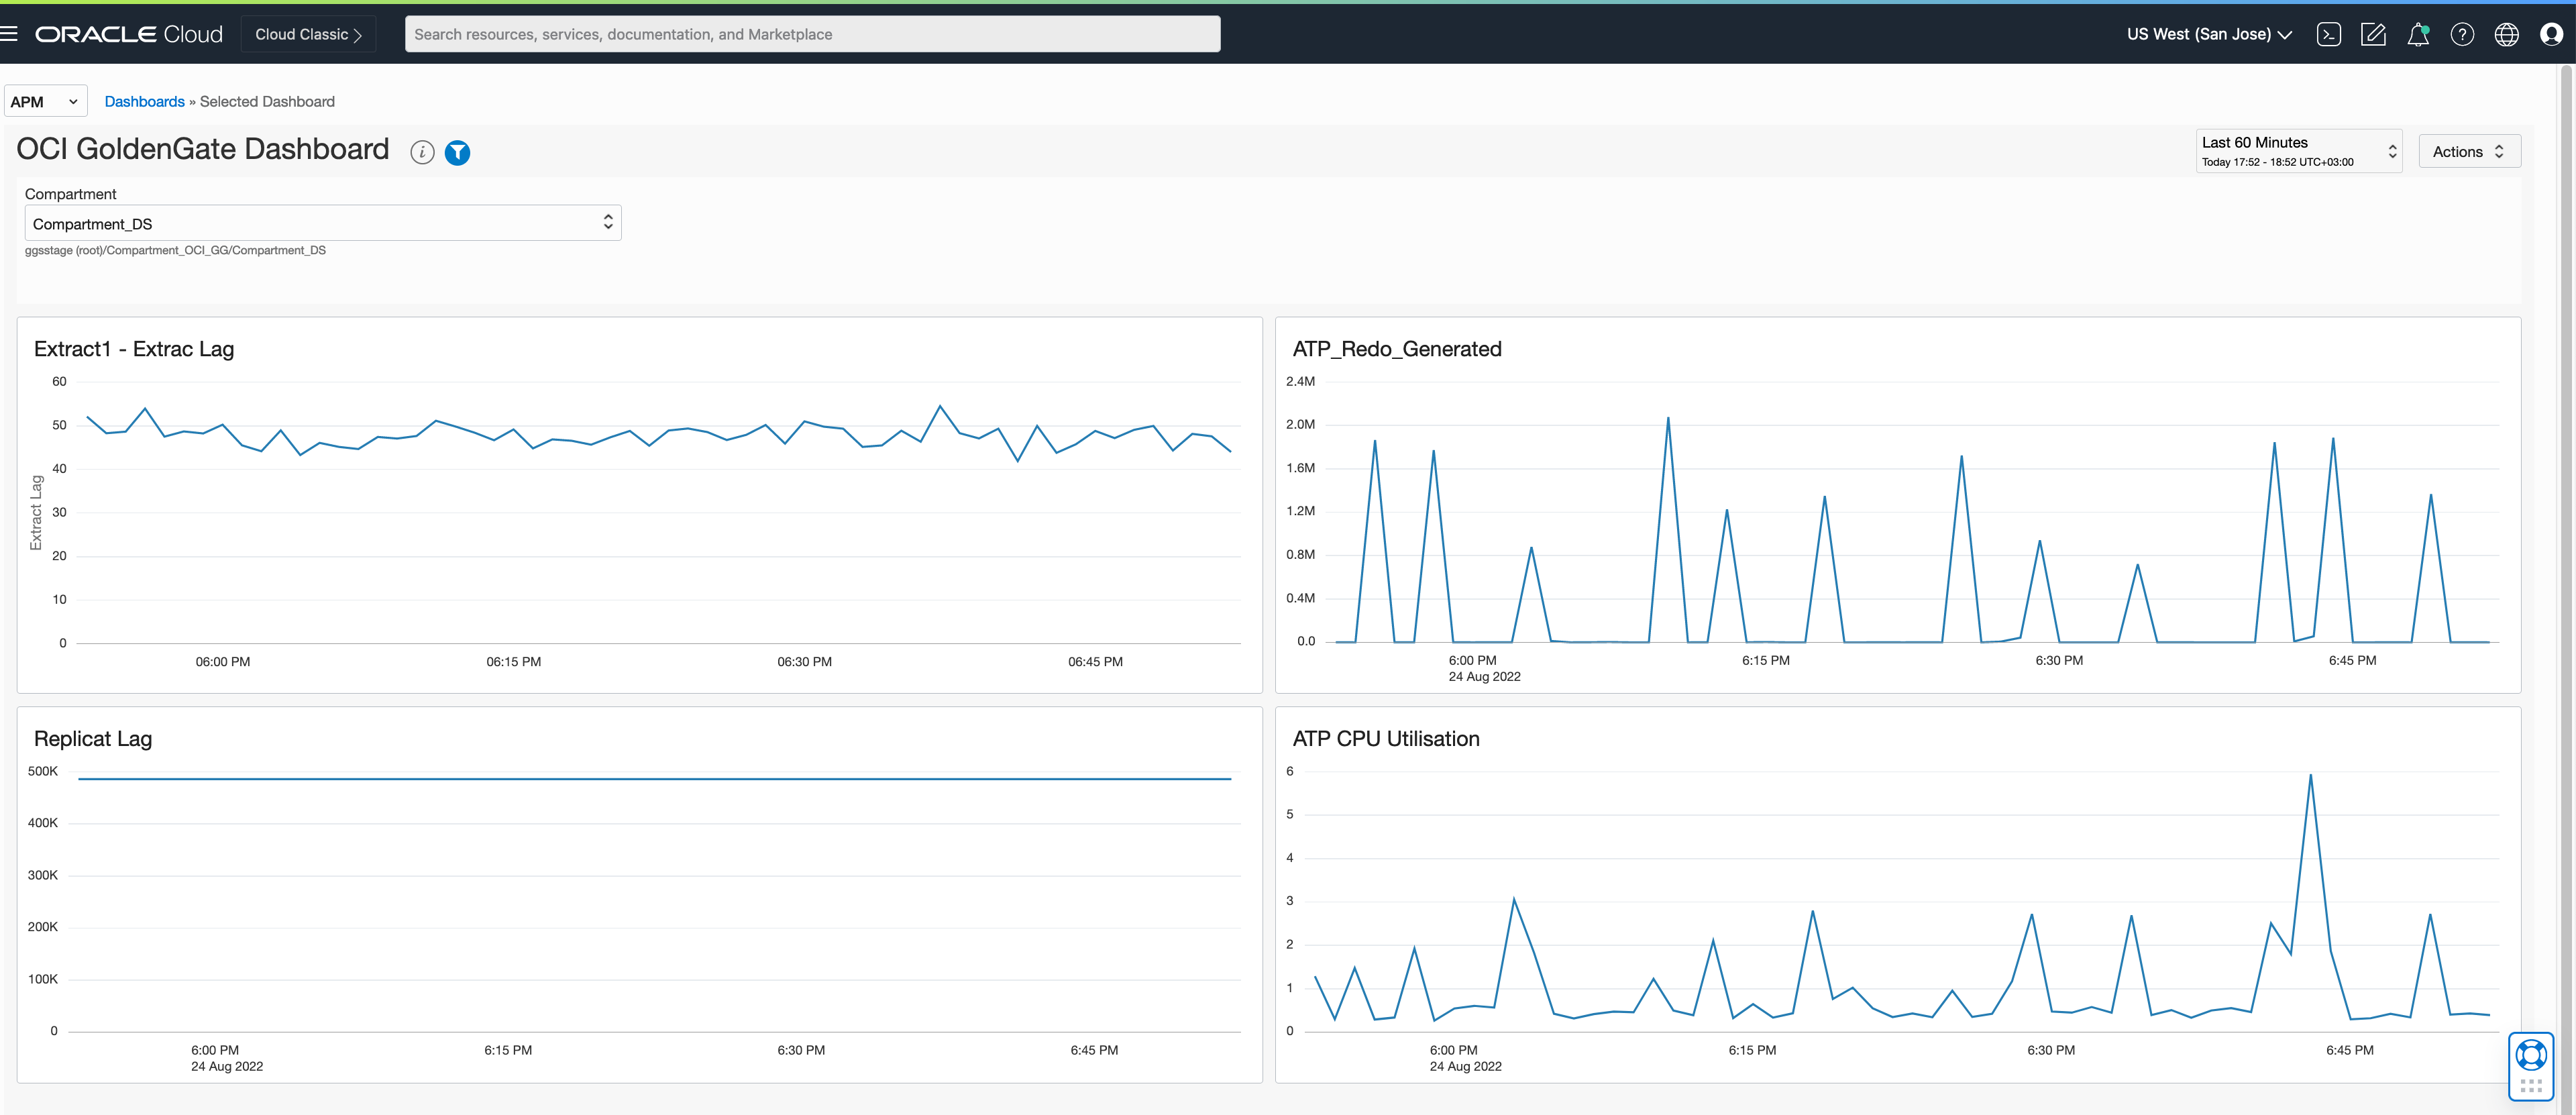
You can add up to 20 widgets into a single dashboard and these widgets can be from various OCI Services. To add more widgets, you can follow the same steps.
Learn more about the topics discussed in these posts: