Introduction
Monitoring and observability are crucial for ensuring the optimal performance and reliability of Oracle Cloud Infrastructure (OCI) GoldenGate deployments. This blog outlines best practices for leveraging various OCI tools and features to monitor and manage your GoldenGate environment effectively.
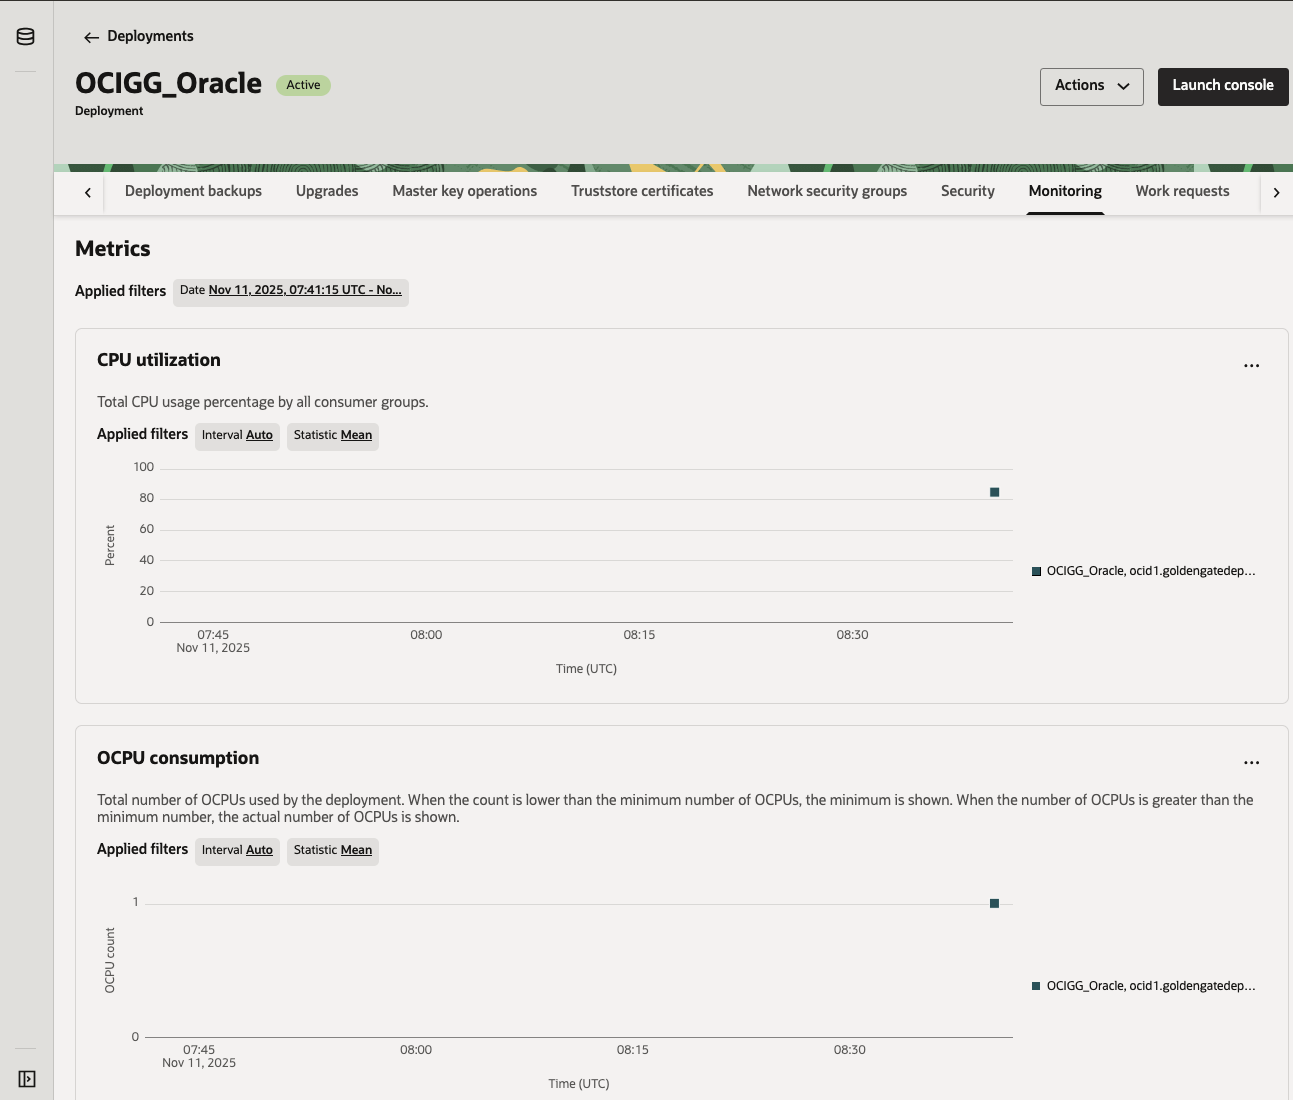
1. Use the OCI GoldenGate Deployment Console
The OCI GoldenGate Deployment Console provides real time visibility into the health and performance of your replication processes.
Within the GoldenGate Performance Metrics Service, you can:
- Monitor Process Status: Track the state of Extract, Replicat, and associated processes.
- Analyze Performance Metrics: Review lag times, throughput, and error rates.
- Review Messages and Status Changes: Examine logs to quickly identify and troubleshoot issues.
Regularly reviewing these metrics helps maintain the operational health and performance of your GoldenGate environment.
For further information check out: https://docs.oracle.com/en-us/iaas/goldengate/doc/troubleshoot-using-deployment-console.html
2. Implement Heartbeat Tables to Monitor Lag
Heartbeat tables help track the timeliness of data replication between databases. By sending periodic signals from the source to the target databases and recording their timestamps, organizations can easily monitor and measure any delays in the replication process. This allows for prompt detection and resolution of replication issues.
By configuring heartbeat tables:
- Lag Detection: Measure the time difference between source and target databases.
- Troubleshooting: Identify and address latency issues promptly.
This approach ensures data consistency and timely replication.
For further information check out: https://docs.oracle.com/en/middleware/goldengate/core/23/coredoc/monitor-monitor-lag.html#GUID-4E3D9A15-0930-4677-8CE4-503AFE6CF5CC
3. Leverage OCI Monitoring and Alarms
OCI Monitoring provides metrics and alerts for OCI GoldenGate and related resources. It helps maintain operational awareness through:
- Metrics: Observe CPU utilization, memory usage, extract and replication lag.
- Alarms and Notifications: Define conditions that trigger alerts (e.g., lag > 60 seconds).
- Event Subscriptions: Get notified when specific system events occur, such as process restarts or failures.
You can integrate alarms with OCI Notifications, enabling automated messages to email, PagerDuty, Slack, or ServiceNow.
For further information checkout: https://docs.oracle.com/en-us/iaas/Content/Monitoring/Concepts/monitoringoverview.htm
4. Integrate with Oracle Enterprise Manager (OEM) Plugin for GoldenGate
Oracle Enterprise Manager (OEM) provides a centralized platform for monitoring and managing multiple GoldenGate deployments across environments, that can be installed on-premises or managed service like OCI GoldenGate. With the OEM GoldenGate plugin, you can:
- Monitor Performance: Track key replication indicators across multiple targets.
- Receive Alerts: Configure notifications for critical thresholds or events.
- Analyze Trends: Leverage historical performance data to identify long-term patterns and optimize configurations.
This integration enhances visibility, allowing administrators to manage multiple replication systems from a single console.
For further information check out: https://docs.oracle.com/en/middleware/goldengate/emplugin/13.5.2/empug/enterprise-manager-plug-oracle-goldengate-architecture.html
5. Use OCI Logging for Enhanced Visibility
OCI Logging provides centralized access to logs from your OCI GoldenGate deployments, allowing you to:
- Aggregate Logs: Collect logs from various sources for comprehensive analysis.
- Search and Analyze: Use search capabilities to identify issues and trends.
- Set Up Alerts: Configure alerts based on specific log patterns or events.
To enable OCI Logging for OCI GoldenGate you check this link.
Integrating OCI Logging Analytics provides even deeper insights, enabling advanced queries and anomaly detection.
For further information, check out: https://docs.oracle.com/en-us/iaas/goldengate/doc/troubleshoot-using-logs.html
6. Implement Stack Monitoring for Comprehensive Observability
Stack Monitoring in OCI enables proactive monitoring of applications and their underlying stack, including GoldenGate components. With Stack Monitoring, you can:
- Discover Resources: Automatically detect and monitor GoldenGate components.
- Monitor Metrics: Collect and analyze metrics related to performance and health.
- Visualize Topology: Understand the relationships between different components in your stack.
This unified view aids in identifying and resolving issues across your entire application stack.
For further information check out: https://docs.oracle.com/en-us/iaas/stack-monitoring/doc/introduction.html
7. Troubleshooting Workflow Example
When replication lag or failure occurs:
- Check Deployment Console → Identify process health and errors.
- Review Heartbeat Tables → Confirm actual replication delay.
- AWR Reports → For Oracle Databases, review the AWR report.
- Inspect OCI Logs → Locate errors in Extract or Replicat logs.
- Analyze Metrics in OCI Monitoring → Determine system level resource bottlenecks.
Selecting the Right Monitoring Tool
| Requirement |
Recommended OCI Tool |
| Real time monitoring of GoldenGate processes |
GoldenGate Deployment Console |
| Replication lag detection |
Heartbeat Tables |
| Alerting and metric analysis |
OCI Monitoring & Alarms |
| Centralized log management |
OCI Logging / Logging Analytics |
| Centralized visibility across multiple environments |
Oracle Enterprise Manager (OEM) |
Conclusion
Integrating these OCI tools establishes a unified, proactive observability framework. Regular monitoring and automated alerting ensure high availability and replication efficiency across OCI GoldenGate environments.