Updated on 04/25/2023
More and more companies want to transform their database transactions into Streaming, and, without any changes on their legacy applications, be able to build continuous transformation pipelines that include data enrichment, filtering, alerting, API calling, and publishing data.
We all already know how easy and resilient it is to use the OCI GoldenGate for this purpose. However, the OGG default configuration does not serve every workload, especially when the transaction volume in the source database is extremely high. Today we see many of our customers’ databases generating more than 100 GB/H, 500 GB/H of redolog, and with that volume we may have delays on extraction, trailfiles transport and/or delivery.
In this article we will show you how to improve the performance of each of these steps. The simple application of the settings shown here may not completely solve the performance problem that you experience in your environment, but it will give you a direction of which screws you can tighten to reach your desired performance.
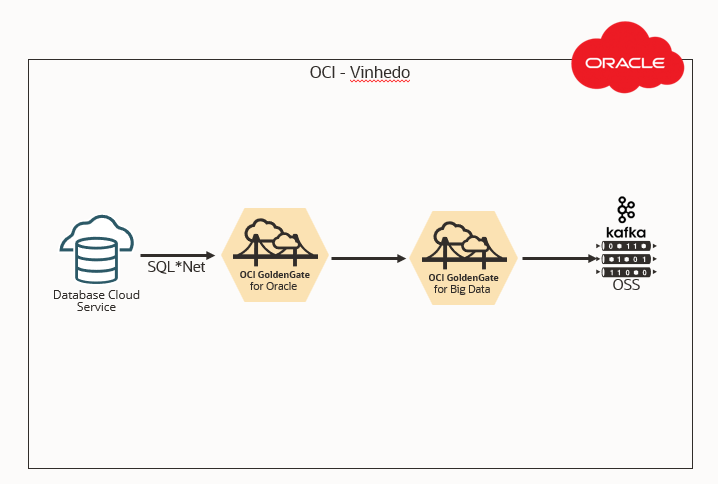
Understand our test environment:
| Source: OCI Oracle Base Database |
|
| Target: Oracle Streaming Service (OSS) |
|
| Capture: OCI Goldengate for Oracle |
|
| Delivery: OCI Goldengate for Big Data |
|
All resources in the same Regions and same Availability Domains:
It is not the purpose of this article to show how to deploy and basic configure these components (Database Service, Streaming Service, OCIGG Deployments, OCIGG Connections, Distribution or Receiver services), let’s just focus on configuring these components to get a better performance from each one of them.
The Source Database:
The integrated capture in the Oracle Database is done using LogMiner APIs, so to improve the performance of the capture, we are going to work this.
The first step will be to increase the Number of log read buffers and the buffer size for reading log files by changing the below parameters in the database:
_log_read_buffers = 64
_log_read_buffer_size = 128
Note: I got good results with these values, but if it’s not enough, you can increase it even more, for example 128 and 256 respectively.
Commands:
alter system set “_log_read_buffers”=64 scope=spfile sid=’*’;
alter system set “_log_read_buffer_size”=128 scope=both sid=’*’;
Note: It’s necessary to bounce the database to get the parameters’ values.
Second step, the default configuration of an integrated extract uses 1000 MB of Stream Pool, however we are going to use a configuration that will use 3000 MB, so let’s resize this buffer:
Calculation: 3000 * 1.25 = 3750M
Command:
alter system set streams_pool_size=3750M scope=both sid=’*’;
Note: Changing the Stream Pool may require changing other parameters, depending on your database configuration, such as sga_target parameter.
Integrated Extract:
We will use the parameter “TRANLOGOPTIONS PERFORMANCEPROFILE” with “HIGH” value to improve capture performance in the scenario where there is intensive workload on the source database, be careful when using this value in an environment that does not fit this context, as this may increase the capture latency. I recommend reading about the parameter before using it:
https://docs.oracle.com/en/middleware/goldengate/core/21.3/reference/tranlogoptions.html
How was our test Extract:
EXTRACT EMYAPP1
USERIDALIAS db19c DOMAIN OracleGoldenGate
TRANLOGOPTIONS SOURCE_OS_TIMEZONE GMT-03:00
TRANLOGOPTIONS PERFORMANCEPROFILE HIGH
EXTTRAIL myapp1/TF
ddl include mapped
SOURCECATALOG PDB1
table myapp1.*;
The parameter “TRANLOGOPTIONS PERFORMANCEPROFILE HIGH” defines MAX_SGA_SIZE on 3000M and PARALLELISM on 3. You can explicitly set the value of these parameters (of course you will have to resize the Stream Pool Size if you do this), Ex:
TRANLOGOPTIONS INTEGRATEDPARAMS (MAX_SGA_SIZE 8000, PARALLELISM 8)
TRANLOGOPTIONS PERFORMANCEPROFILE HIGH
Note: Unfortunately, this configuration above is not so effective on older database versions such as 11.2.0.4 or 12. This is because Log Miner has been evolving a lot, version by version of the Oracle Database.
Distribution Service:
In our test scenario, GoldenGate for Oracle and GoldenGate for Big Data are in the same Region, same AD and same Subnet, so we didn’t have any contention in sending the trailfiles between the GoldenGates, however if you have a data link between your GoldenGates, with high latency or limited throughput, here are some points you can adjust in your Path:
- “Enable Network Compression” – Ideal for limited throughput
- “TCP Flush Bytes:”, “Send Buffer Size” e “Receive Buffer Size” – If your latency is high
Of course, you can combine these parameters, as well as the other performance parameters described in the documentation:
It is very important that you test a lot your Path’s performance when using these parameters.
Oracle Stream Service:
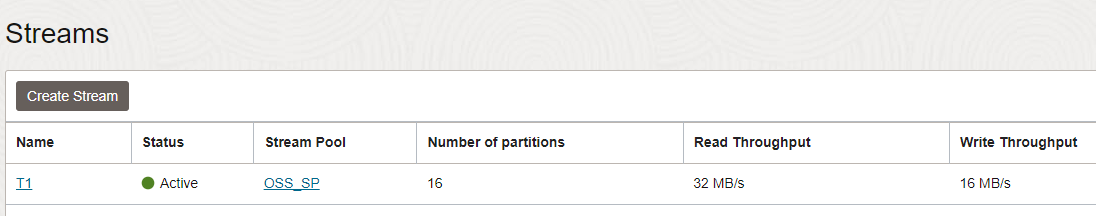
Oracle Stream Service is a real-time, serverless, Apache Kafka-compatible event streaming platform for developers and data scientists. Its use and configuration are very simple, to achieve the desired performance in this test, I simply set the default partition number on the Stream Pool, as you can see below:
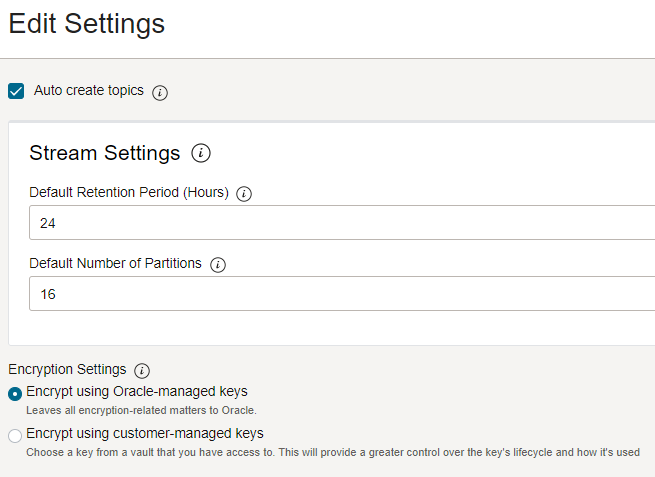
Each partition gives you 2MB/s for reading and 1MB/s for writing. Calculate how many you need to define the number of partitions.
Remember that you need to adjust your tenancy and/or compartment limit to use this resource:
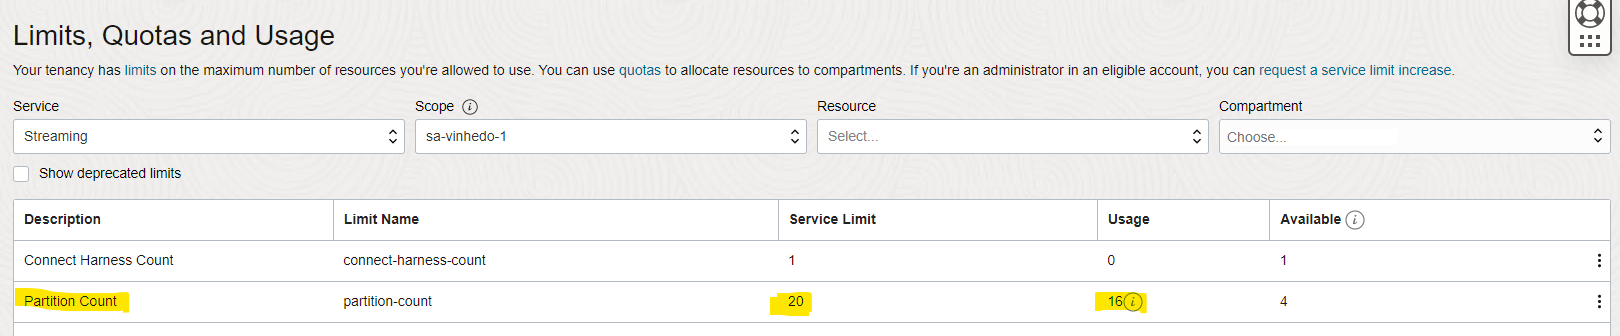
The sum of the partitions of each Stream counts towards the limit, so if you are going to replicate 3 tables and configure 16 partitions per Stream, you will need at least 48 “Partition count” of limit.
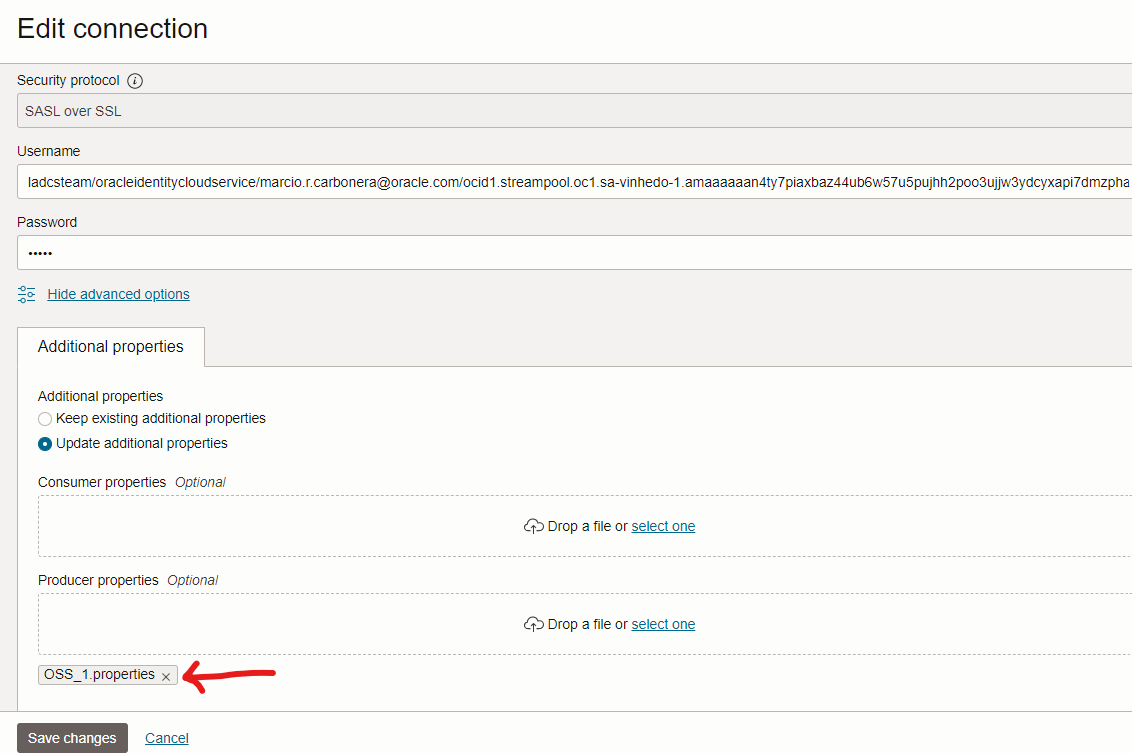
OCI Streaming Connection
To improve the performance of message delivery in OCI Streaming, we have changed some Kafka parameters in connection properties with this service.
Kafka properties:
batch.size=102400
linger.ms=10000
acks=1
reconnect.backoff.ms=5000
compression.type=gzip
retries=10
To upload these configurations in the OCIGG connection with OCI Streaming, place them in a text file and upload it in the OCI console, as below:
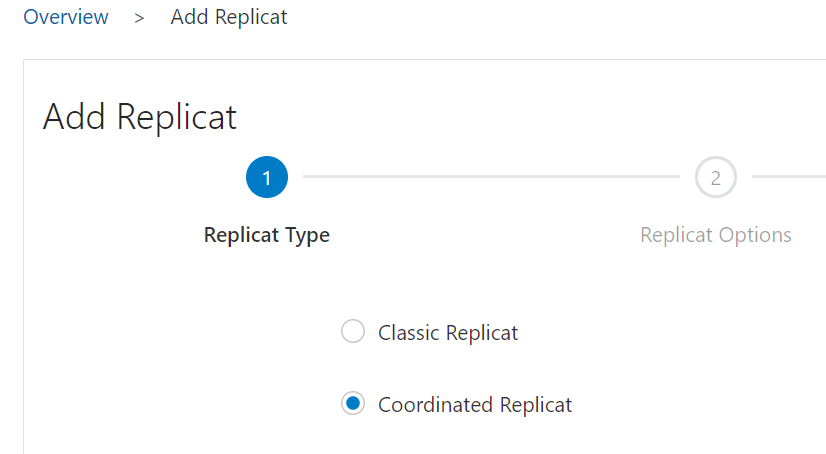
Coordinated Replicat:
For the Apply, the OCI Goldengate for Big Data makes available two types of Replicat: Classic and Coordinated. If the data volume you are replicating is not very high, then most likely the Classic Replicat will attend to you. But if it doesn’t, you can use the Coordinated Replicat to deliver with a lot of performance.
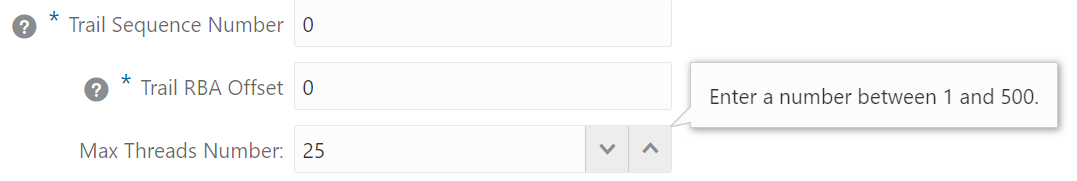
The Coordinated Replicat setup is a bit more complex than the Classic one, but it’s also easy. You will only need to define the number of threads.
Basically, the Coordinated Replicat will create several threads (as many as you define) and distribute the Apply across these threads.
Choose the Coordinated Replicat when adding the Replicat:
Set the Maximum Threads that the Replicat will support, maximum 500:
Parameter of the Coordinated Replicat:
REPLICAT RCOOR
TARGETDB LIBFILE libggjava.so SET property=/u02/Deployment/etc/conf/ogg/RCOOR.properties
SOURCECATALOG PDB1
MAP myapp1.*, TARGET myapp1.*, THREADRANGE(1-16);
In the case of the Coordinated Replicat, it is necessary to say where the properties file is (in order to have the same file used by all threads) and the number of threads. We configured 16 threads in our test and achieved the expected performance.
Properties of Replicat:
# Properties file for Replicat RCOOR
# OSS Handler Template
gg.handlerlist=oss
gg.handler.oss.type=kafka
gg.handler.oss.connectionId=ocid1.goldengateconnection.oc1.sa-vinhedo-1.amaaaaaan4ty7piajuefmrbcwvsvois6a7ljhhipxcmunuxlnacx35g7xc4a
#TODO: Set the template for resolving the topic name.
gg.handler.oss.topicMappingTemplate=${tableName}
gg.handler.oss.keyMappingTemplate=${primaryKeys}
gg.handler.oss.mode=op
gg.handler.oss.format=json
gg.handler.oss.format.metaColumnsTemplate=${objectname[table]},${optype[op_type]},${timestamp[op_ts]},${currenttimestamp[current_ts]},${position[pos]}
gg.classpath=$THIRD_PARTY_DIR/kafka/*
jvm.bootoptions=-Xmx512m -Xms32m
For more details on the Coordinated Replicat configuration and administration, please consult our documentation:
https://docs.oracle.com/en/middleware/goldengate/core/21.3/gclir/add-replicat.html
Running the test:
Using the settings described above, we performed a simple workload generation test on the source database to measure the data ingestion throughput in OSS/Kafka.
Records insertion in the source table:
alter session set container=”PDB1″;
create table myapp1.t1 (a number, b varchar2(500), PRIMARY KEY (a));
SET SERVEROUTPUT ON
set timing on
DECLARE i NUMBER(10) := 1;
text varchar2(100) := ‘AAAAAAAAAAAAAAAAAAAAAAAAAAAAAAAAAAAAAAAAAAAAAAAAAAAAAAAAAAAAAAAAAAAAAAAAAAAAAAAAAAAAAAAAAAAAAAAAAAAA’;
BEGIN
WHILE i <= 20000000 LOOP
INSERT INTO myapp1.t1 VALUES (i, text || text || text || text);
IF MOD(i, 100) = 0 THEN
COMMIT;
END IF;
i := i + 1;
END LOOP;
END;
/
We left the Extract and the Replicat stopped for a few minutes to accumulate transactions and thus measure the real throughput of these two components.
Results achieved:
In the Extract, the result achieved with the configuration and infrastructure used in test was beyond expectations:
OGG (https://10.11.1.205 OCIGGDB) 49> stats extract EMYAPP1 REPORTRATE sec , total
Sending STATS REPORTRATE sec total request to Extract group EMYAPP1 …
Start of statistics at 2023-02-10 20:34:31.
DDL replication statistics (for all trails):
*** Total statistics since extract started ***
Operations 1.00
Mapped operations 1.00
Unmapped operations 0.00
Other operations 0.00
Excluded operations 0.00
Output to myapp1/TF:
Extracting from PDB1.MYAPP1.T1 to PDB1.MYAPP1.T1:
*** Total statistics since 2023-02-10 20:33:43 ***
Total inserts/second 138355.40
Total updates/second 0.00
Total deletes/second 0.00
Total upserts/second 0.00
Total discards/second 0.00
Total operations/second 138355.40
End of statistics.
138k records of 400 bytes per second seemed quite satisfactory to me, and the consumption of the OCIGG for Oracle service, as seen below, was low:
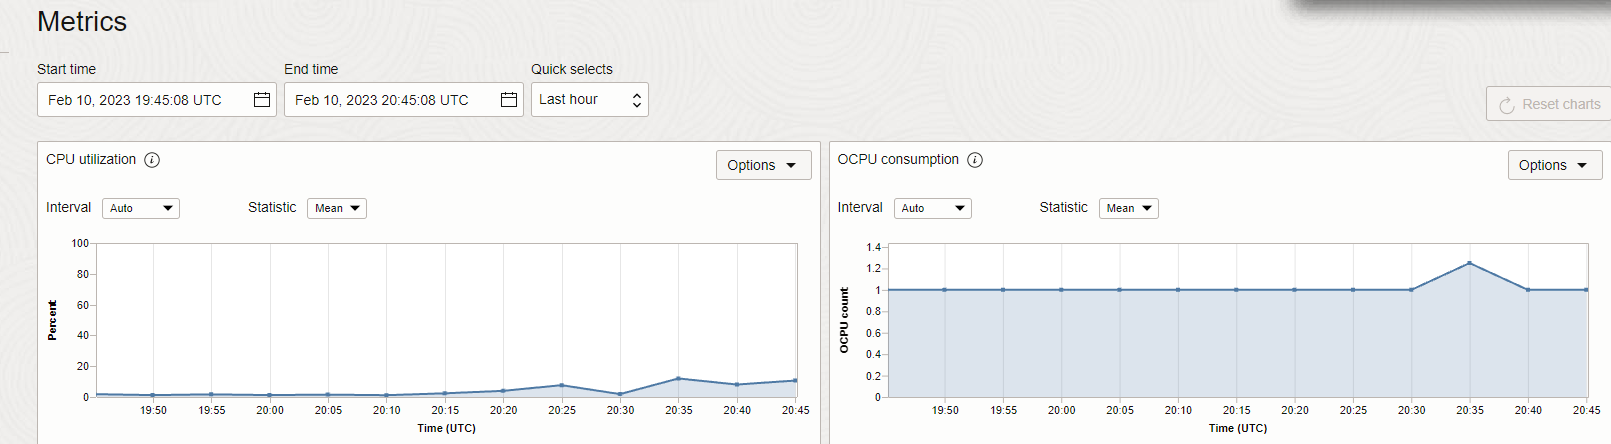
Which makes a lot of sense, since all the capture is done inside the database (Log Miner), the OGG for Oracle service just receives the captured records and sends them to the OGG for Big Data.
The delivery for OSS, that is, Replicat, although the performance was a little lower than Extract, also surpassed our goal in this test, as we can see:
OGG (https://10.11.1.165 OCIGG4BD as BigData@) 129> stats replicat RCOOR REPORTRATE sec , total
Sending STATS REPORTRATE sec total request to Replicat group RCOOR …
Coordinated Replicat statistics:
Thread Lag Gap: 00:00:00
Average Coordination Time: 00:00:54
*** Total statistics since 2023-04-24 14:48:35 ***
Coordinated Total DDLs/second 0.01
Coordinated Total PK-update transactions/second 0.00
Coordinated Total EMI transactions/second 0.00
Total transactions with user-requested coordination/second 0.00
Total transactions with source metadata changes/second 0.01
Start of statistics at 2023-04-24 14:55:12.
DDL replication statistics:
*** Total statistics since replicat started ***
Operations 2.00
Mapped operations 2.00
Unmapped operations 0.00
Other operations 0.00
Excluded operations 0.00
Errors 0.00
Retried errors 0.00
Discarded errors 0.00
Ignored errors 0.00
Replicating from PDB1.MYAPP1.T1 to myapp1.T1:
*** Total statistics since 2023-04-24 14:48:35 ***
Total inserts/second 103586.03
Total updates/second 0.00
Total deletes/second 0.00
Total upserts/second 0.00
Total discards/second 0.00
Total operations/second 103586.03
End of statistics.
100k records of 400 bytes per second is a value that would meet the majority of real use cases that I have seen in our customers, and as expected, the CPU consumption of OCI Goldengate for Big Data was higher than that of Oracle, because coordinated replicat opens several threads to do the work (16 in our case).
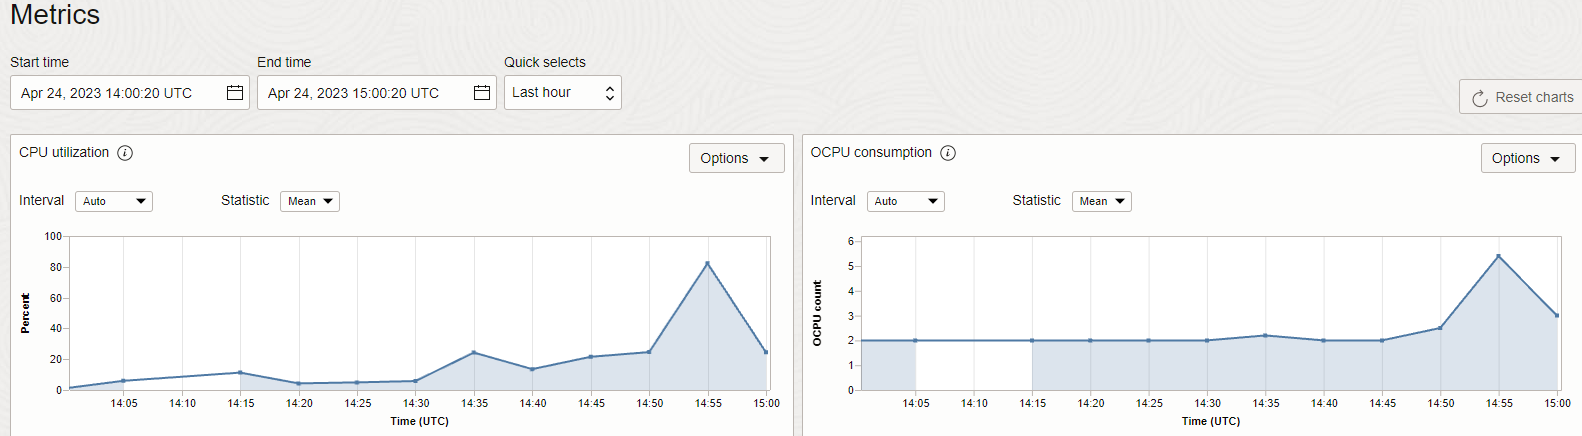
This service is configured with 2 OCPUs and Auto Scaling allowing it to reach 6, during testing it reached 5 OCPUs.
Remembering that to improve this delivery performance there is not much secret, I would first increase the number of Stream partitions as well as the Replicat threads.
Of course, this test was very simple, being a single table with only two columns certainly contributed to these very expressive numbers. In cases of real uses, with a much larger number of tables and columns, it will probably be necessary to have more resources and be more aggressive in the configurations to reach values close to these.