OCI GoldenGate is a fully managed service providing a real-time data mesh platform, which uses replication to keep data highly available and enable real-time analysis. The OCI GoldenGate team recently introduced a new feature that allows users to explore GoldenGate logs using the OCI Logging service.
By integrating OCI Logging with OCI GoldenGate, you gain the ability to enable, manage, and search GoldenGate process and error logs. It’s important to note that this integration with the Logging service is optional.
- Error logs: These logs contain content from the ggserr.log file, which captures processing events, messages, errors, and warnings generated by GoldenGate.
- Process logs: These logs contain content from various log files related to the Administration Service, Distribution Service, Performance Metrics Service, Receiver Service, and Extract/Replicat Events.
Enabling OCI GoldenGate Logs
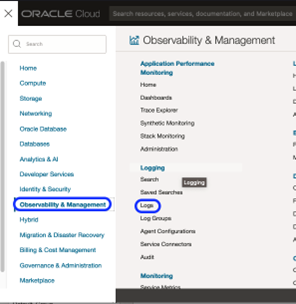
To enable GoldenGate logs, access the GoldenGate deployment details and click on ‘Logs’:
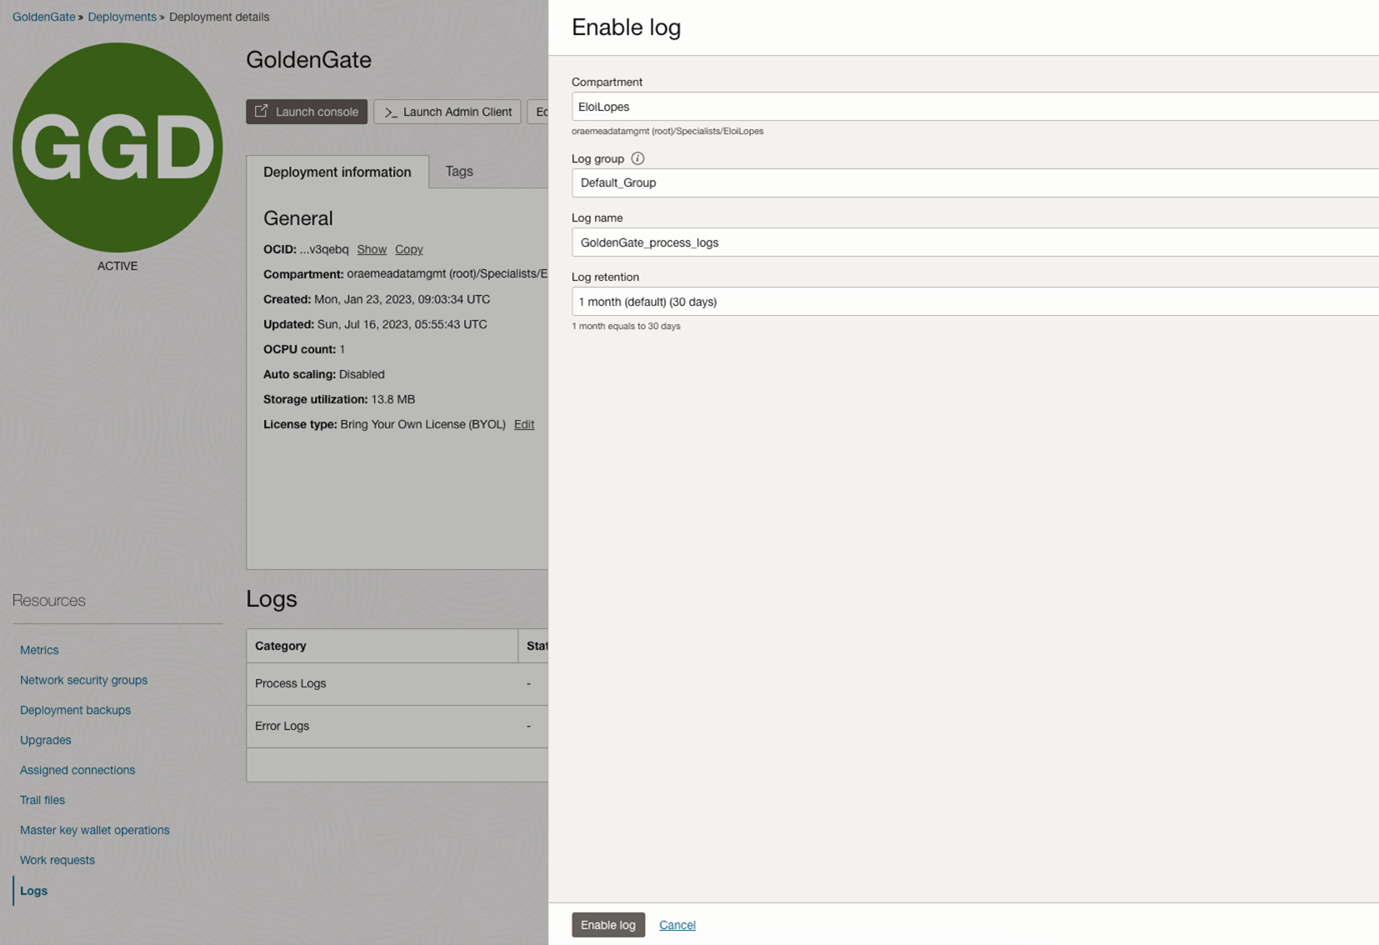
On the Enable log window, you need to specify a Log Group that will be the logical container for your logs. In case you don’t have one created, please follow the steps described in this link.
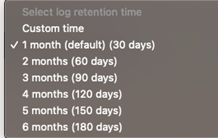
The Log retention can vary from 1 to 6 months:
You can enable Process Logs and Error Logs. After a few seconds, the logs will be enabled:
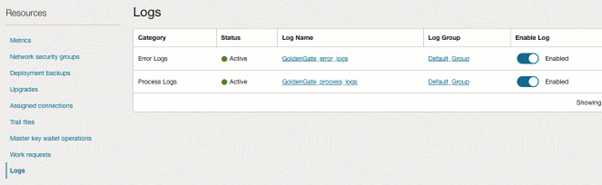
Clicking on the Log Name will automatically redirect you to the Logs page:
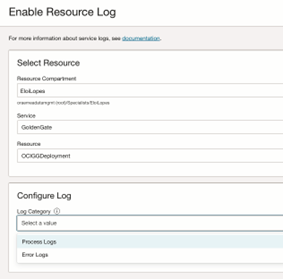
OCI GoldenGate logs can also be enabled from the OCI Logging service.
Click on “Enable Service Log” and choose the GoldenGate service along with the specific GoldenGate deployment (Resource) for which you want to enable logs:
Filtering Logs
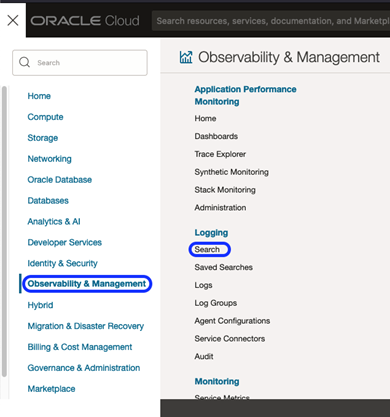
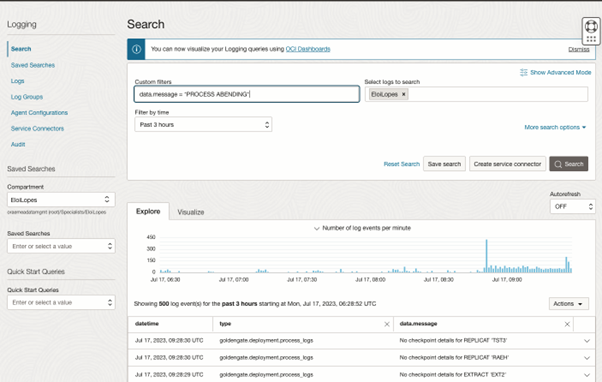
To filter logs by error messages, utilize the search option available in OCI Logging:
You can filter messages per GoldenGate service, such as Administration, Distribution, Performance Metrics, and Receiver Service. To achieve this, use the “processName” property for filtering:
- adminsrvr – Administration Service
- distsrvr – Distribution Service
- pmsrvr – Performance Metrics Service
- recvsrvr – Receiver Service
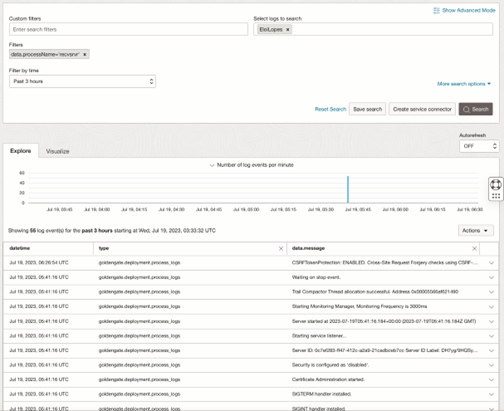
You can use the “Show Advanced Mode” and write your own queries:
search “ocid1.compartment.oc1..<compartmentid>” | data.processName=’recvsrvr’ | sort by datetime desc
search “ocid1.compartment.oc1..<compartmentid>” | data.processName=’adminsrvr’ | sort by datetime desc
search “ocid1.compartment.oc1..<compartmentid>” | data.processName=’pmsrvr’ | sort by datetime desc
search “ocid1.compartment.oc1..<compartmentid>” | data.processName=’distsrvr’ | sort by datetime desc
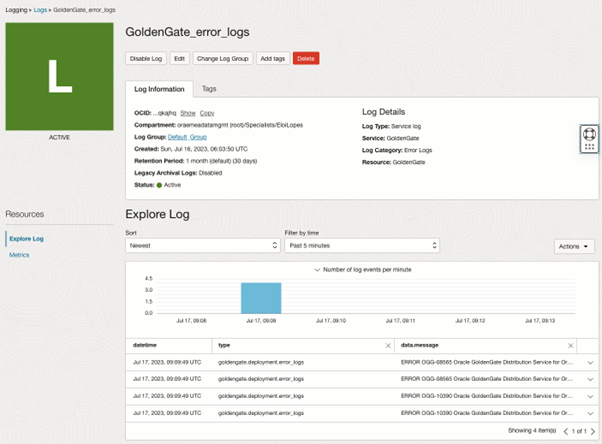
Custom filters can be created using specific keywords found in the GoldenGate error logs:
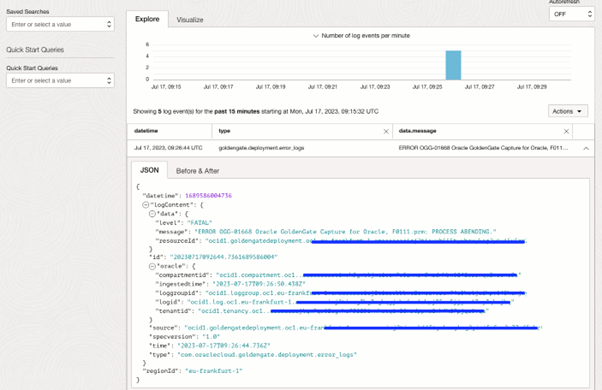
Once the results are retrieved, you can expand the data message and view the error details:
Creating Alarms based on Logs
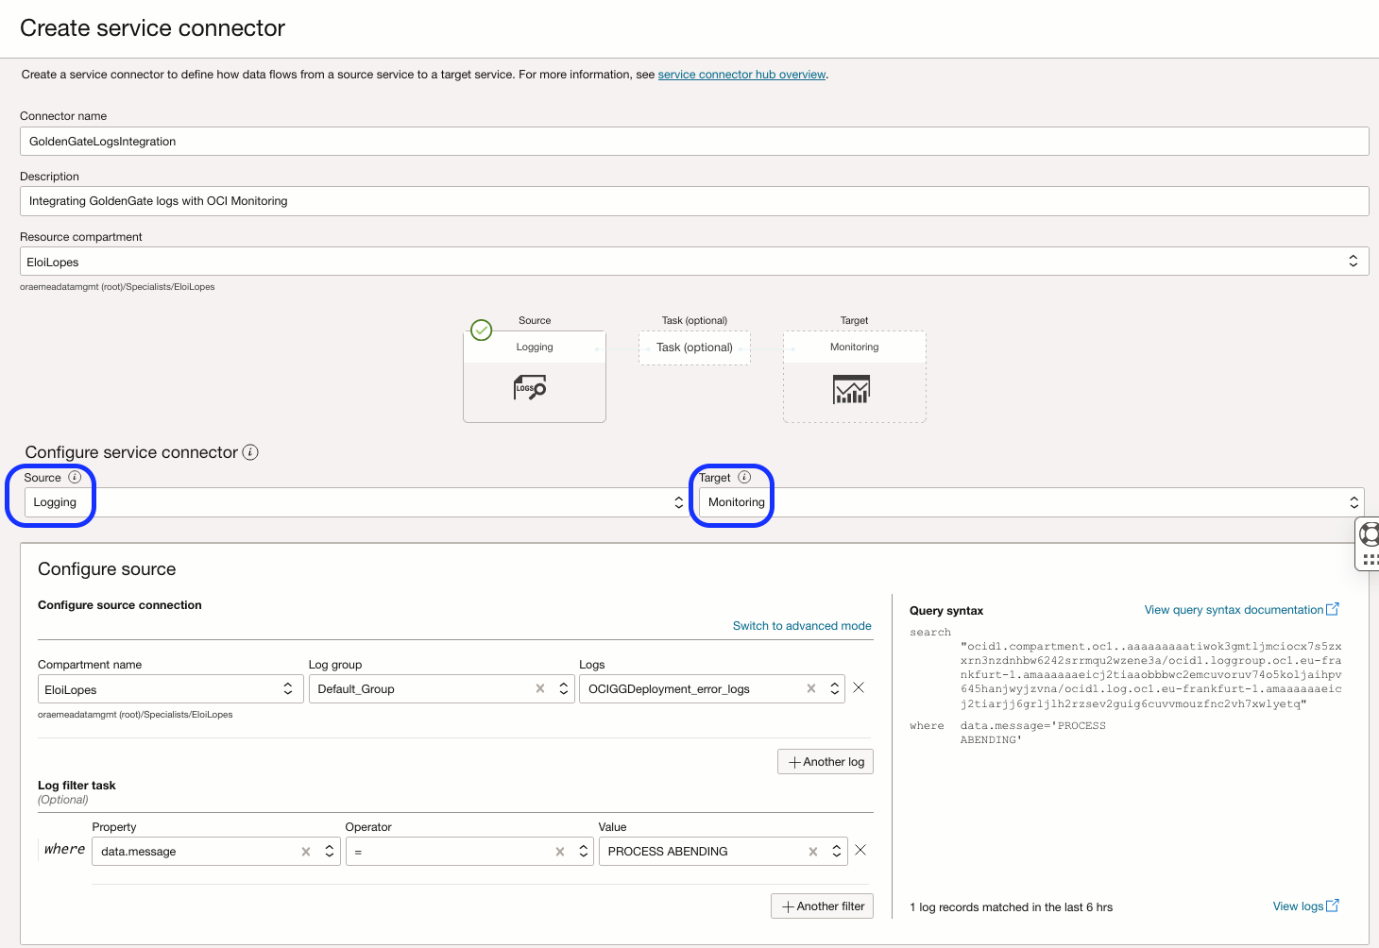
Open the navigation menu and click Analytics & AI. Under Messaging, click Service Connector Hub. Click on Create service connector.
To configure the Logging service as a source and OCI Monitoring as a target, consider using GoldenGate error logs as an example. In this case, you can search for the message “PROCESS ABENDING”:
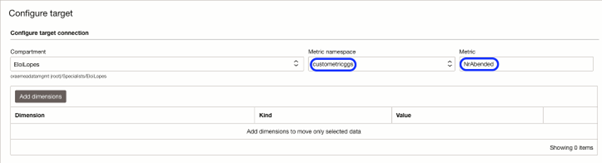
To add a new metric, enter a new metric namespace and click “Enter”. This step is quite important since the Service Connector will be listening on the Logging service, and every time a log of GoldenGate errors contains the value ‘PROCESS ABENDING,’ it will register that occurrence in OCI Monitoring into the new metric namespace ‘custommetricggs.’ The metric ‘NrAbended’ will increase depending on the number of occurrences.
Creating the alarm
Open the navigation menu and click Observability & Management. Under Monitoring, click Alarm Definitions. Click on Create Alarm.
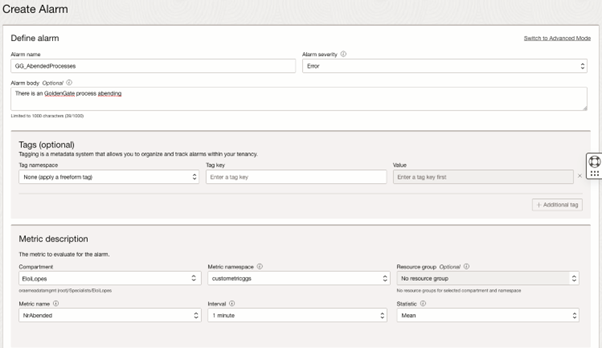
When the alarm is triggered, an email notification will be sent.

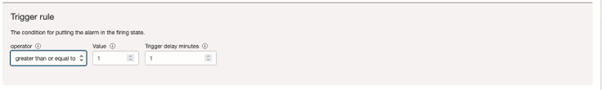
Set the trigger condition to “greater than or equal to 1” to fire the alarm every time a GoldenGate process contains the error “PROCESS ABENDING”.
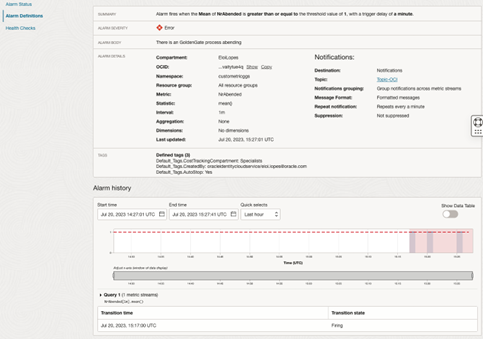
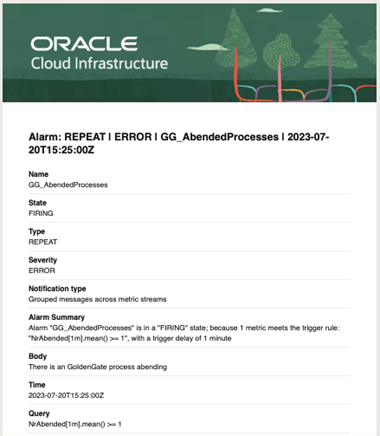
An email notification will be sent to you with details like the one shown below:
We have seen how easy it is to set up GoldenGate logs, explore them with OCI Logging and create alerts using the process and error logs. You can refer to the documentation for additional information.