We are excited to announce that Oracle Database@Azure customers can now stream logs and events from your Exadata infrastructure and VM Clusters directly into Azure Monitor — right alongside the rest of your Azure environment. This gives you a native way to monitor Exadata activity using the tools your teams already know — like Log Analytics, Event Hub, and Azure Monitor alerts.
Why this matters
This isn’t just about enabling a new telemetry stream — it’s about making the operational day-to-day easier and integrating into the customer’s existing security and operational tooling and posture.
-
Faster time to resolution. Your SREs and support teams can catch and troubleshoot issues without jumping between tools.
-
Easier collaboration. Dev, ops, and audit teams can all see what’s happening—no waiting on exports, paying for extra services, or chasing someone to pull logs.
-
Simpler audits. Logs show up in the same place as your other Azure resources, so compliance reviews are faster and less painful.
-
Direct pipeline into your standard monitoring and security tools. Database events now flow straight into Azure Monitor, Splunk, Dynatrace, Event Hub—whatever you already use—helping you get full coverage, strengthen security, and tighten incident response.
This feature streams a wide range of Exadata logs and events, including:
-
Exadata VM Cluster – create, delete, scale, add/terminate VM
-
Exadata Infrastructure – hardware updates, maintenance events
-
Exadata Database – backups, upgrades, container and pluggable DB lifecycle
-
Exadata Data Guard – switchover, failover, reinstate
You decide which log categories to stream and where they go — including:
-
Azure Log Analytics – required for viewing logs in Azure Monitor, where you can see them alongside other workloads, create rules, and trigger alerts
-
Azure Event Hub
-
Storage Accounts – for long-term retention
-
Partner tools like Dynatrace
How to get started
You can turn on log streaming during VM Cluster creation (those checkboxes in the Diagnostics tab) or add it anytime later — no need to recreate anything.
To enable logging after creation:
-
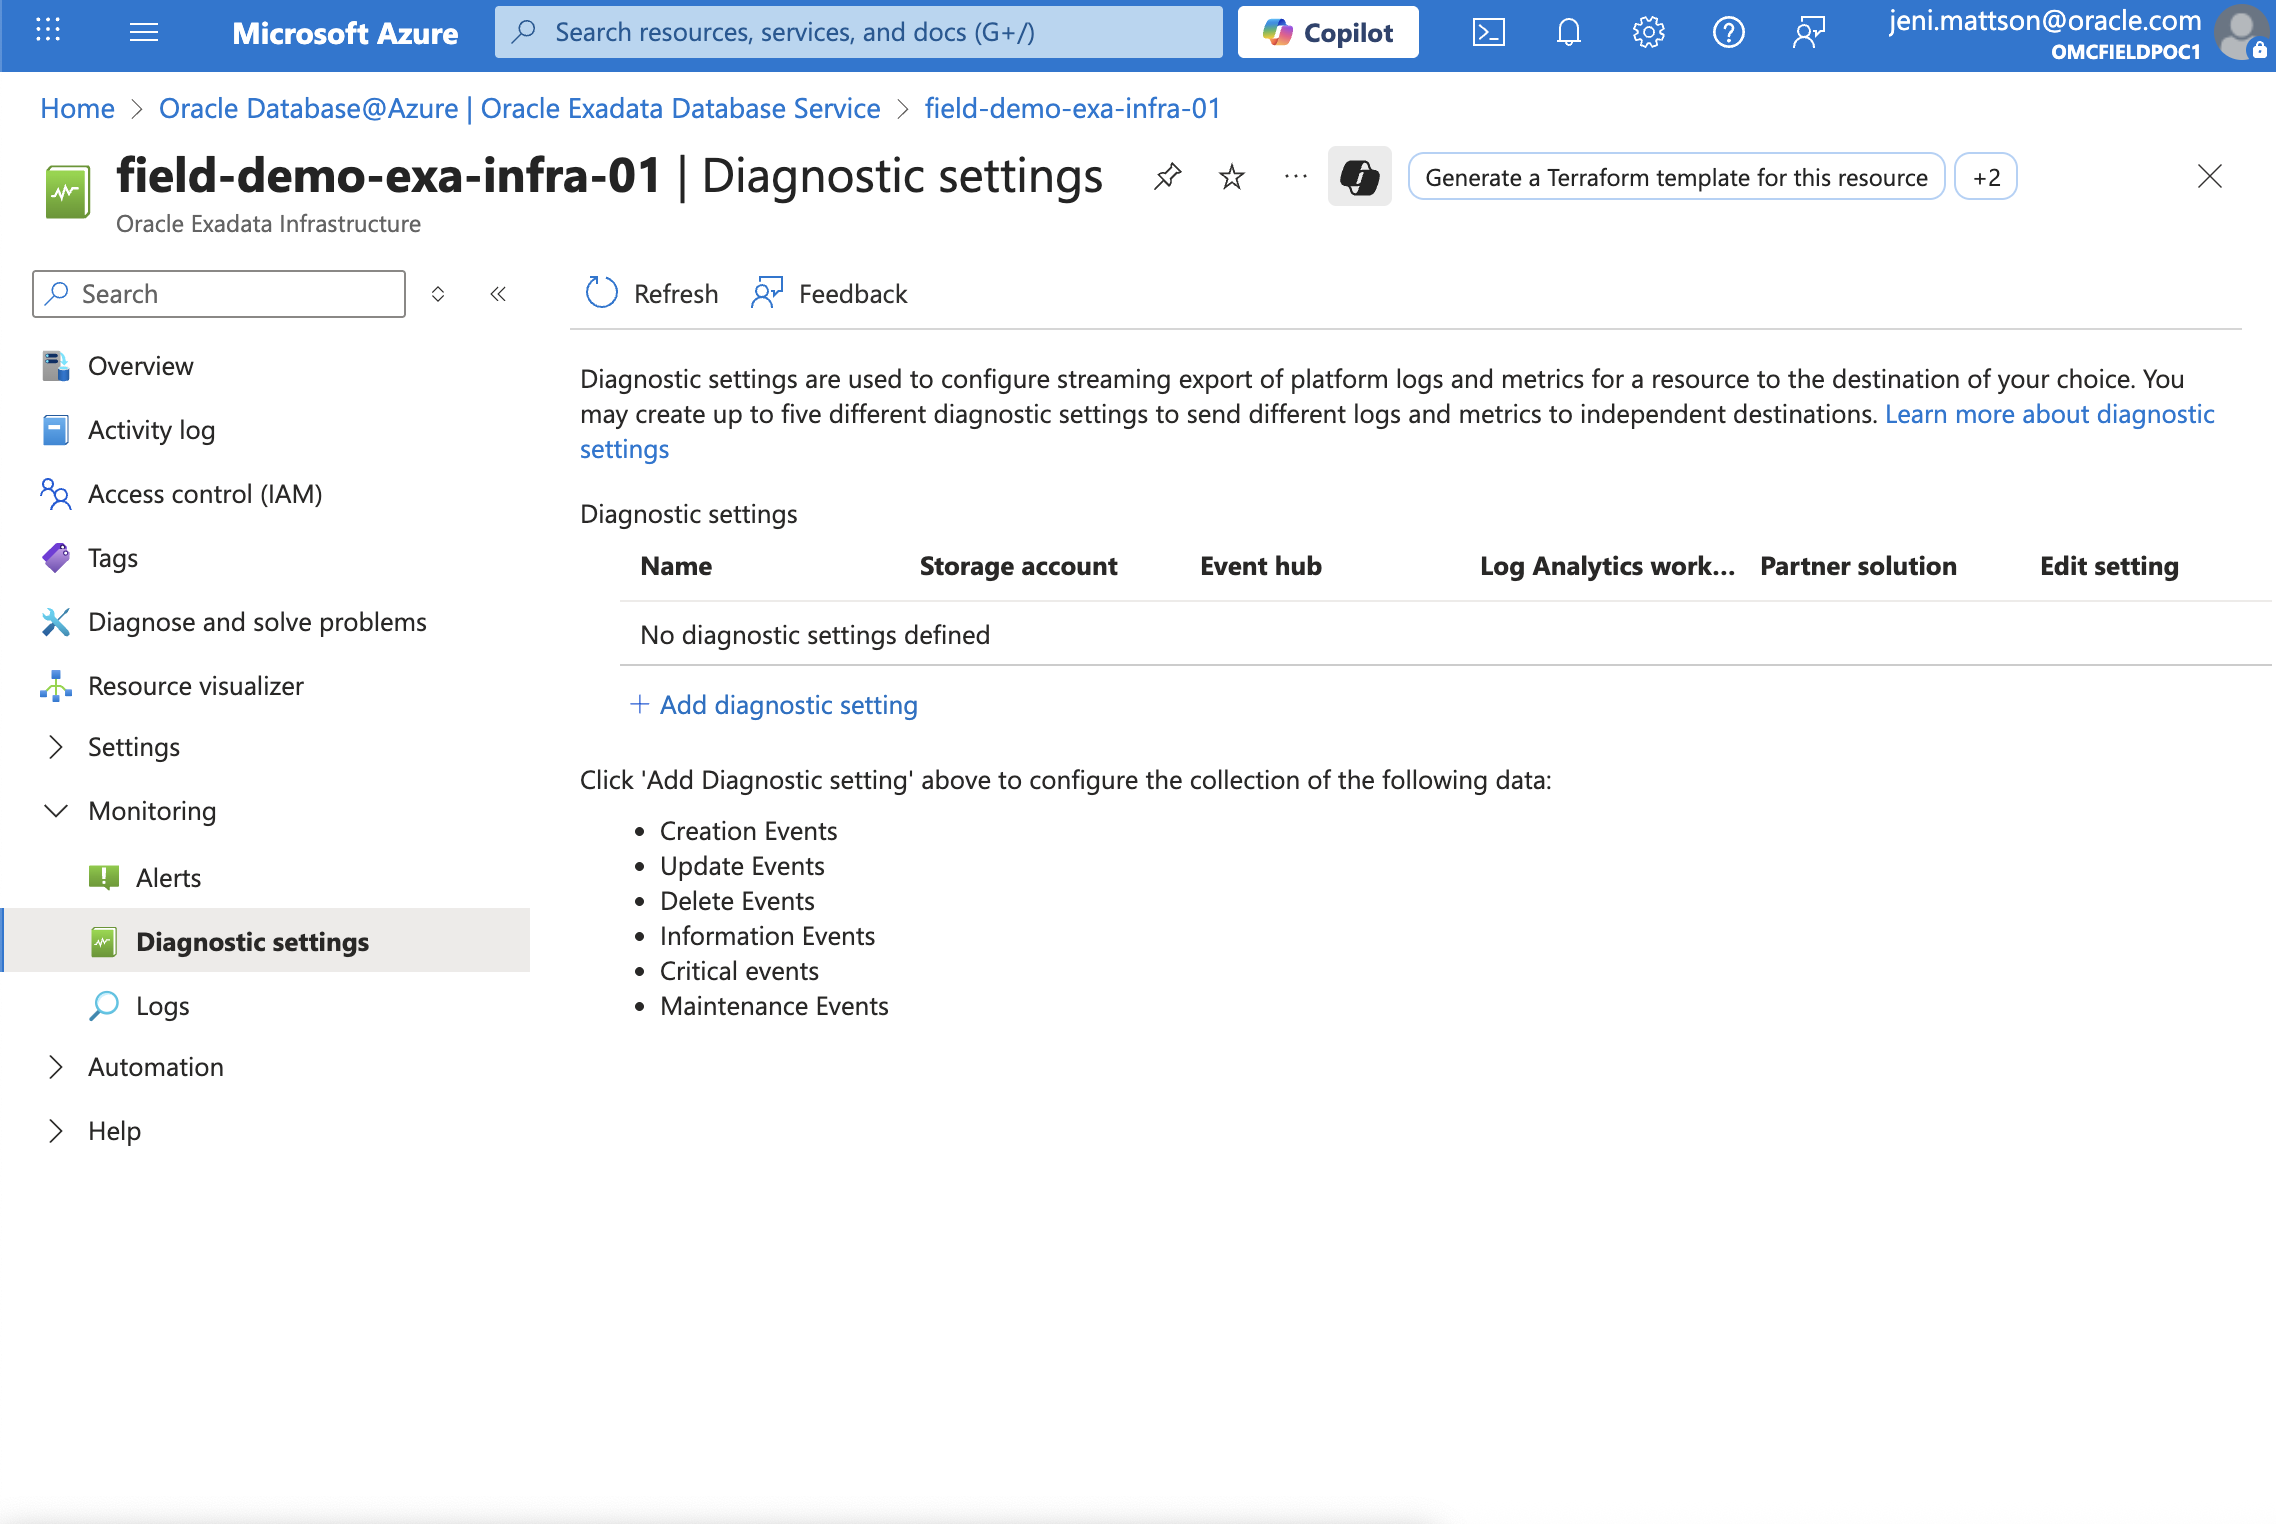
Go to your Exadata Infrastructure or VM Cluster in the Azure Portal
-
Open Monitoring > Diagnostic Settings
-
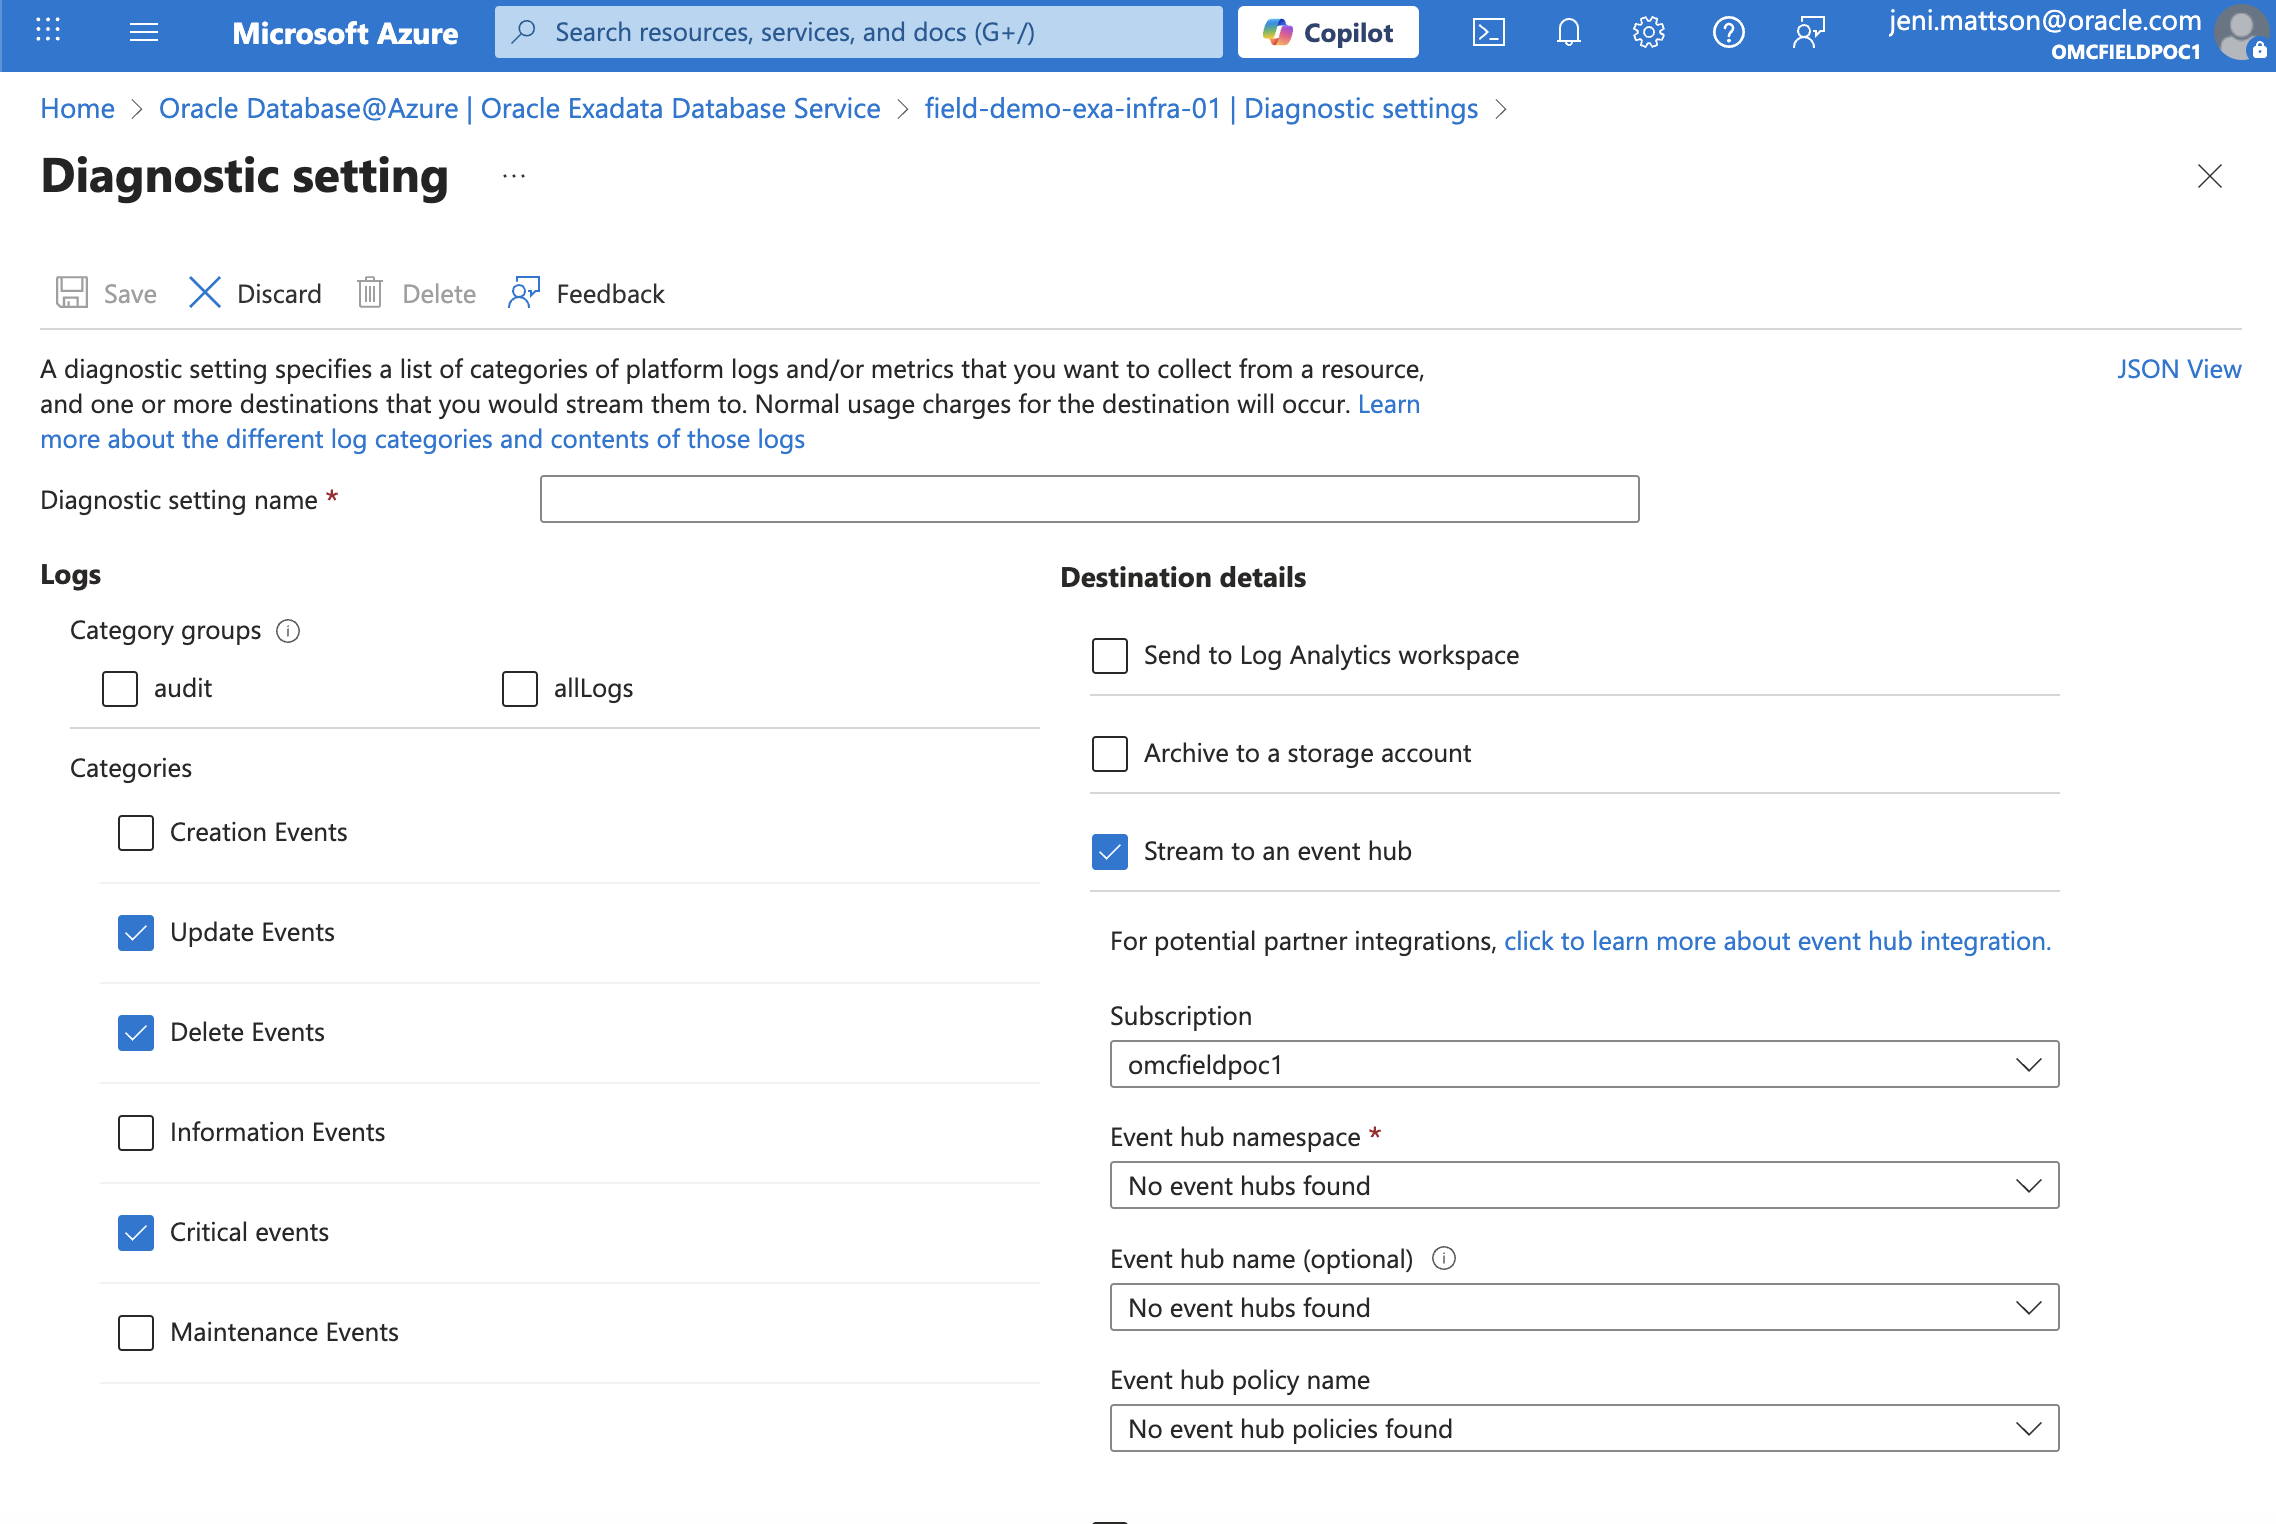
Select your log categories
-
Choose your destination — to view logs in Azure Monitor, select Log Analytics as one of your destinations
-
Click Save
That’s it — once saved, logs and events will begin streaming to your selected destinations.
A Few Things to Know
Before you jump in, here are a few limitations worth keeping in mind:
-
Logs may be delayed. After enabling diagnostic settings, it can take up to an hour for logs and events to start showing up in Azure Monitor or your selected destination.
-
Diagnostic settings are limited to five per resource. You can create up to five diagnostic settings per Exadata resource (VM Cluster or Infrastructure).
-
No duplicate destinations. You can’t create two diagnostic settings that send the same log categories to the same destination — each configuration must be unique.
Resources
View step-by-step setup guide
Learn more about Oracle Database@Azure