Some of the well-known advantages of using API Gateway include authentication and authorization, rate limiting, request, and response transformations. With the introduction of API usage plans in Oracle Cloud Infrastructure (OCI), enterprises can control the rate at which different subscribers and clients can invoke their backend APIs through the OCI API Gateway.
As important as the enterprises preventing their APIs from sudden load bursts or any DDoS attacks, they must also understand the behavior and usage patterns of their API customers. OCI API Gateway includes an extensive logging capability, which logs all the access and run results when enabled. They can then use these logs to create rich custom dashboards to view the API usage trends, giving the API administrators the following capabilities:
-
Define dedicated usage plans for high usage subscribers
-
Get insight on off-peak and peak load times, right-scaling of backend applications
-
Monetize API usage
Solution options
API Administrators can get insights into API usage patterns in the following ways:
-
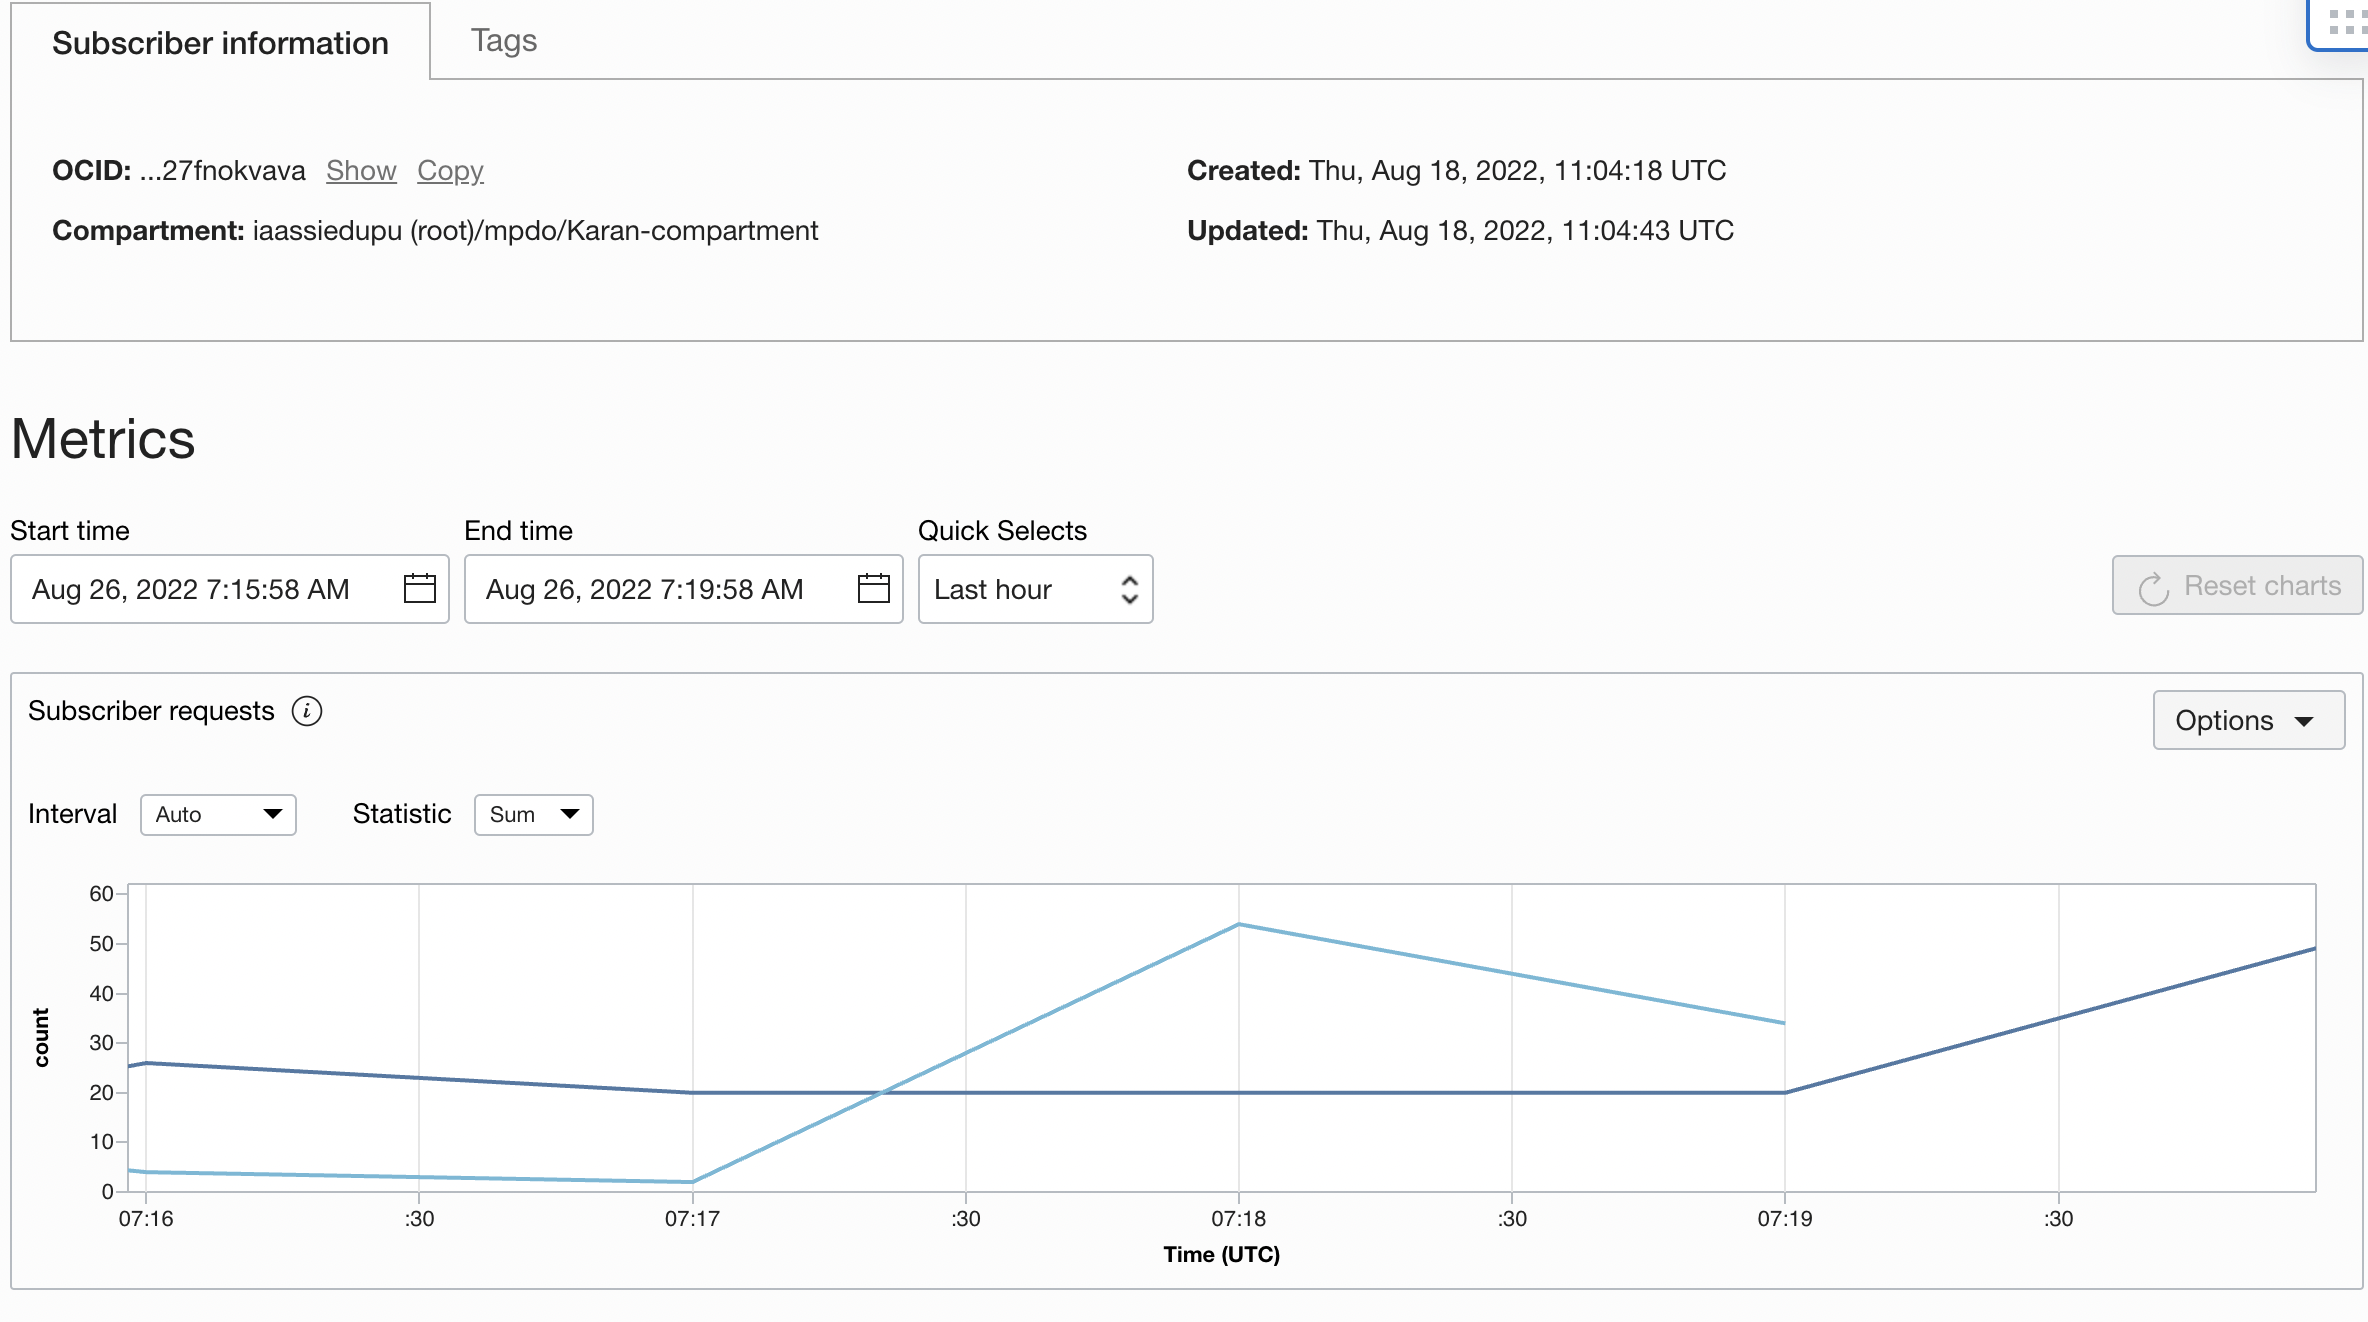
Using built-in metrics: Provides quick insights for the administrator to understand the subscriber usage. Metrics are ready-to-use, predefined, and specific to a subscriber.
-
OCI custom dashboards: Provides advanced, rich visualizations that can include multiple OCI services in the same panel. Use them to view API usage for all the subscribers at the same place. You can write your own custom queries and add widgets to the dashboard.
-
Logging analytics: More advanced than OCI Dashboards, logging analytics provides robust dashboards that can correlate backend services with subscribers. Provides a single pane of glass to view metrics across different OCI services.
Further in this post, we dive deeper into how API Administrators can use OCI API Gateway logs with Logging Analytics to monitor and analyze their API customers’ usage trends.
Prerequisites
This post assumes that you have a working knowledge of OCI, OCI API Gateway, OCI Logging Analytics, and OCI service connectors. If you want help on enabling these services in your compartment, see Get insight into API Gateway logs using OCI Logging Analytics.
You also need at least one deployment on API Gateway, one usage plan, and one subscriber.
Outcome
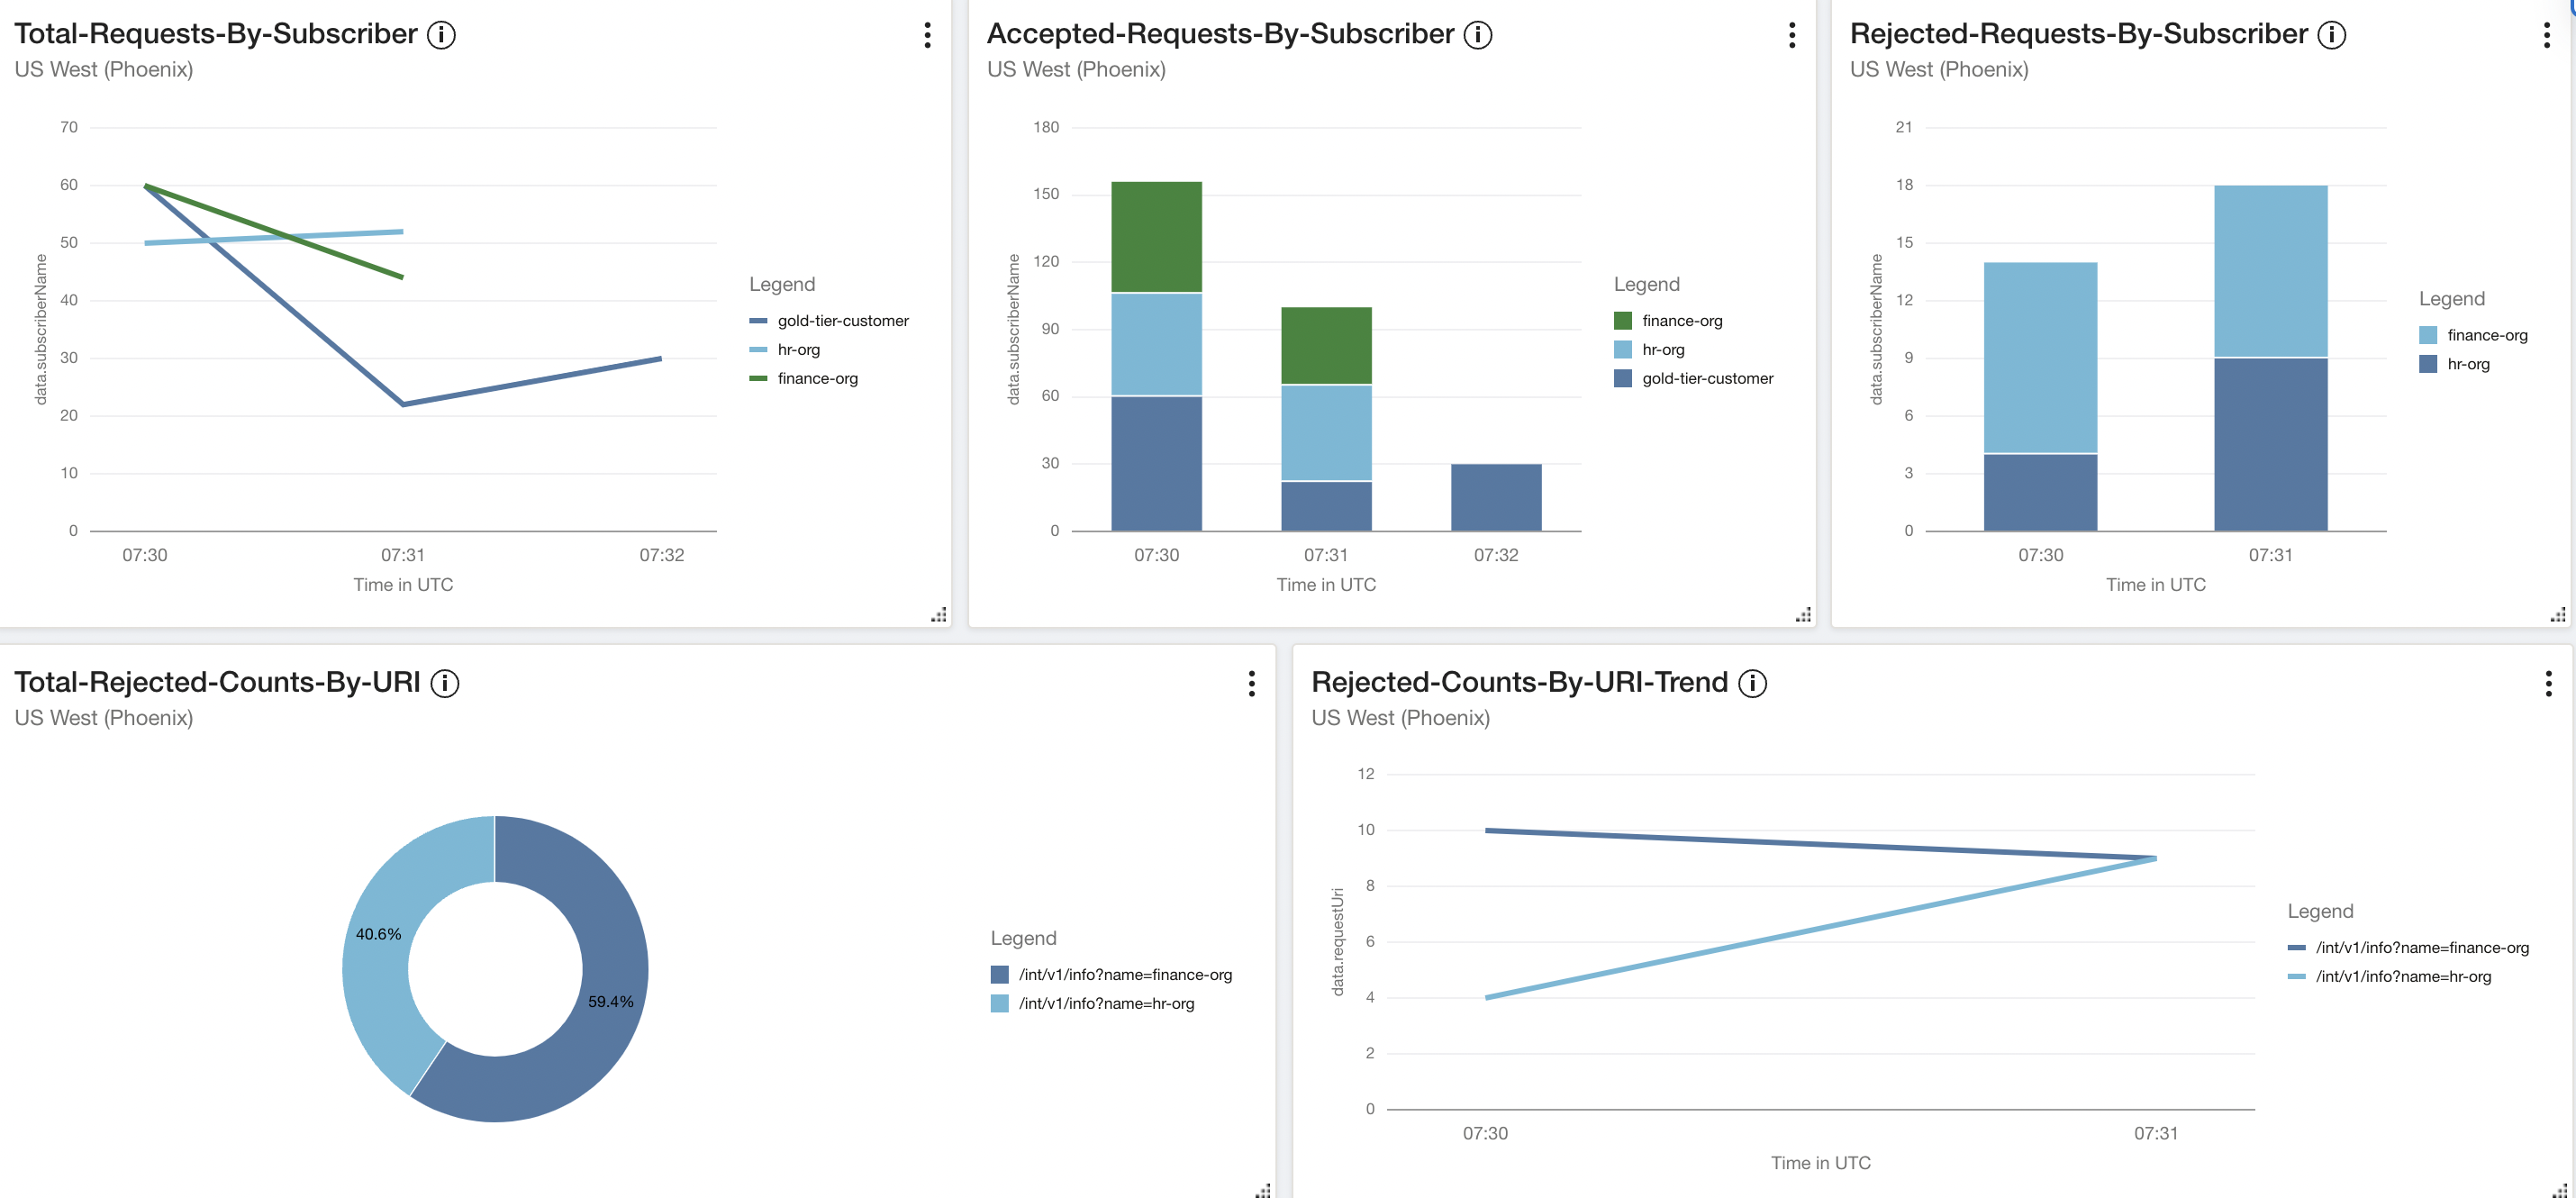
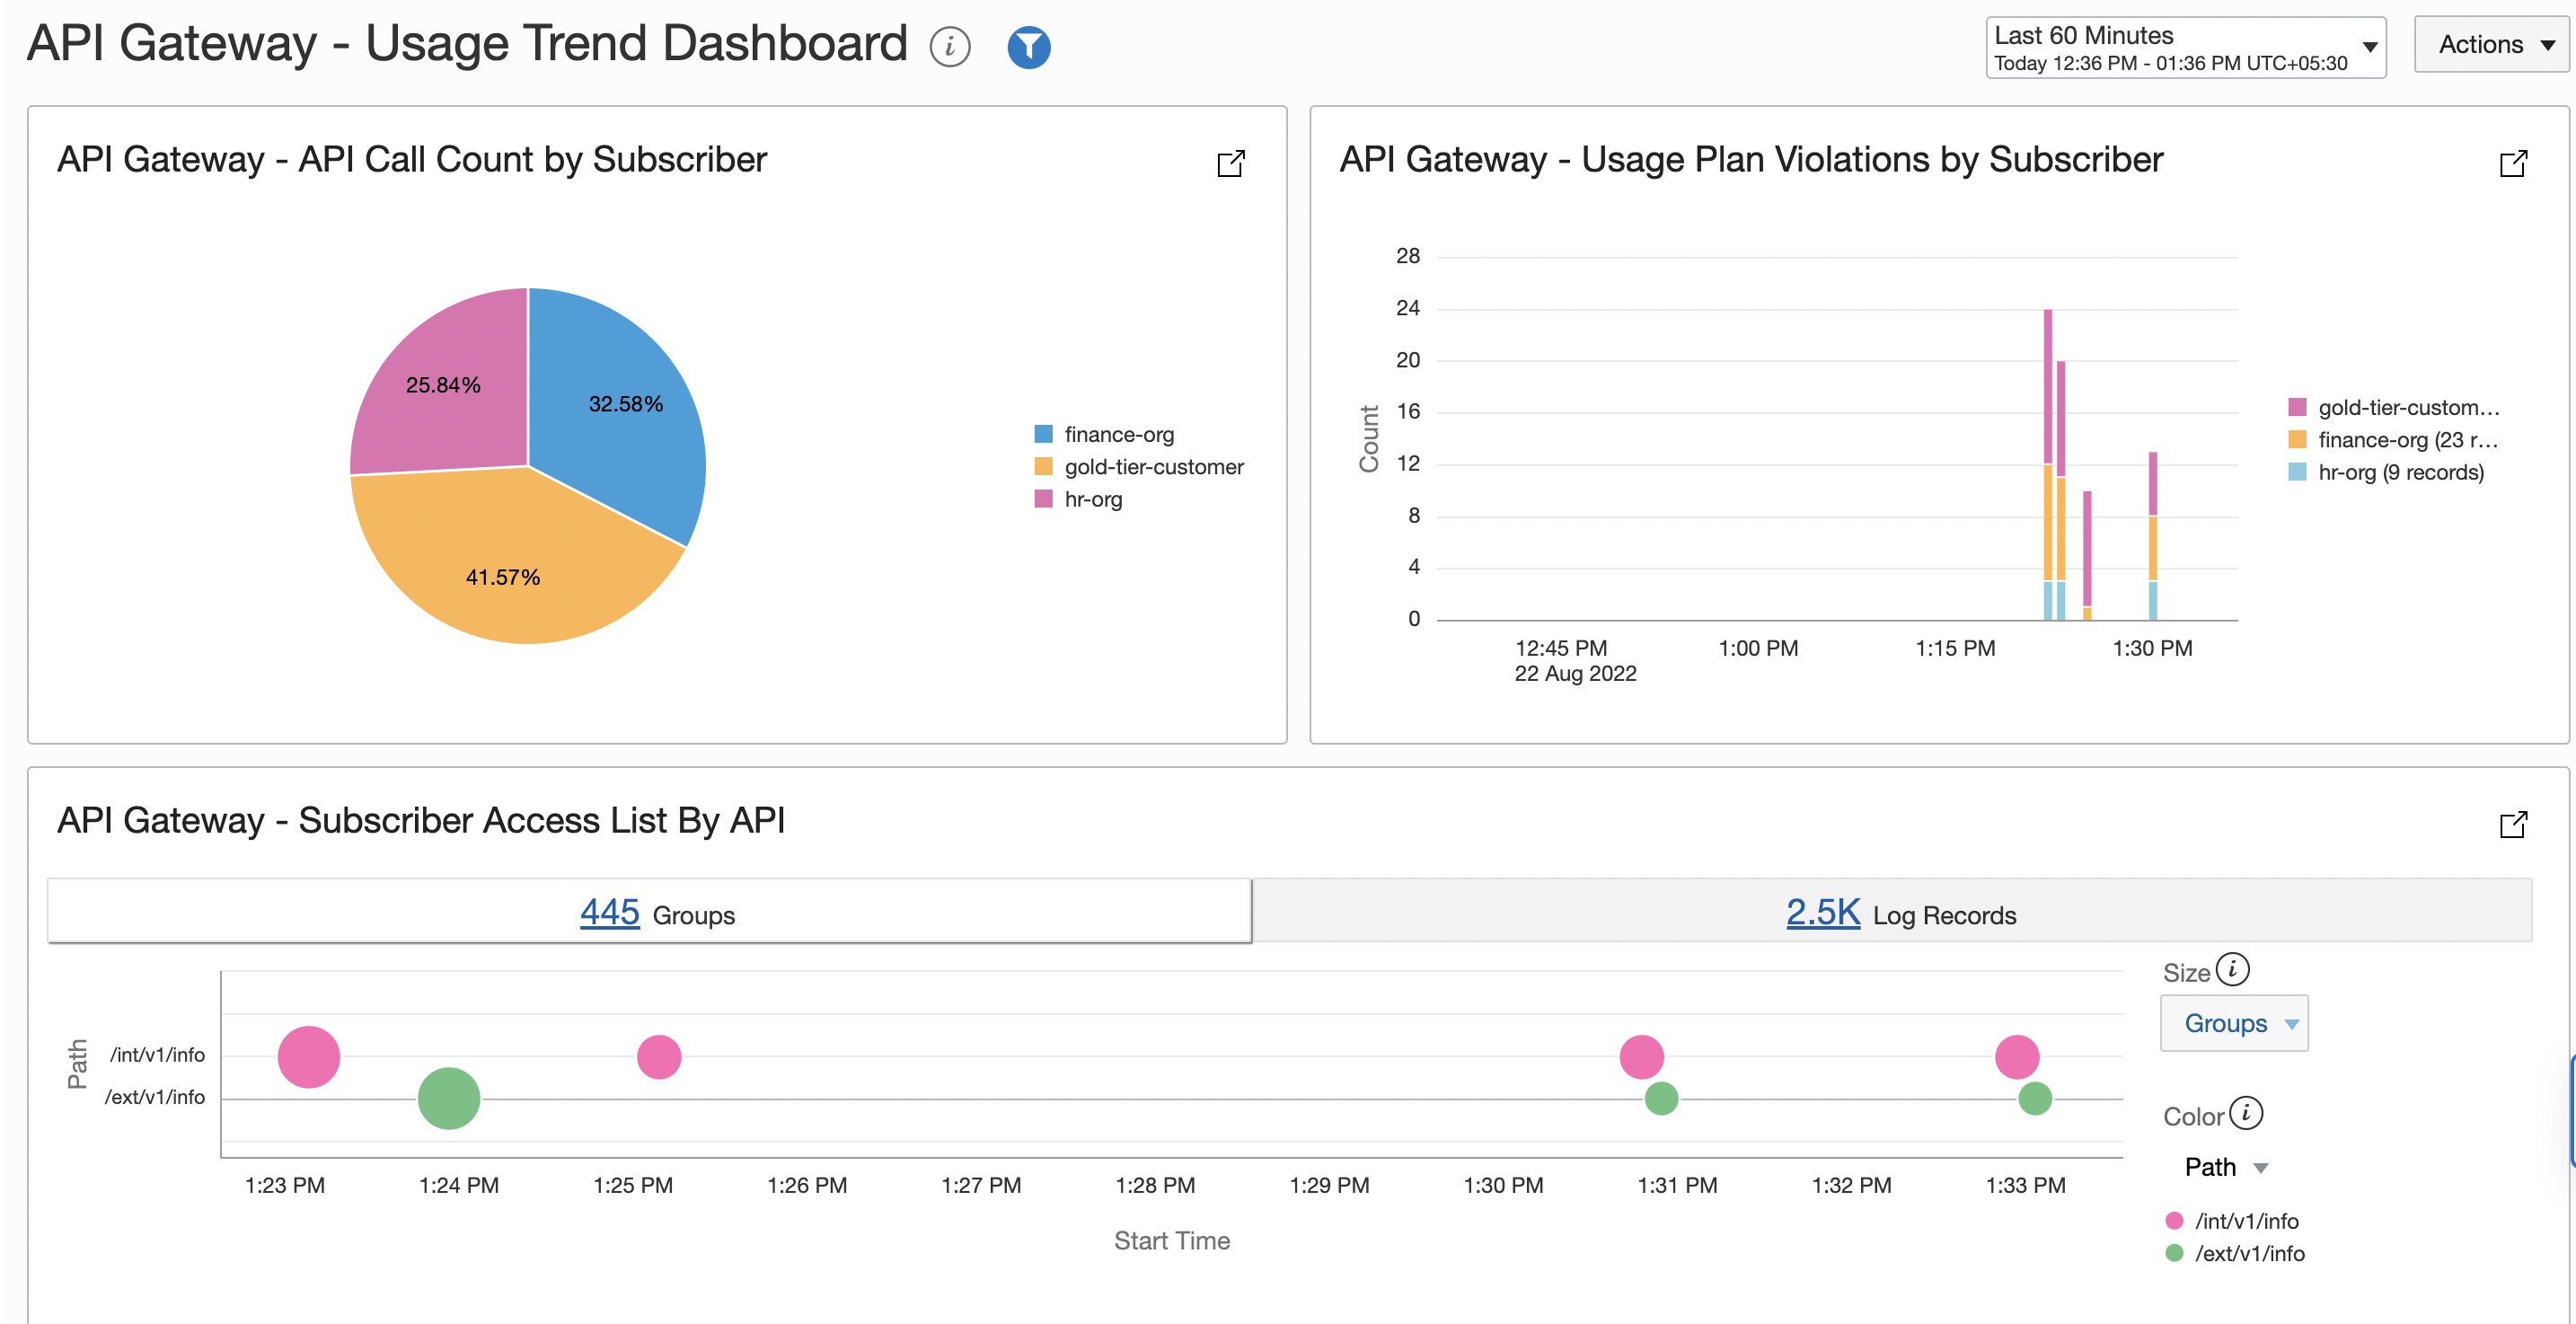
By the end of this blog, you can create a dashboard in OCI Logging Analytics service, which shows the following information:
-
API call counts by subscriber
-
Usage plan quota violations by subscriber
-
List of subscribers accessing an API
Solution
In the sample setup, I’m using two deployments on the same API Gateway, two usage plans, and three subscribers. Now, let’s walk through the steps required to push logs into Logging Analytics and create a dashboard.
-
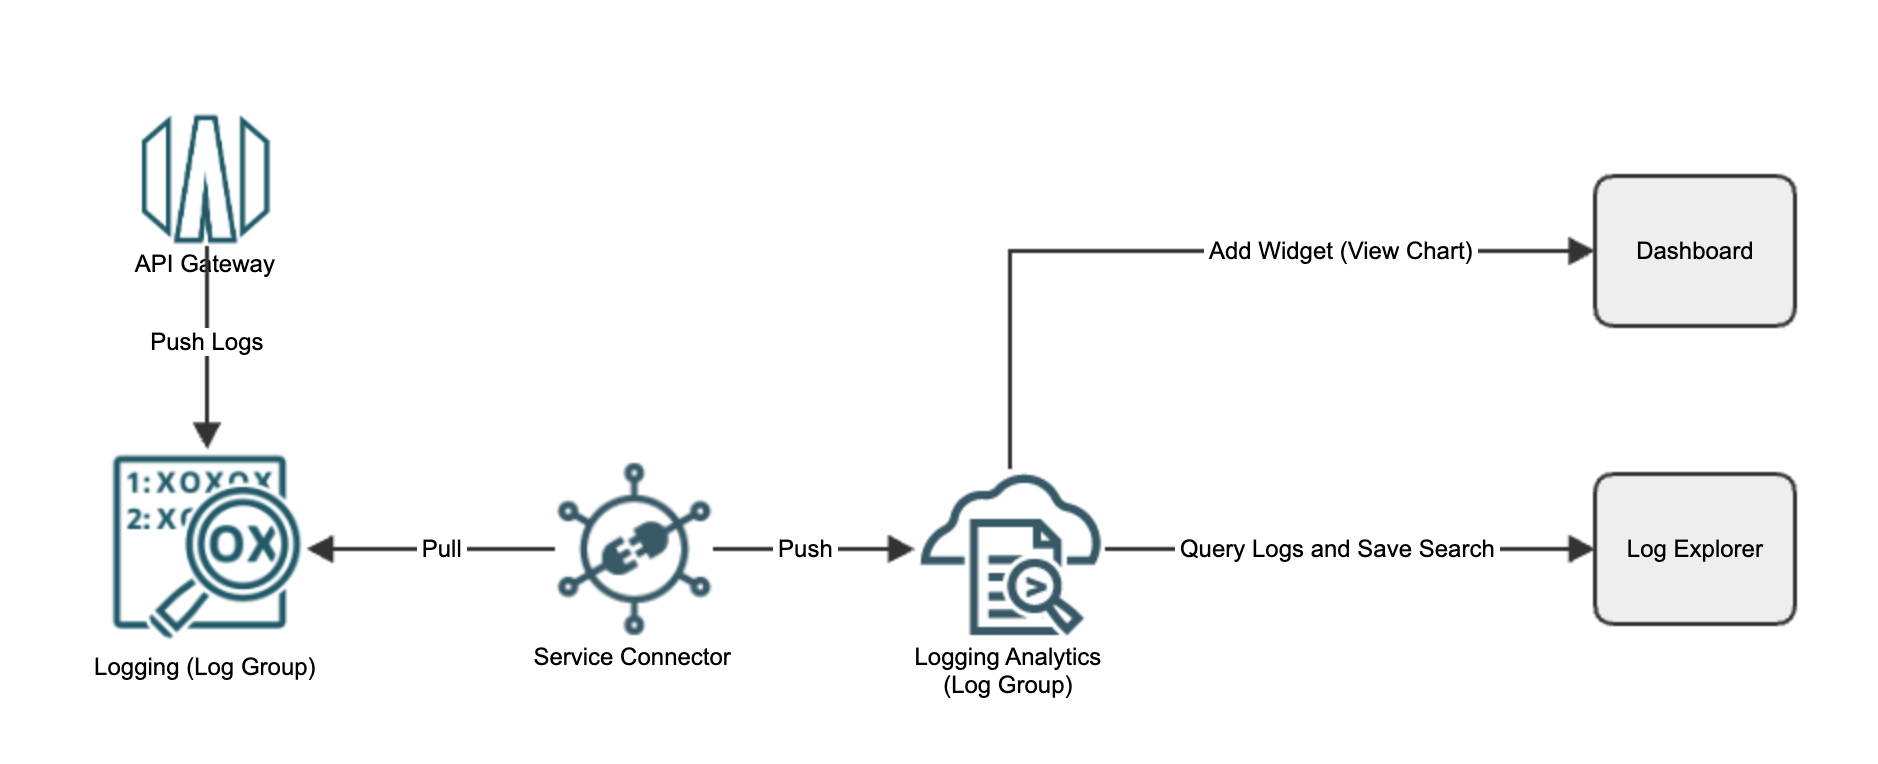
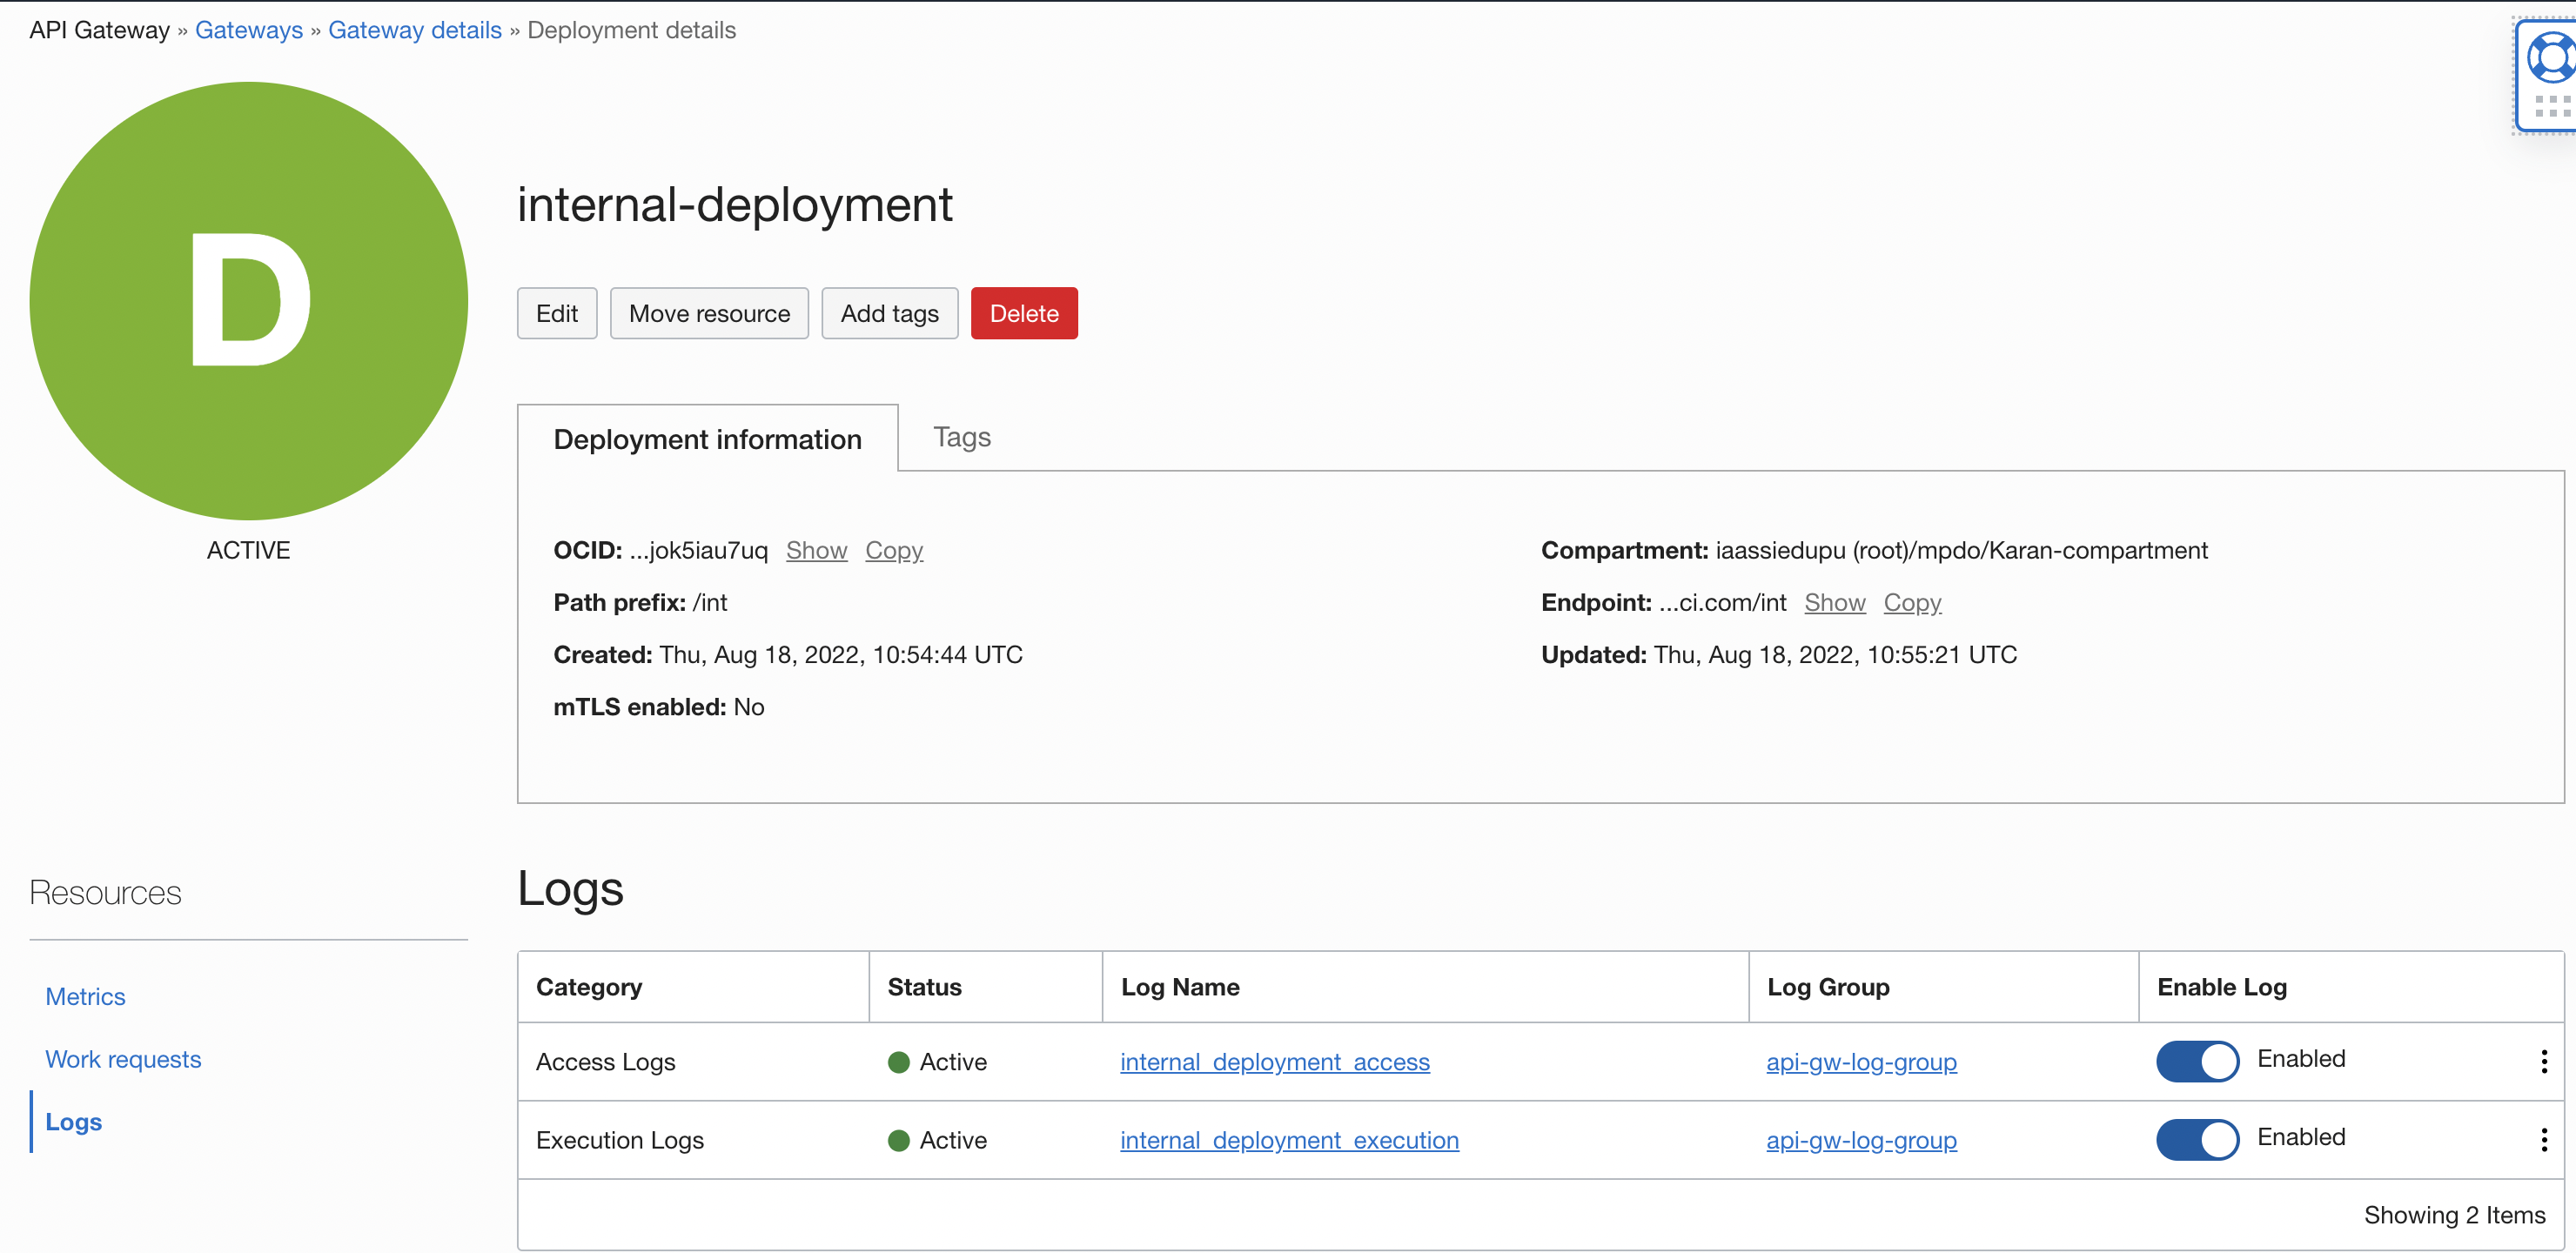
Enable logs in the deployment within API Gateway: Go to your deployment and click Logs, and then enable both the logs. For our use case, we need to enable both access and run logs, but you can choose which to enable, based on your requirement. Enabling these logs sends the logs into the Logging group.
-
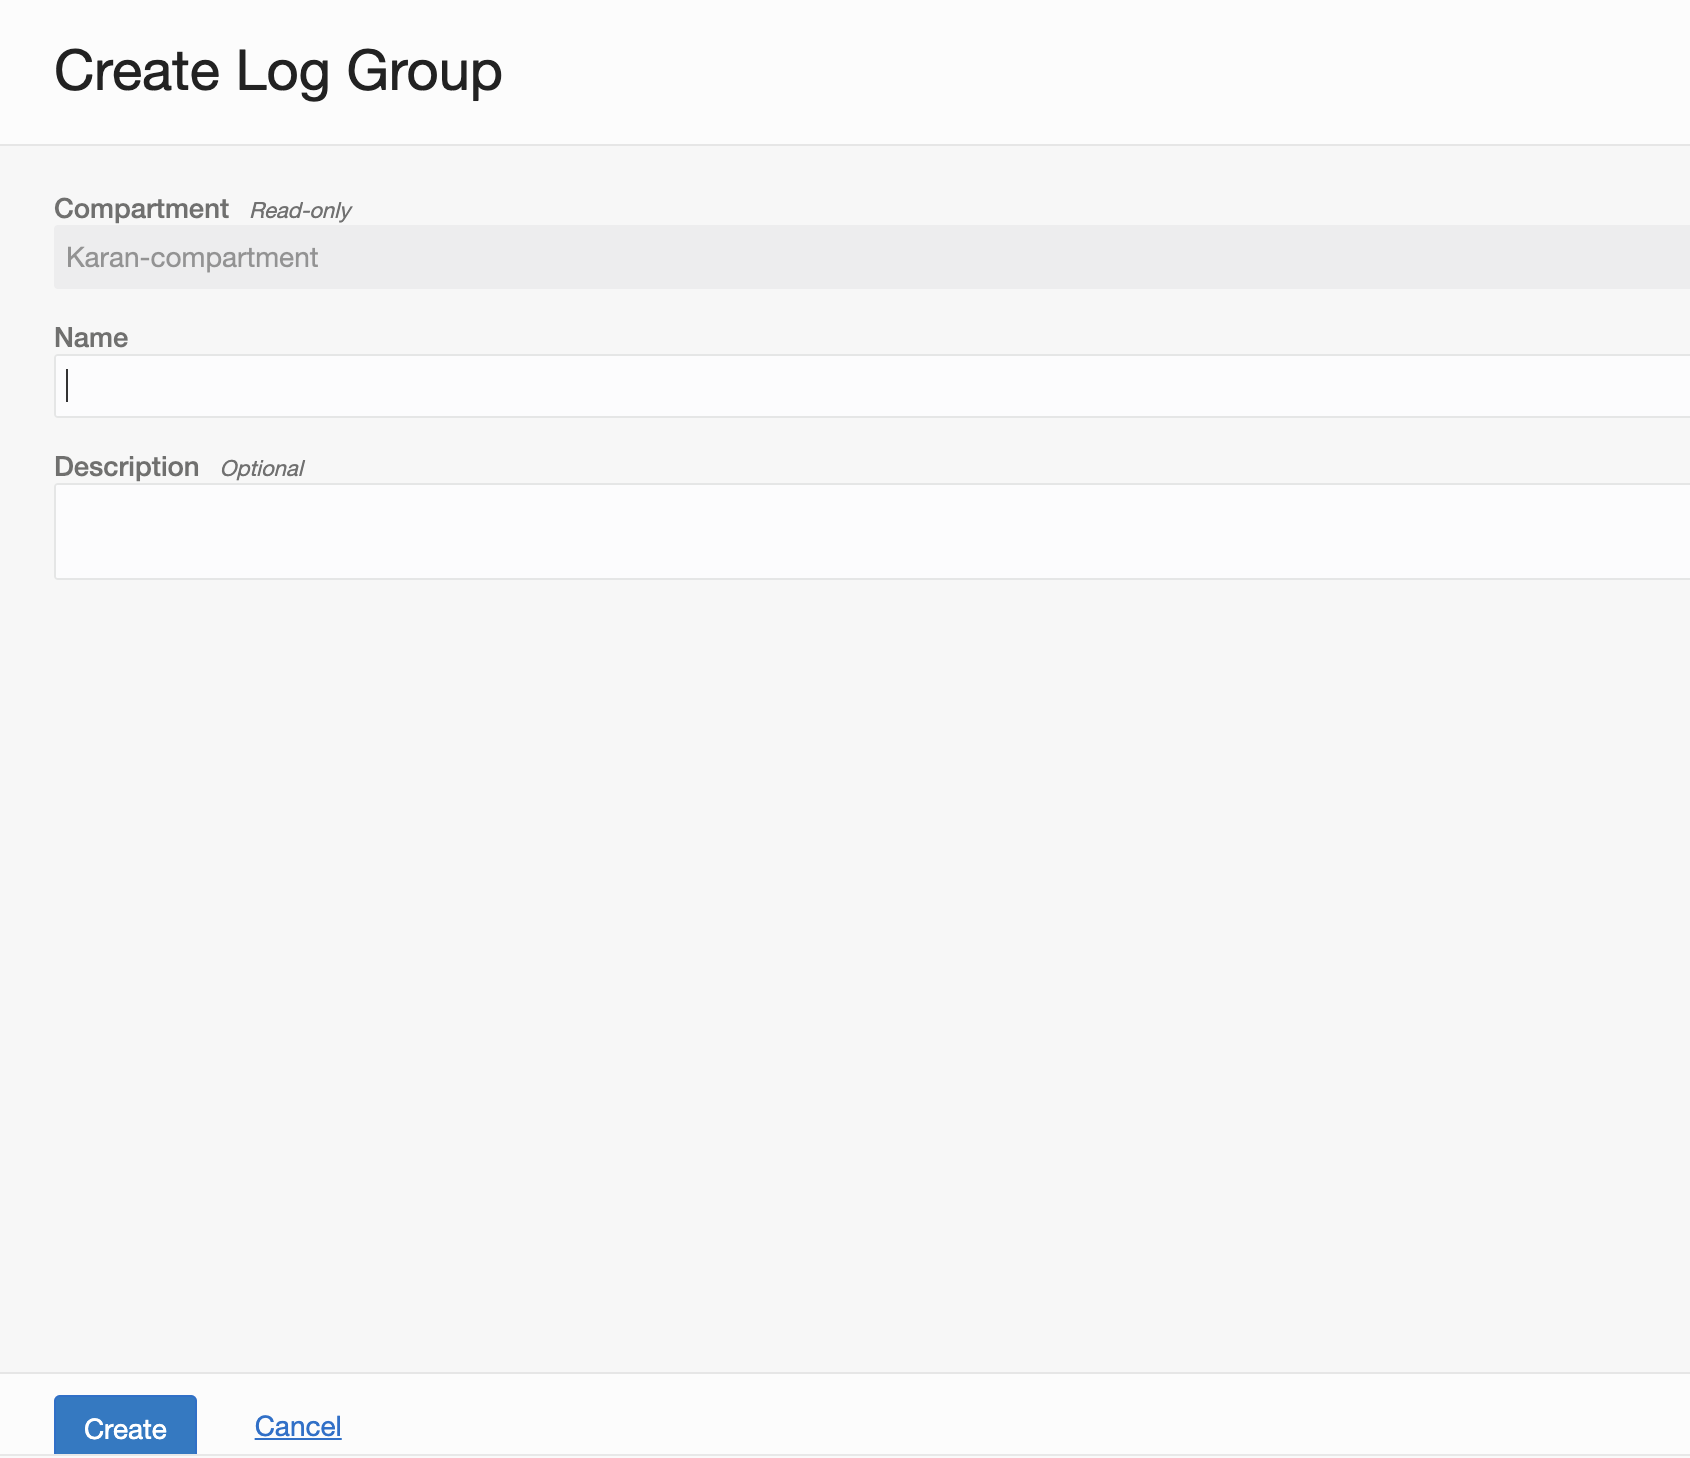
Create a log group in Logging Analytics: Under Logging Analytics, select Administration, then Log Group, and then click the Create Log Group button.
-
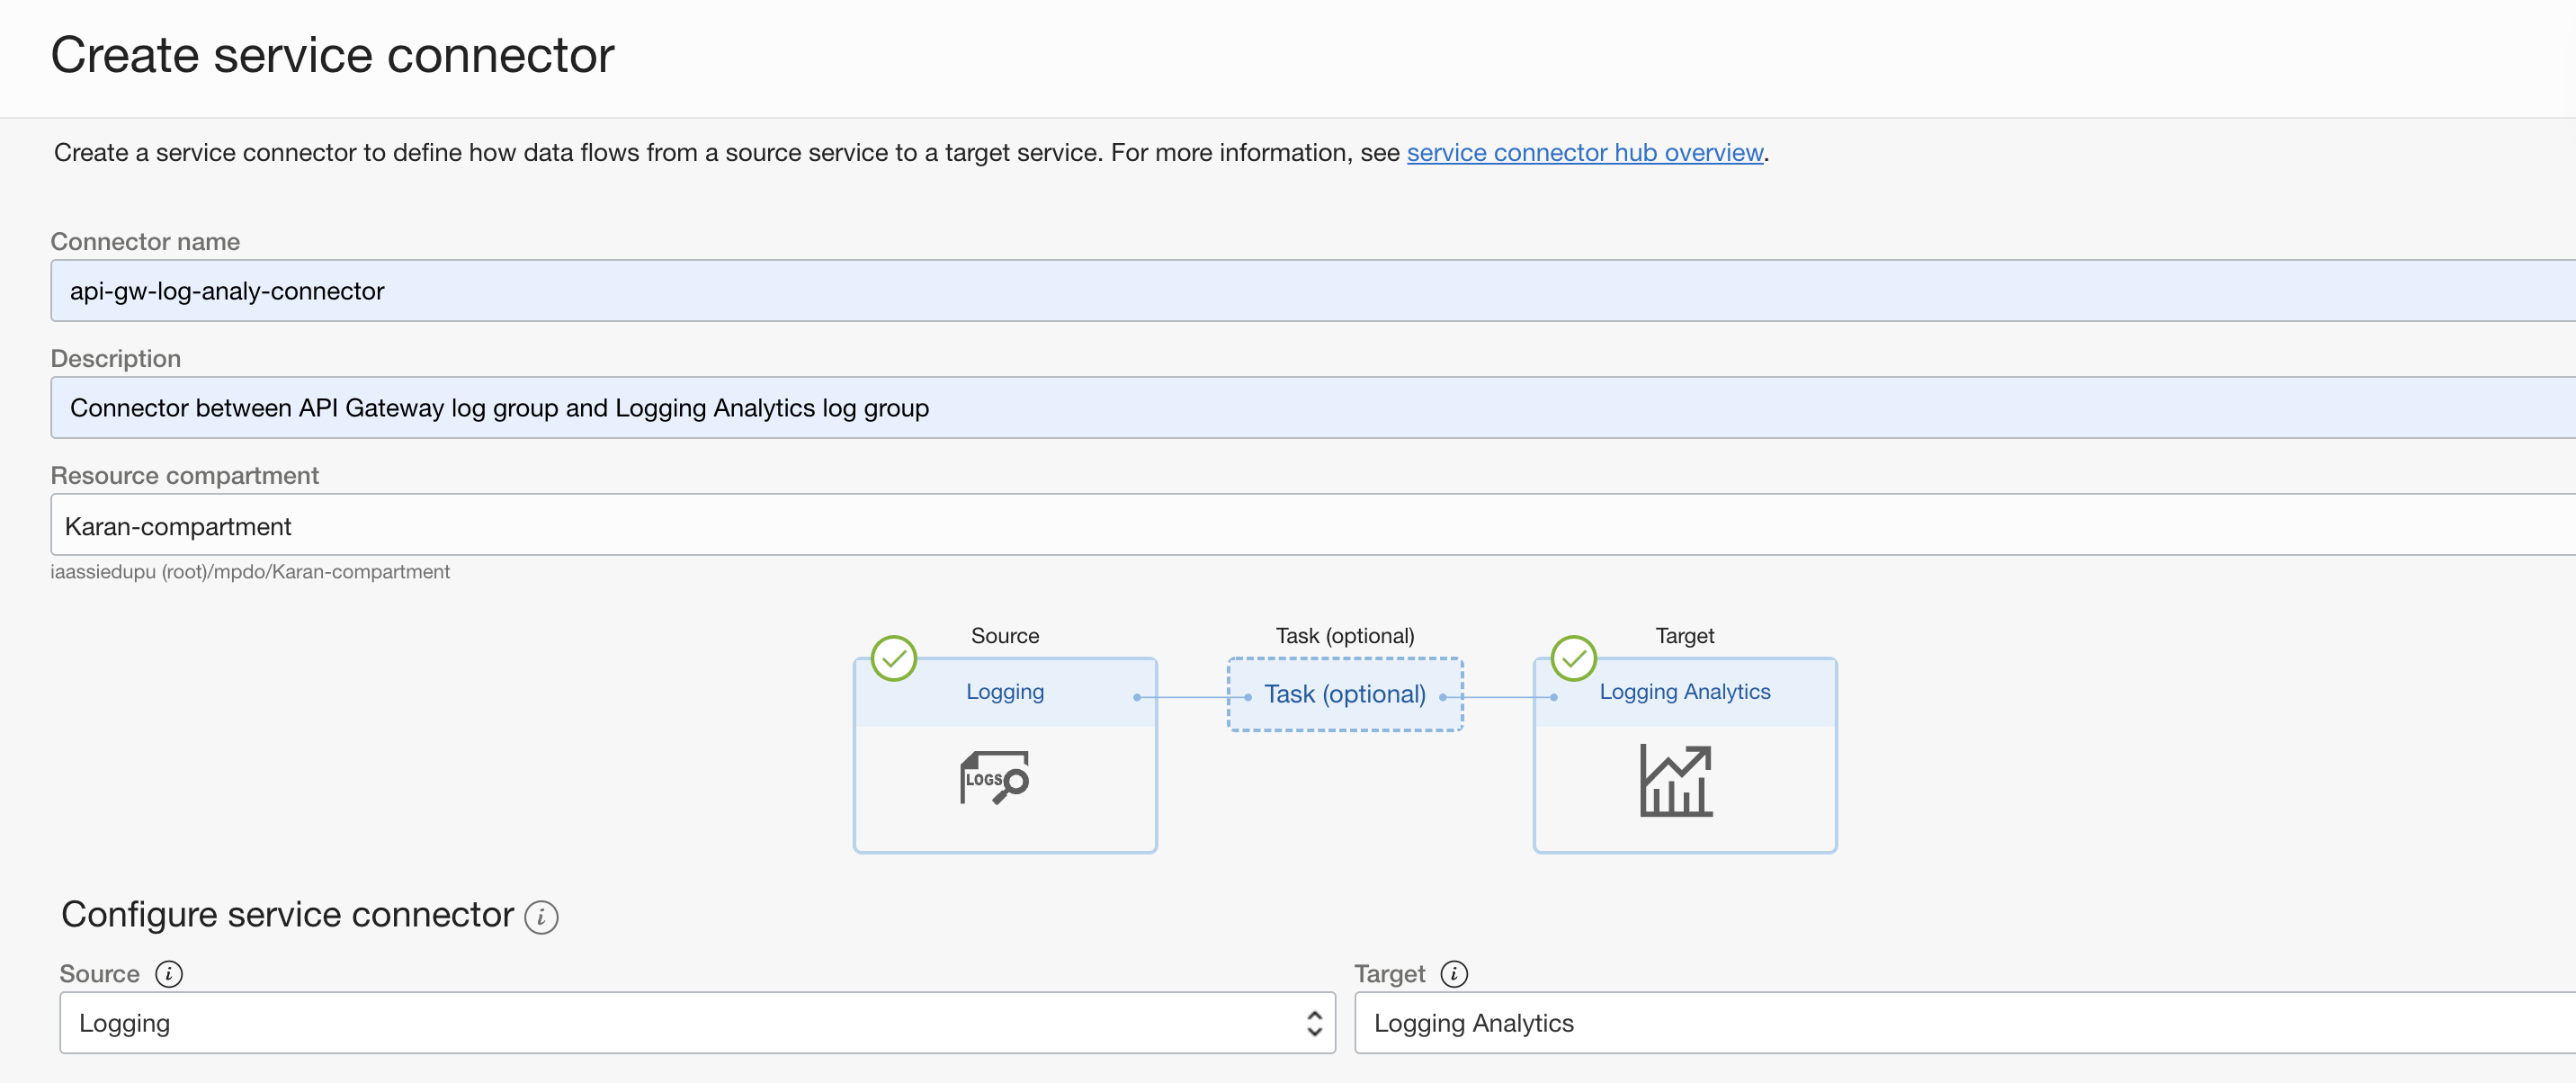
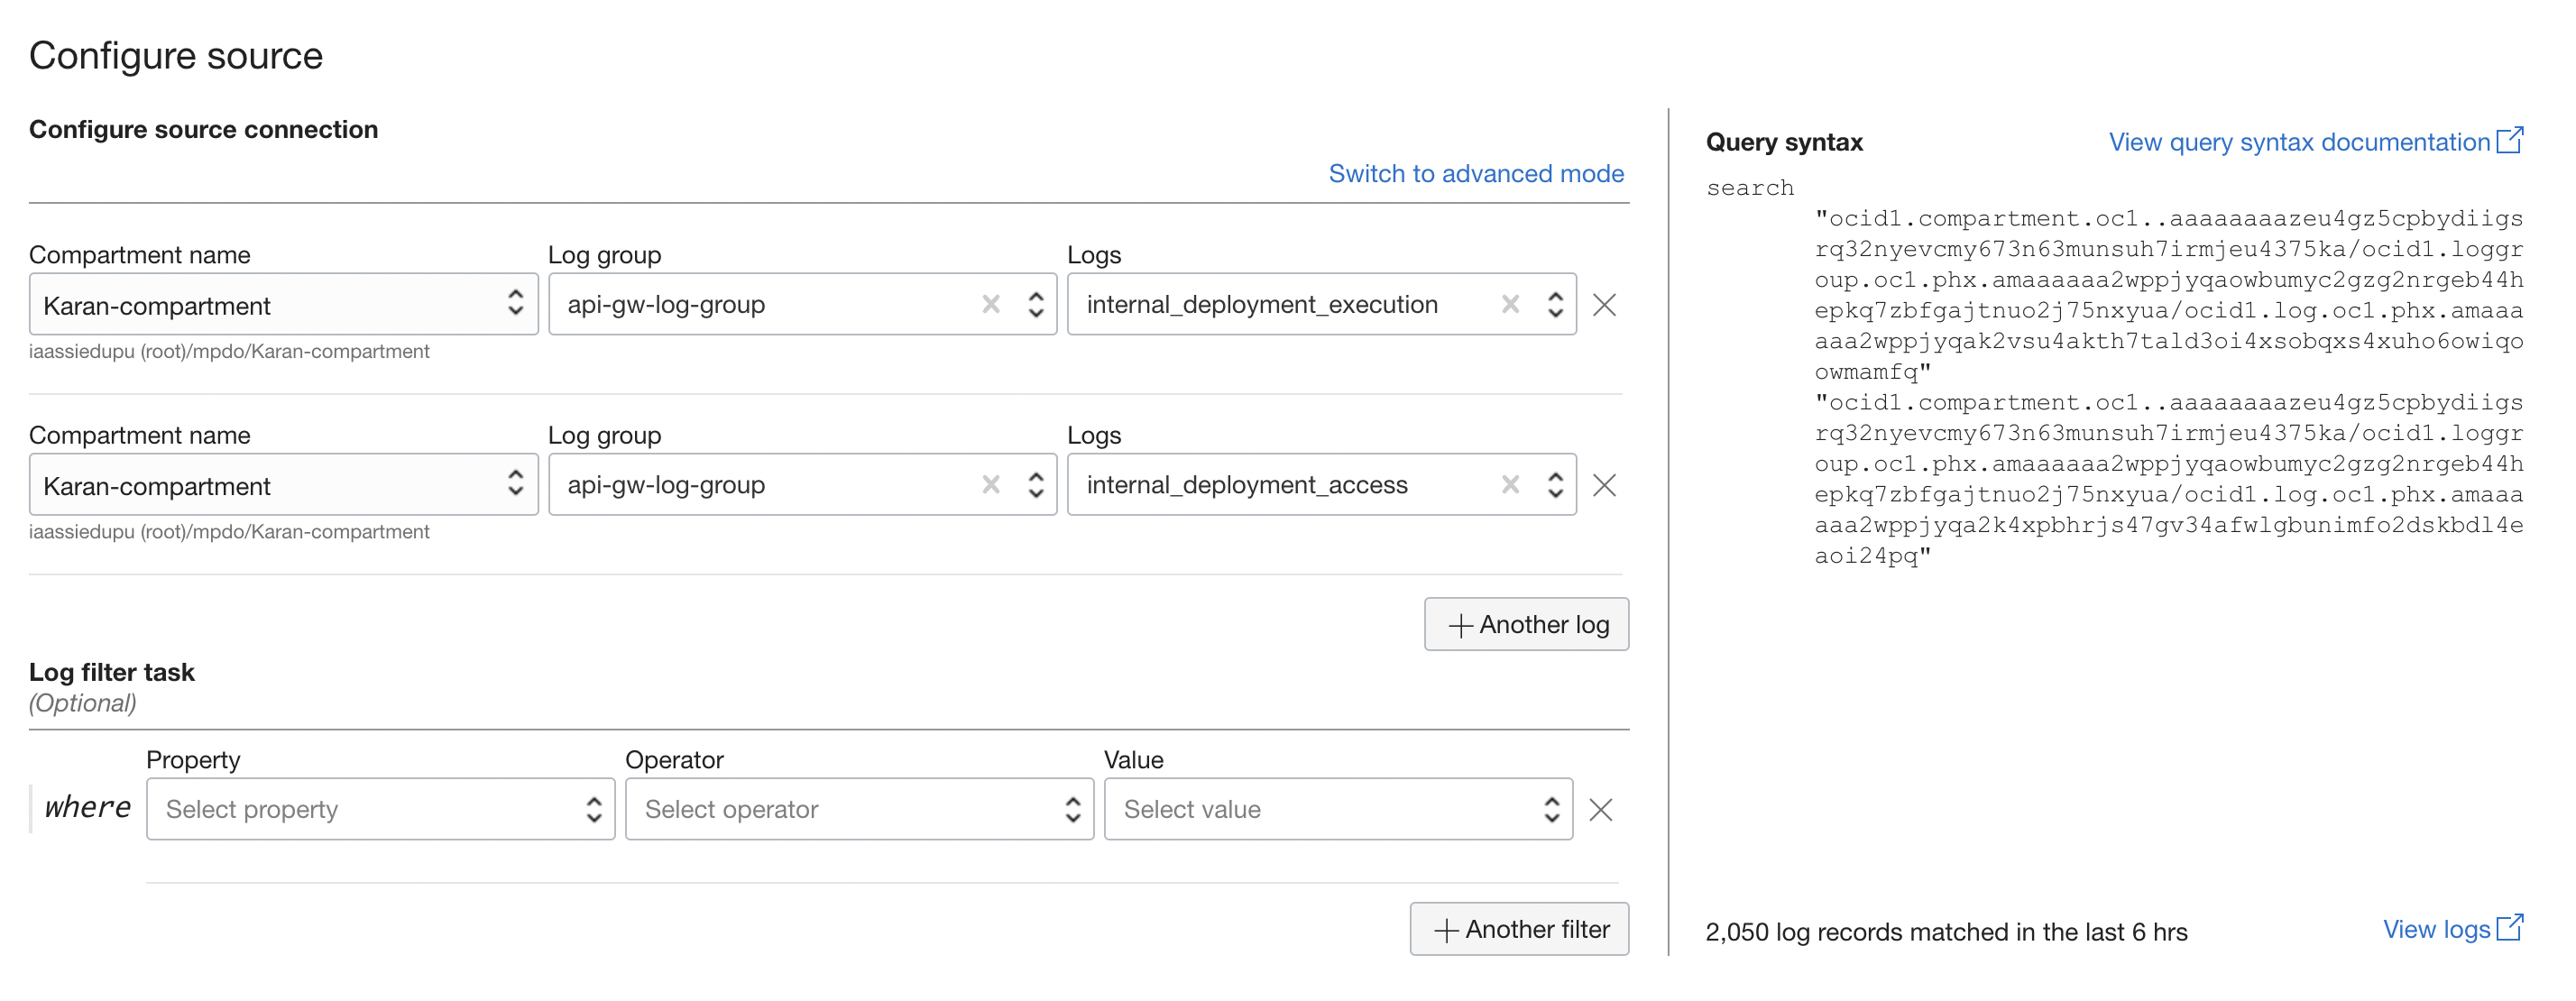
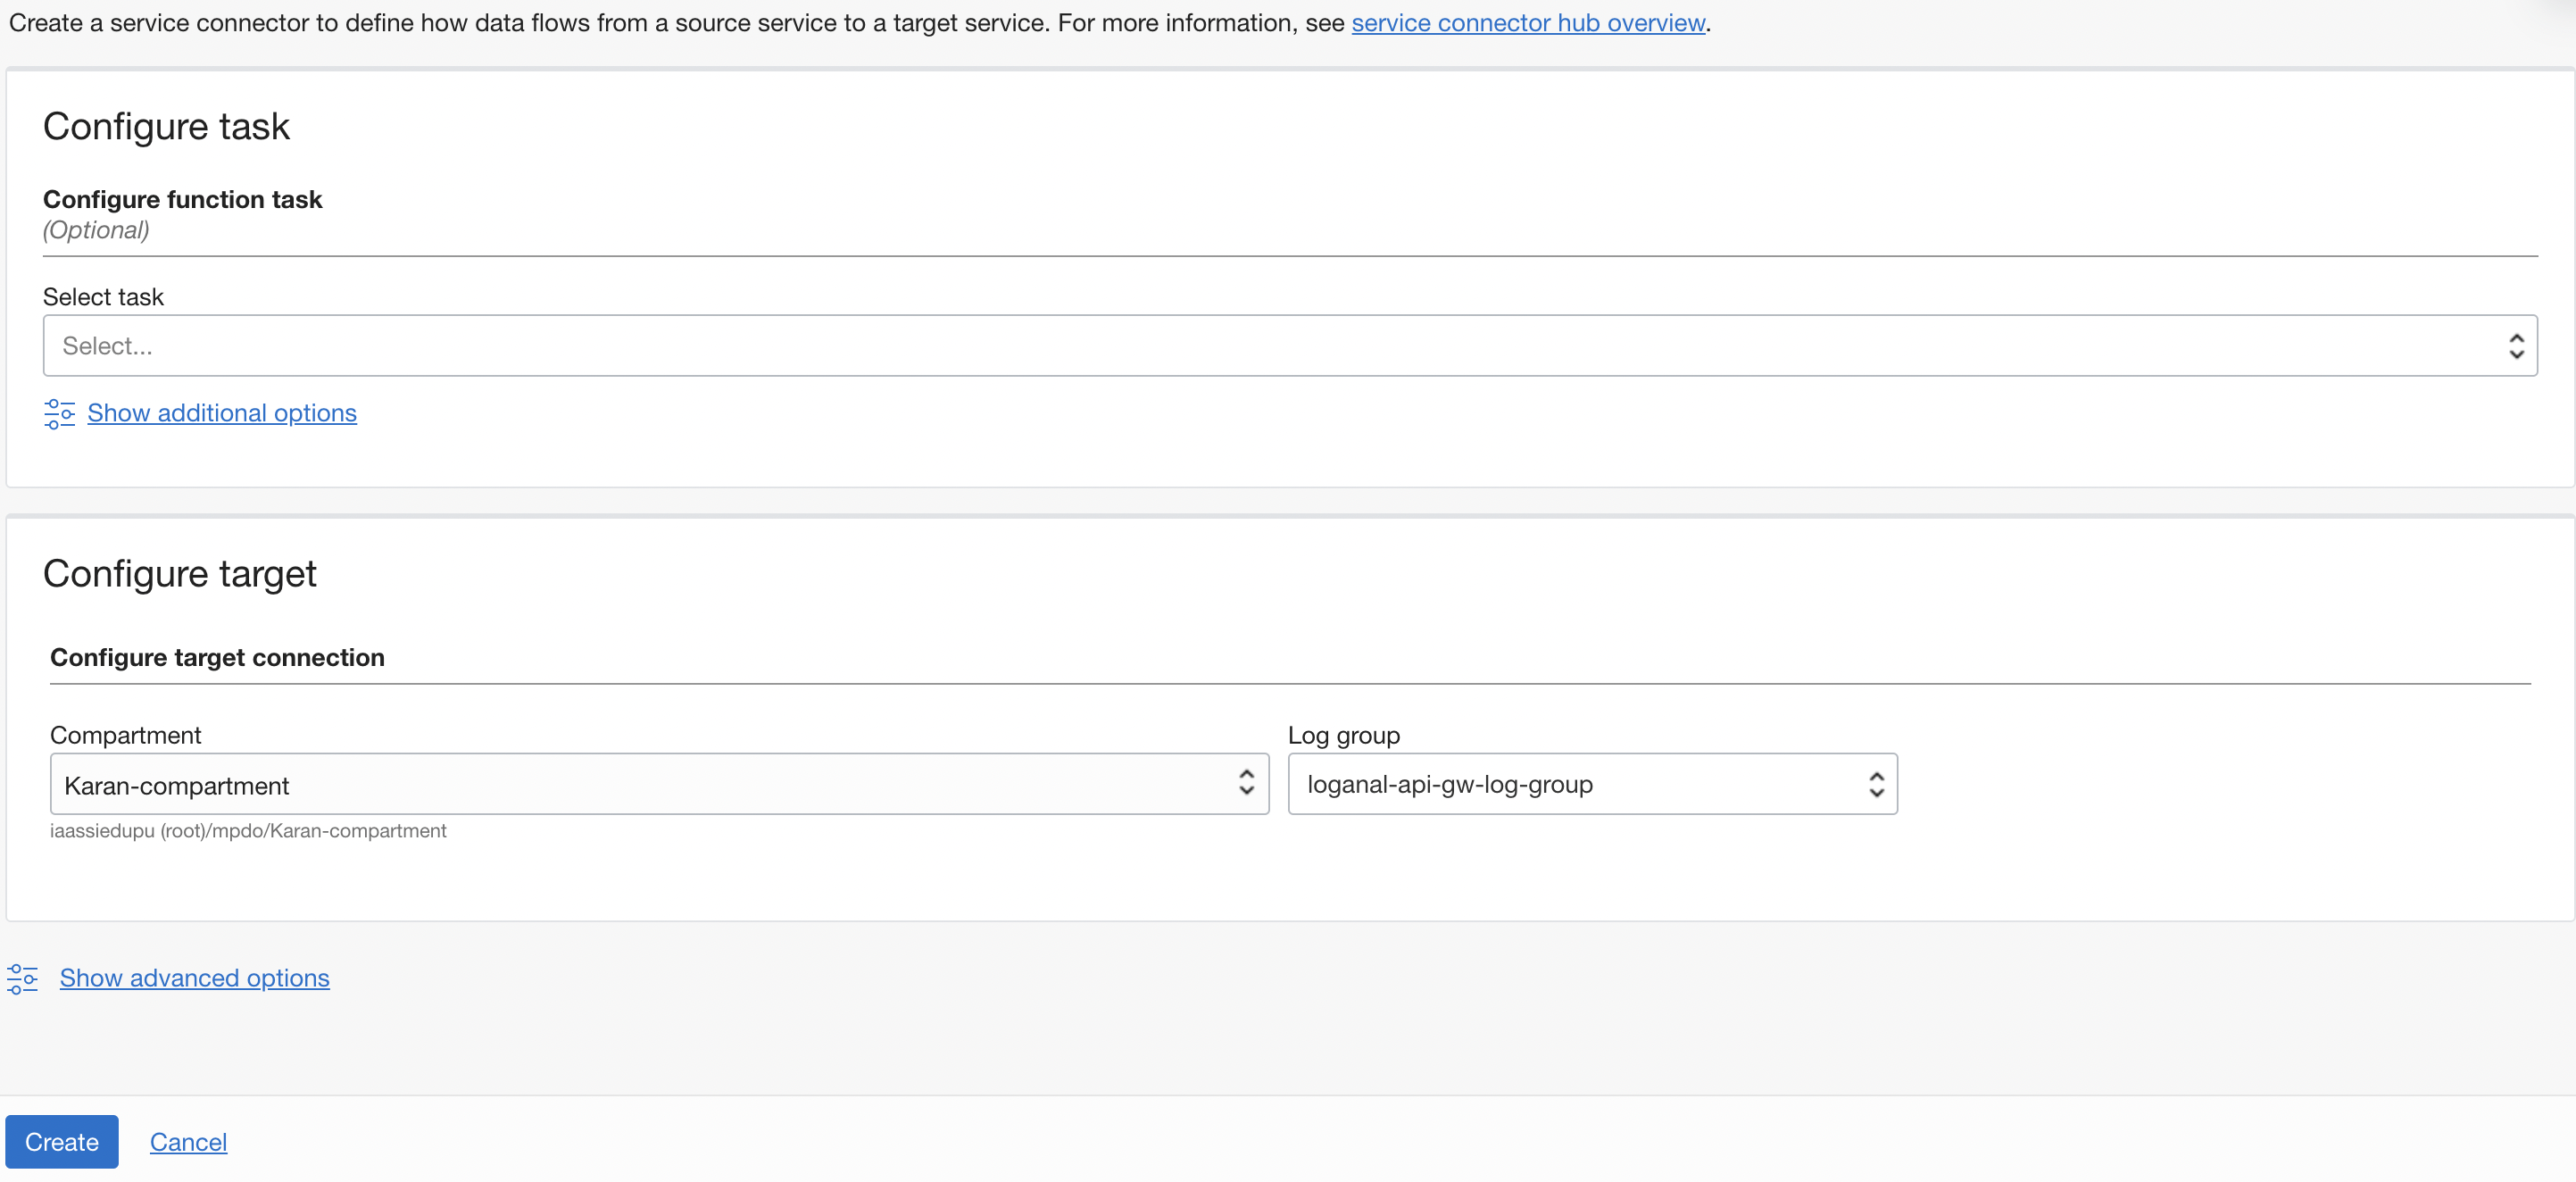
Create a service connector: Under Service Connectors, click Create Service Connector. Provide the source and target information on the screen to create the connector, which copies logs to Log Analytics Log Group. Make the source the log group of API Gateway and the target the log group of Logging Analytics.
-
Create a search query: Before creating the dashboard, we create the queries that provide the data corresponding to our requirement. First, go to Log Analytics and click Log Explorer. Next, select Actions and click Create New. Use the following queries for each of the requirements. Paste the query into the search bar and click Run. The graph and the corresponding data table appear on the bottom part of the page. Then click Actions and click Save. Don’t check the Add to Dashboard option when saving the query; we do that in the last step.
#### How many calls were done by a particular subscriber ’Log Source’ = ’OCI API Gateway Execution Logs’ | stats count( ’Subscriber Id’ as callsMade by ’Subscriber Name’ #### How many violations were captured for a subscriber ’Log Source’ >= ’OCI API Gateway Execution Logs’ and ’Flow Code’ = usageplans.requestrejected | timestats count by ’Subscriber Name’ #### Subscribers using an API * | link ’OPC Request ID’ | stats unique(Path) as Path, unique( ’Subscriber Name’ ) as Subscribers | fields Path | classify correlate = -*, Subscribers ’Start Time’ , Path -
Create a dashboard: When the search queries have been saved, we can create the dashboard. Under Log Analytics, select Dashboard, then click Create Dashboard. Under Widgets, search for the saved queries that we created in the previous step and then drop the widgets onto the side pane. When all the widgets have been added, save the changes.
Similarly, you can create as many search queries as needed and add them to your dashboard.
This example illustrates the deeper insights that API administrators can get when combining API Gateway usage plans logs with Logging Analytics service. Apart from advantages like API monetization, this process can also help understand subscriber and client applications’ API usage behavior, early detection of any unexpected and unplanned usage behaviors, and take corrective actions, as required.
Learn more
To learn more about these features and services, refer to the following resources:
-
For API usage plans, see Defining Usage Plans to Manage Subscriber Access to APIs
-
For Oracle Cloud Infrastructure Logging Analytics, see the launch announcement.
