In the intricate world of cloud security, do you believe traditional rule-based detection methods are enough to combat the constantly evolving cyber threats? For example, take the password spraying threat, where threat actors attempt to gain unauthorized access by systematically trying a few commonly used passwords across numerous accounts. To capture these anomalies, our initial approach involved monitoring for a sudden surge in failed login attempts surpassing a defined threshold. However, the problem had more complications, like what if the actor is a new user or an administrator conducting tests across numerous accounts? So, we tweaked our rule to accommodate these scenarios, but this manual tweaking was very inefficient.
At Oracle Cloud Infrastructure (OCI), to stay ahead in the complex landscape of cloud security, we rewrote the detection threat strategies by integrating machine learning (ML) into Cloud Guard’s arsenal. Cloud Guard stands as a formidable guardian, using ML models to not only react to threats but also predict and preempt them for a transformative security threat detection. Our first ML model within Cloud Guard incorporated data points, such as IP reputation, unfamiliar locations, and lockout event behavior.
Along the way, we spent countless hours debugging why a model wasn’t performing as expected in production environments. What was the trend of our model’s accuracy over time, and what factors were causing it to increase or decrease? While finding answers to these questions, we realized that to truly revolutionize cloud security, we needed more than just cutting-edge technology. We needed a holistic approach to streamline and automate the end-to-end machine learning lifecycle, fueling the birth of our machine learning operations (MLOps). Every step, from model training and deployment to continuous monitoring and optimization, was crucial in our quest to stay one step ahead of the adversaries.
In this blog post, we walk you through the journey of how we unfolded solutions to multiple challenges with building, maintaining, deploying, and monitoring these ML models to transform cloud security with the power of MLOps.
Inception of MLOps within the Cloud Guard ecosystem
Have you ever struggled with monitoring and responding to security threats for thousands of customers? The Cloud Guard threat detection pipeline continuously monitors and responds to security threats in cloud environments. However, as OCI’s customer base expanded, the complexities of monitoring, detecting, and responding to threats necessitated a paradigm shift from conventional methods. We embarked on a journey of developing the ML models to transform security threat detection for our hundreds of thousands of customers.
How are ML models used for threat detection? Imagine that a security analyst is examining a security incident. Typically, the analyst assesses the current behavior of the actor by comparing it to the actor’s historical activities, a process known as individual profiling. The analyst might also compare the actor’s behavior to that of their peers within the organization, known as group profiling. Automating these strategies using ML helped us not only generate results but also provide thoughtful reasoning.
These ML models analyze data to detect anomalies, behaviors, and signatures of threats, assigning risk scores for prioritization. Figure 1 depicts the threat detection pipeline from data ingestion to displaying security problems in the Oracle Cloud Console. By continuously learning from new data and adapting to evolving threats, ML models in Cloud Guard help enhance the platform’s ability to protect cloud environments effectively. Through ensemble methods and predictive analytics, they contribute to a comprehensive security posture, mitigating risks and deploying proactive defense strategies.

Figure 1: Cloud Guard threat detection pipeline
Each ML model is integral to this intricate system and undergoes a multifaceted journey known as the ML model lifecycle. This journey involves stages ranging from initial ideation and data collection to model training, deployment, continuous monitoring, and improvement. The stages are interconnected, and any inefficiencies or challenges in one phase can reverberate throughout the entire system, underscoring the crucial need to streamline the ML model lifecycle when constructing a platform.

Figure 2: ML model life cycle
As we embarked on the ML model development journey, the password spraying detector was the first ML detector that we developed within Cloud Guard to combat the rising threat of unauthorized access attempts. This project commenced with a proposal outlined with the detection’s objectives, potential datasets, proposed ML models, and results from proof-of-concept (PoC) work. This set the stage for an inclusive discussion involving project managers, data scientists, and engineers to evaluate the proposal’s feasibility.
After the proposal was approved, we transitioned from the ideation to the data processing phase. We chose an OCI Audit log as the main data source because it included login activities and associated IP addresses, which are useful for us to extract features, such as successful and failed login attempts, IP address reputation, and geolocation. Creating feature profiles for each user became a pivotal prerequisite for the subsequent modeling phase.
As we delved into model development, scalability emerged as a critical consideration. Our data scientists proposed principal component analysis (PCA) to capture anomalies by comparing the reconstruction error of each data point. Points that have higher reconstruction errors are considered potential outliers or anomalies. However, running this model was computationally expensive and memory-intensive, making it challenging to apply to very large datasets that might not fit into memory. We discussed with the data scientists and explored alternatives, and finally, we discovered incremental PCA (IPCA), an extension of PCA designed to handle large datasets by processing data in smaller batches, offering scalability without compromising computational efficiency.
Moving beyond the development phase, we validated our models against real-world scenarios by incorporating metrics. Our metrics usually include data volume, process latency, detection rates, false positives, and so on. After we checked off all these metrics, we moved to the deployment process. Recognizing the dynamic nature of production data, which can lead to model degradation and diminished customer satisfaction, we introduced an experimental mode, which is explained in the section, “Empowering ML model deployment.”
As engineers, we understood deployment phase is not the endpoint but the beginning of optimization. The post-deployment evaluation was of great significance because it allowed us to truly grasp the impact of our password spraying detectors in the real-world environment. Throughout this journey, we’ve been actively involved in the continuous monitoring of detection performance, constantly refining and adapting our password spraying detector based on valuable insights derived from customer feedback and emerging use cases.
During our journey of developing advanced ML models for threat detection at a faster pace, we faced challenges in deploying and maintaining these models, and in ensuring that they were efficient with the varying nature of data. Unlike traditional software, deploying and maintaining ML models entails complexities, including potential degradation over time, and requires continuous monitoring and tuning of the model. Consequently, our time to market expanded as we used to spend more and more time fine-tuning our ML models.
To address these challenges comprehensively, we started working on streamlining our ML model lifecycle, thus initiating our journey in MLOps.
The challenges of MLOps: Navigating the unknown
Throughout our MLOps expedition, we encountered critical challenges, such as model degradation, processing latency, and lack of out-of-the-box tools for scalable feature engineering and threat modelling. We cover all these challenges in this post, but first, let’s see how we circumvented environmental inconsistencies while deploying the models to production environments.
Empowering ML model deployment
Typically, the ML model we construct undergoes various development and test environments before being deployed into our production environment. We always test the models using various test data and create similar environments as that of our production environment.
Despite our rigorous testing protocols, the production phase unfailingly unveiled an array of issues, ranging from environmental inconsistencies and dependency management complexities to data integration challenges, and scalability concerns. Model degradation in the production environment resulted in false positives in threat detection.
The first step in debugging these issues was understanding the substantial impact of these models, and most of the time the root cause was identified as the change in the data. This need for a solution that not only addressed the complexities, but also provided a safety net against potential disruptions was imperative. In response to the identified challenges, we conceptualized and implemented what we now refer to as experimental mode. This innovative approach involves deploying a new ML model into our production environment while keeping its operations discreet. The primary objective is clear: To allow the model to perform its designated tasks seamlessly with the inherent capability to disable itself if any unforeseen issues arise.
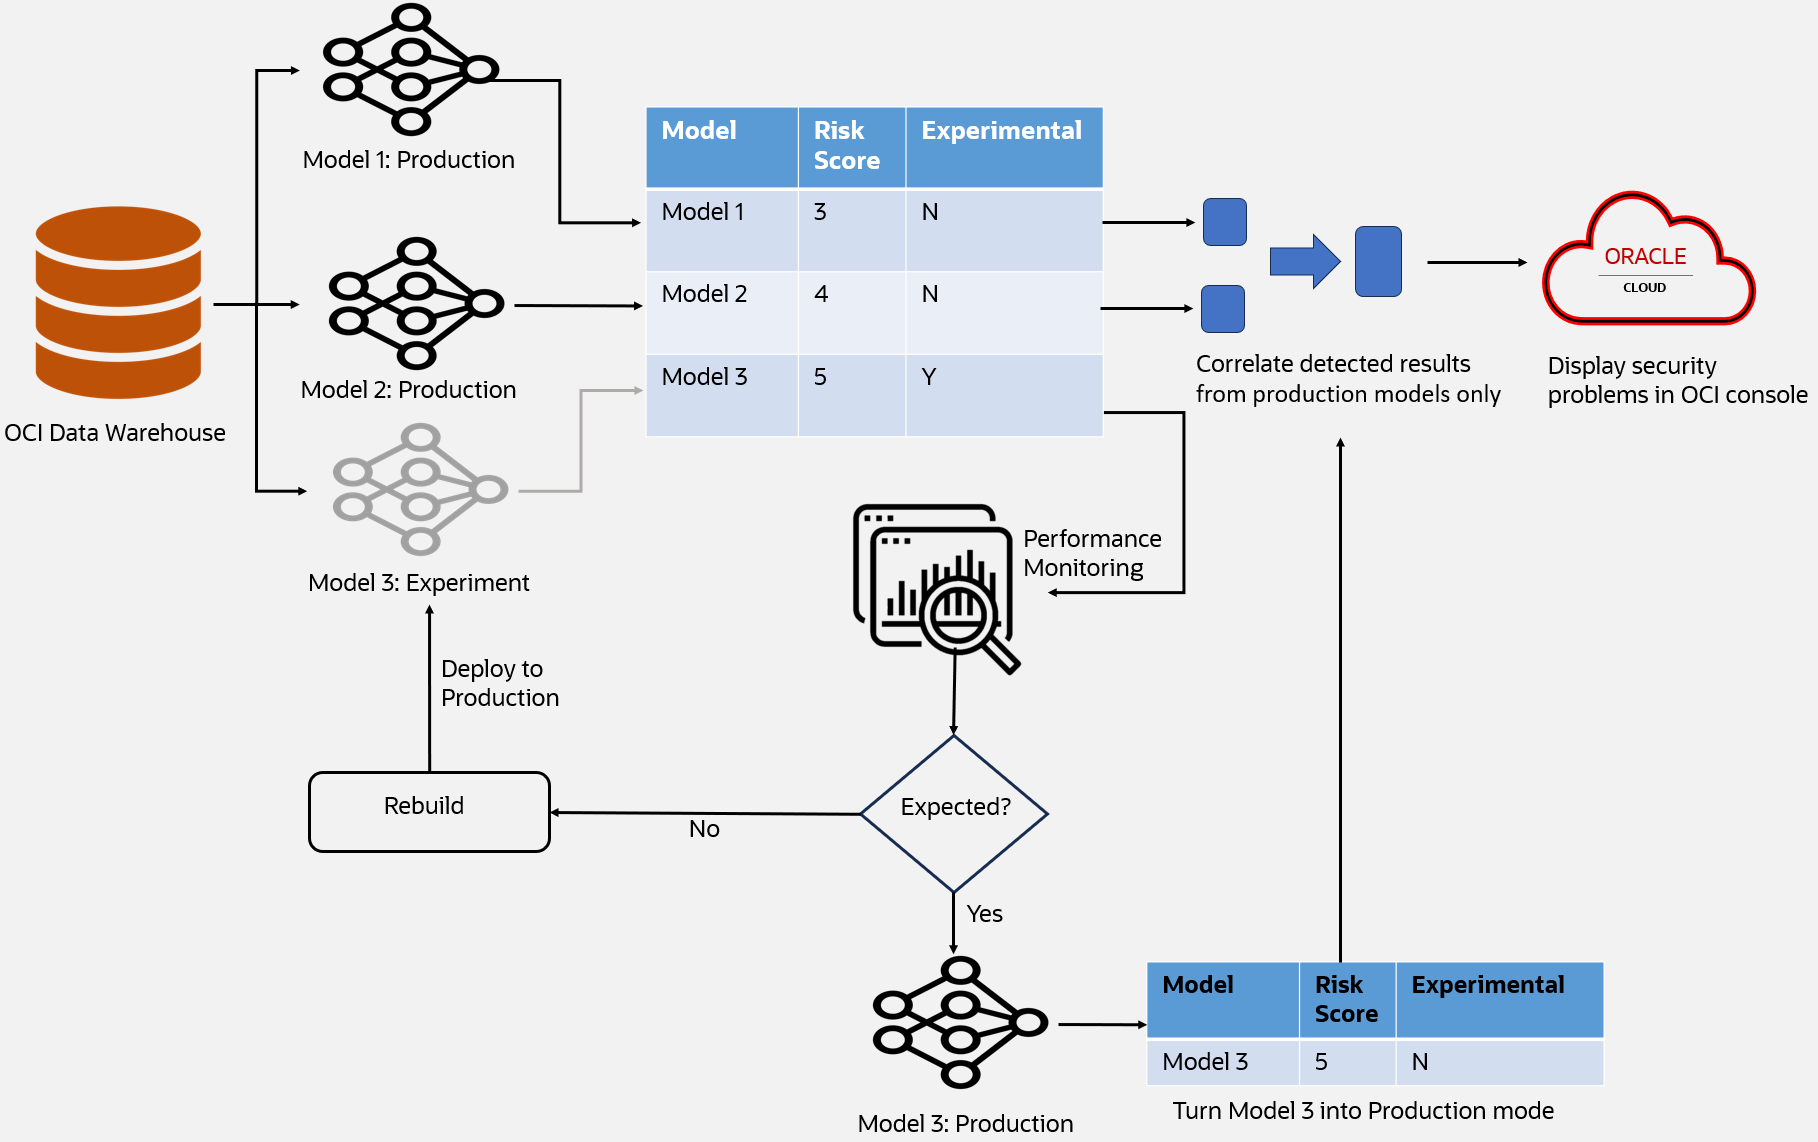
Figure 3: Experimental model illustration
How does the experimental mode work? Figure 3 illustrates the threat detection pipeline by integrating three ML models. ML models 1 and 2 are designated as production models, while ML model 3 operates in experimental mode). Initially, we incorporate experimental models into the model training and inference process without segregating them from production models. This method allows us to obtain results generated by these models trained on the most recent production data.
As depicted in Figure 3, model 3 is treated as same as the other two models. The key distinction is that when we create a security problem by correlating all alerts from different models, results emitted from experimental models (model 3 in this example) are excluded. To accomplish this goal, we introduced a flag called “experimental” to indicate whether a result originates from an experimental mode or not. For this reason, model 3 is marked as “Y” in the Experimental column. Consequently, the final security problem reported to customers remains unaffected by the presence of these experimental models.
In the meantime, data scientists can access these results and continuously monitor their performance against predefined metrics. Typically, an experimental model undergoes a minimum incubation period of one month and is deployed only if it consistently demonstrates satisfactory performance. Subsequently, we switch the experimental-mode flag to false, making the model a fully-fledged production model. At the bottom of Figure 3, model 3 has been turned into a production model with the experimental flag switched from Y to N. In the future, all three models will use security detection to produce security findings for customers.
Experimental model allowed us to deploy various models at the same time and gauge their performance. We then select, deprecate, or retune the model based on their performance. Introducing experimental mode in our production deployment pipeline helped us in streamlining the deployment process, faster deployment cycle, better model predictability and most importantly enhanced deployment flexibility, allowing us to try out different models with varying degrees of risk.
With ML model deployment now streamlined, let’s turn our attention to the challenges encountered, while monitoring the performance of these models to ensure sustained excellence.
Monitoring the model performance
In the early stages, our approach to monitoring ML models closely resembled that of many other platforms. We diligently tracked time-series metrics at each step of the extract, transform, load (ETL) process, encompassing key indicators such as data ingestion volume, processing latencies, and job failures. However, as our data volumes and algorithmic complexities continued to grow, a new challenge emerged: Micro data quality issues.
These nuanced problems didn’t manifest consistently but occurred sporadically in specific corner-case scenarios. Despite their infrequency, their impact on model performance was profound. This phenomenon is a common challenge in the realm of machine learning, where even minor alterations in the feature vector can lead to a noticeable decline in model quality.
Recognizing the critical importance of addressing these micro data quality issues, we decided to take an innovative approach. Our solution involved the introduction of high-dimensional metrics into our monitoring framework. This process meant incorporating specialized data monitoring jobs designed to meticulously examine the variance and deviation of various data sources and their associated feature vectors.
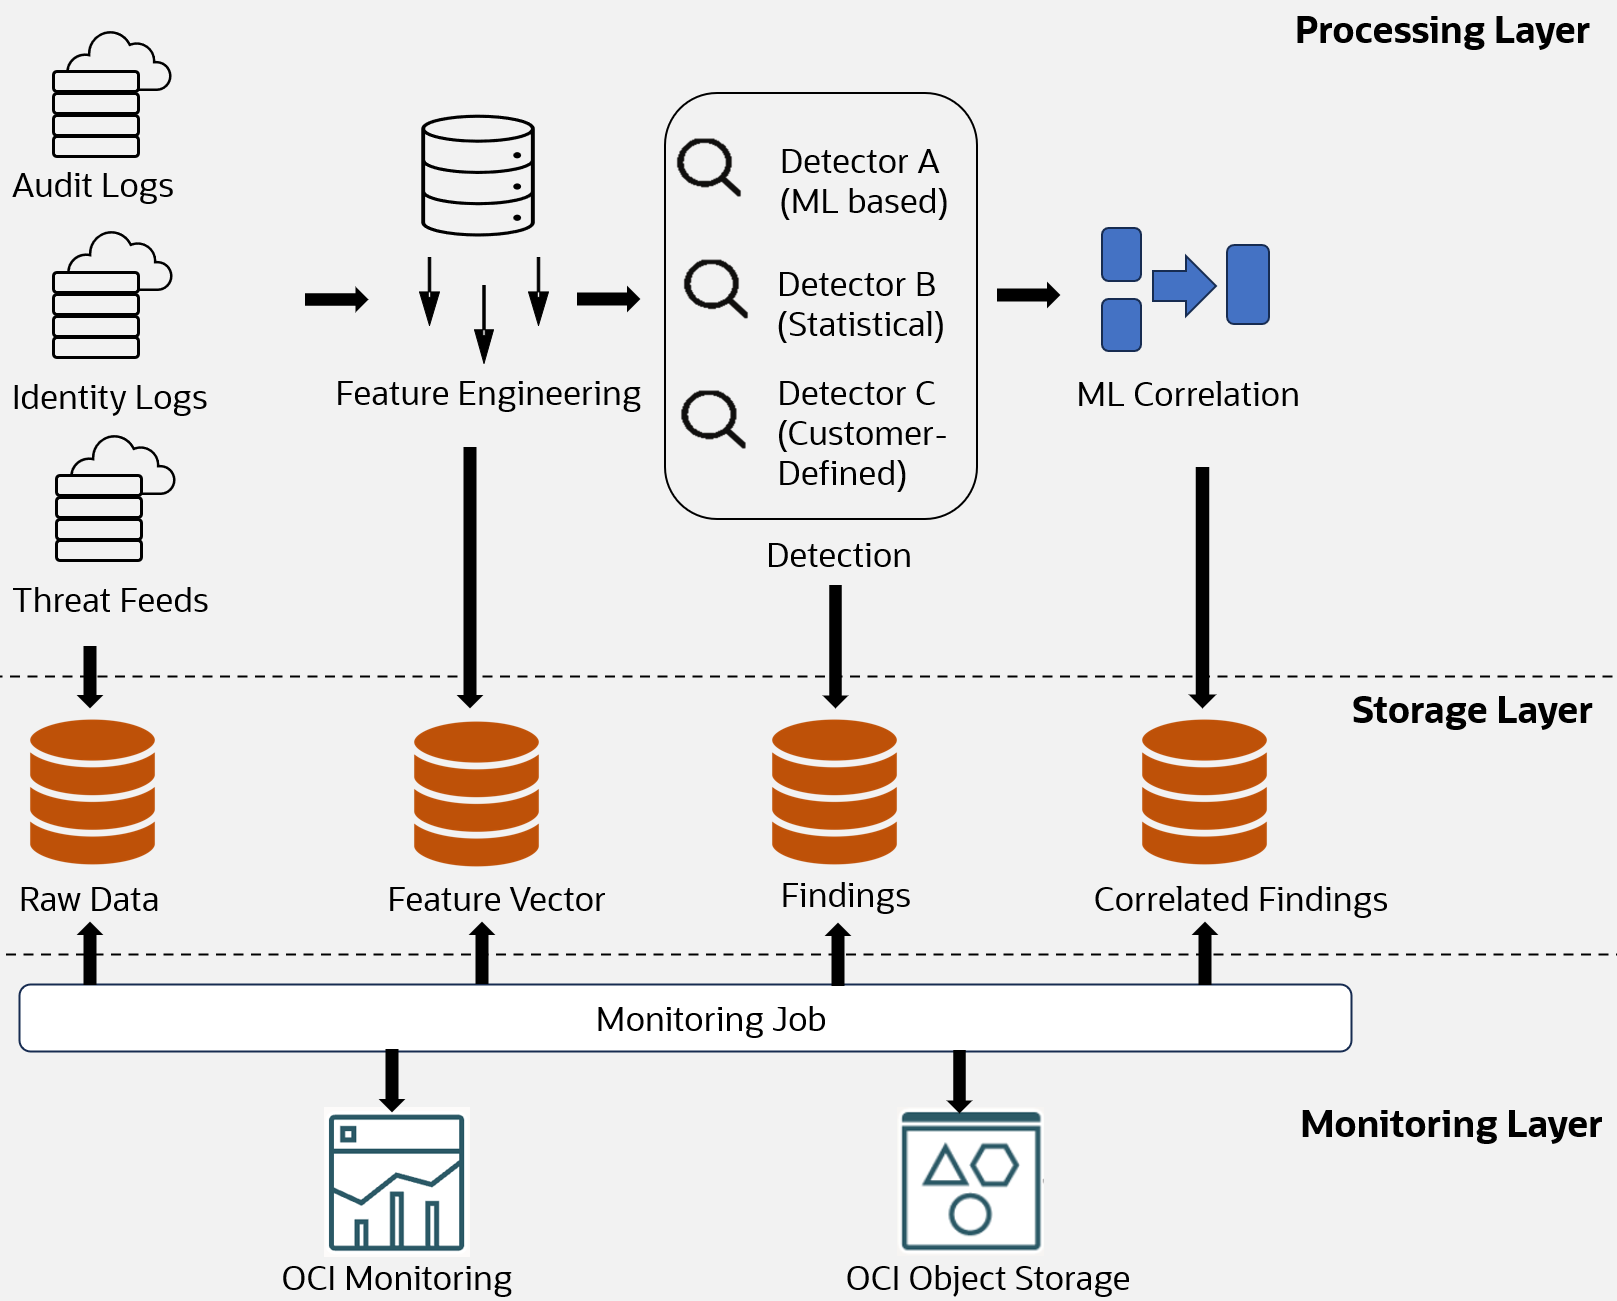
Figure 4: Monitoring pipeline
As displayed in Figure 4, to detect these micro data quality issues sooner, we implemented a new monitoring job. This job scrutinizes various datasets, including raw data, feature vectors, findings from different detectors, and correlated results from correlation jobs. It continuously monitors their variances and publishes the results to the OCI monitoring service and OCI Object Storage bucket for further analysis. The monitoring job is also responsible for performing quality checks on the data and generating high-dimensional metrics which gives a clear understanding for data scientists on the variance of data. For example, examining a 3D scatter plot enables data scientists to gain a deeper understanding of how the data distribution changes over time.
Figure 5 shows a significant drift of the three features (standardized resource usage, requests, login duration) from last week to this week. This observed data drift might be the root cause of the observed degradation in model performance.
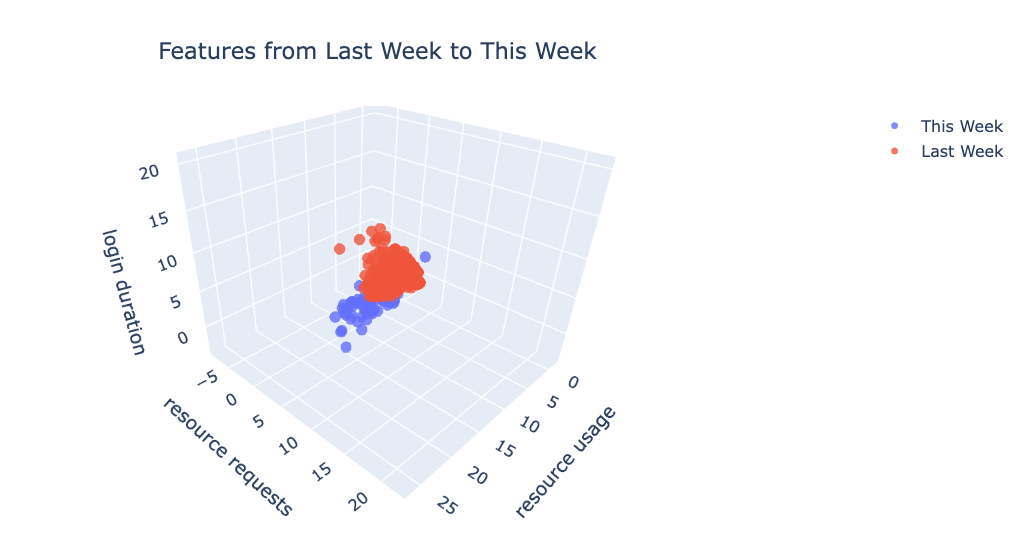
Figure 5: Scatter plot visualizing data drift
These high-dimensional metrics opened new avenues for our data scientists. Armed with a deeper understanding of the intricate patterns within feature vectors, our data scientists were empowered to fine-tune parameters and optimize models with a level of precision previously unattainable. To ensure the sustained excellence of our machine learning models, our data scientists proactively monitor the reports generated from these high-dimensional metrics. These reports, automatically generated and uploaded to OCI Object Storage on a weekly basis, provided a consistent, vigilant oversight to detect any potential degradation in model performance over time.
As part of our commitment to comprehensive monitoring, Cloud Guard uses the OCI Monitoring service. This not only includes the establishment of alarms but also harnesses the power of the sophisticated monitoring query language (MQL) for visualizing time-series metrics. This integrated approach not only tackled the challenges posed by the evolving nature of data and algorithmic complexity but elevated our ML model monitoring to a new standard of excellence. It’s a testament to our commitment to innovation and continuous improvement in the dynamic landscape of machine learning.
While we try to capture model degradation using various metrics and monitoring tools mentioned above, model degradation is always possible because of the change in the nature of data in the real world.
Enhancing model performance
User feedback is a treasure trove of insights waiting to be unearthed. Whether you’re developing recommendation engines, chatbots, predictive analytics, or any other machine learning application, your user’s experiences and interactions provide a wealth of information about the strengths and weaknesses of your models.
We build our security detection model using historical data and with assumptions about how they will perform in the real-world scenarios. Because the dynamic nature of data keeps changing often, especially when we’re dealing with hundreds of thousands of users, we started witnessing some false positive detection and that started adding a lot of noise to real detections.
The nature of data also varies with each user, influenced by the scale of their data and specific use cases. So, it became crucial for us to comprehend the unique data characteristics for each customer and feed that insight into our ML model. In response to this challenge, we implemented a user feedback mechanism to gather insights related to security incidents from customers.

Figure 6: Customer feedback loop
Now, let’s delve into the details of one of our released detectors, called impossible travel. This detector is designed to flag an account when credentials are used to access the account too quickly from two separate geographic locations, implying illegitimate use. We received some feedback from users saying they didn’t know why their activities triggered this detector because they made API calls only from a single location. Through our investigation, we found out that the credentials were used with a VPN that was reporting from different locations. To resolve the issue, we enriched our data with a geo feed to source the actual location instead of the VPN location. Without such valuable user feedback, identifying and resolving such exceptional scenarios would be a significant challenge for us.
Figure 6 illustrates the functioning of our feedback mechanism work. When a threat detector detects any security incident, it is then displayed on Cloud Guard console as a problem to our users. Users then can provide the feedback for an individual problem and this feedback will be passed on to all detectors applicable to that user tenancy. This way users don’t have to explicitly provide the same feedback for each problem.
Conclusion
Our journey through the realm of machine learning operations (MLOps) within Oracle Cloud Infrastructure (OCI) Cloud Guard ecosystem has been illuminating. From the inception of Cloud Guard as a defender of cloud environments to its evolution into an ML-powered guardian, our exploration has unveiled the complexities and challenges inherent in MLOps.
These are the key takeaways:
- Traditional rule-based detection methods are insufficient in combating the evolving cyber threats faced by cloud environments, particularly when dealing with large-scale customer bases.
- The development of ML models within Cloud Guard involved intricate steps, from initial ideation and data collection to model training, deployment, continuous monitoring, and improvement.
- As businesses increasingly rely on machine learning to fortify their competitive edge, the imperative to streamline the ML lifecycle becomes ever more pressing.
- Challenges, such as environmental inconsistencies during model deployment, processing latency, and micro data quality issues, were addressed through innovative solutions like the experimental mode for seamless model deployment and high-dimensional metrics monitoring.
- When dealing with the variety of data for hundreds of thousands of users, one solution doesn’t fit all, and using user feedback enabled us to refine and optimize our detection models, ensuring accuracy and relevance in threat identification.
- Our MLOps journey reflects a commitment to continuous improvement and innovation in cloud security, working toward sustained excellence in threat detection and mitigation.
As you embark on your own journey in the realm of MLOps, remember that success isn’t just about the destination, but the continuous evolution and improvement of your machine learning practices.
This blog series highlights the new projects, challenges, and problem-solving that OCI engineers are facing in the journey to deliver superior cloud products. You can find similar OCI engineering deep-dives as part of Behind the Scenes with OCI Engineering series, featuring talented engineers working across Oracle Cloud Infrastructure.
For more information, see the following resources:
- More on MLOps strategy: Getting machine learning models to production and beyond with MLOps on OCI
- More on MLOps strategy: Extending SaaS by AI/ML features – Part 7: Enabling MLOps using OCI Data Science Pipelines