
Customers who pay much higher rate to process DNA samples can substantially reduce its cloud computing cost by adopting Oracle Cloud’s cost-performance sweet spot configurations and Sentieon DNAseq®.
The latest Advanced RISC Machine (ARM) processors are said to be faster and more economical than x86, but exactly how fast and economical? Where’s the optimal cost-performance sweet spot? Typical bioinformatics and high-performance computing (HPC) researchers don’t have time or experience to systematically benchmark their own applications on all available CPU processors or calculate analysis cost on of the public cloud.
This blog fills these gaps with a systematic job runtime benchmark and cloud cost estimate using the popular award-winning life sciences HPC application, Sentieon DNAseq, on the latest ARM and x86 instances offered by Oracle Cloud Infrastructure (OCI).
Genomic sequence analysis is an important component in most segments of the life sciences and healthcare industries and is key for numerous technology breakthroughs including the latest Covid-19 vaccines. Among several popular genomics sequence analysis applications, Sentieon DNAseq distinguishes itself as a drop-in replacement of the gold standard BWA-GATK pipeline. This professionally developed software not only provides identical results to BWA-GATK, but is also easy to set up and runs 5–20 times faster than GATK. For these reasons, we selected the latest Sentieon DNAseq v202112.01 release for this benchmark exercise. To learn more about Sentieon and its feature comparison to other analysis software, see Sentieon’s product page.
Treat the computing cost quoted in this report as a rough estimate of the minimum cost of cloud resource for WGS analysis with Sentieon DNAseq. The complete process for WGS analysis can include other actions, such as setting up job execution scripts, uploading input data sets, and downloading output files. The cost of cloud to go through these steps is shared by all the analysis jobs performed on the instance but was not included in the estimated cost in Table 2. The cost for other cloud resources, such as FastConnect networking and object storage, required for production cloud computing operation were not included, and the cost of Sentieon DNAseq license wasn’t included either.
Benchmarked OCI instance shapes
This benchmark work covered the latest CPU processors commonly provided by public cloud. Table 1 summarizes the OCI instance shape and CPU processor specifications.
|
|
Processor |
OCI instance shape |
Processor specification |
Max # of OCPU/vCPU in VM shape |
Processor clock rate (MHz) |
| 1 |
Intel |
VM.Standardard3.flex |
Xeon(R) Platinum 8358 (Ice Lake) |
32/64 |
2660 |
| 2 |
AMD |
VM.Starndard.E4.flex |
AMD EPYC 7J13 (Milan) |
64/128 |
2445 |
| 3 |
ARM |
VM.Standard.A1.flex |
Ampere Altra A1 |
80/80 |
3000 |
We selected Oracle Cloud’s virtual machine (VM) shapes for this work because they can be flexibly configured with CPU core count and amount of memory, allowing you to customize resource usage to your application. In contrast, bare metal shapes are designed for resource-hungry workloads. The genomic analysis studied here have lower resource requirements, so we excluded bare metal shapes in this study because they’re unlikely to provide an optimal cost-performance configuration
Benchmarked test cases
The whole genome sequencing (WGS) secondary analysis pipeline implemented by Sentieon DNAseq matches the industry-standard BWA-GATK best practices pipeline. We benchmarked and analyzed seven sets of WGS data in this exercise and found all data sets demonstrated similar runtime and cost characteristics. For simplicity, this blog focuses on two data sets: 30X HG002 PCR-free samples sequenced on Illumina’s HiSeq X and NovaSeq systems. To learn more about the data sets, see this abstract.
We used GRCh38 as the reference, including the GRCh38 primary contigs and other decoy contigs, without ALT contigs or HLA genes. GRCh38 has significant improvements compared to the previous generation GRCh37 and is commonly adopted by the human genetics community. For the review of the recommendation of this reference, see Which human reference genome to use?
The benchmarked pipeline takes FASTQ files as input and produces VCF files as output, including alignment, sort, deduplication, BQSR, and variant calling.
Benchmarked results
| Processor shape size |
vCORE/Mem(GB) /Storage(GB) |
Instance cost ($ USD) |
Boot volume cost ($ USD) |
Total cost ($ USD) |
NovaSeq runtime (hours) |
NovaSeq total cost ($ USD) |
Hiseqx runtime (hours) |
Hiseqx total cost ($ USD) |
| Intel-M |
64/48/500 |
1.352 |
0.01713 |
1.369 |
1.7 |
2.327 |
1.88 |
2.574 |
| Intel-L |
64/64/1000 |
1.376 |
0.0457 |
1.422 |
1.49 |
2.119 |
1.5 |
2.133 |
| Intel-X |
64/128/1000 |
1.472 |
0.0457 |
1.518 |
1.46 |
2.216 |
1.52 |
2.307 |
| AMD-S |
64/48/500 |
0.872 |
0.01713 |
0.889 |
1.46 |
1.298 |
1.68 |
1.494 |
| AMD-M |
64/64/1000 |
0.896 |
0.0457 |
0.942 |
1.19 |
1.121 |
1.27 |
1.196 |
| AMD-L |
128/64/1000 |
1.696 |
0.0457 |
1.742 |
0.8 |
1.394 |
0.97 |
1.69 |
| AMD-X |
128/128/1000 |
1.792 |
0.0457 |
1.838 |
0.752 |
1.382 |
0.88 |
1.617 |
| ARM-S |
40/40/500 |
0.3834 |
0.01713 |
0.401 |
2.25 |
0.902 |
2.42 |
0.97 |
| ARM-M |
48/48/1000 |
0.4754 |
0.0457 |
0.521 |
1.83 |
0.953 |
1.85 |
0.964 |
| ARM-L |
80/80/1000 |
0.8434 |
0.064 |
0.907 |
1.06 |
0.961 |
1.09 |
0.99 |
| ARM-X |
80/128/1000 |
0.9154 |
0.064 |
0.979 |
1.03 |
1.008 |
1.05 |
1.03 |
Hourly cost data was obtained from the OCI product cost estimator. An extra $0.0171 or $0.0457 was added to reflect the hourly cost of 500-GB or 1000-GB storage subsystem. Here, we used a balanced block volume (VPU: 10) with IOPS target of 25,000 and throughput target of 240 MB/s or 480MB/s.
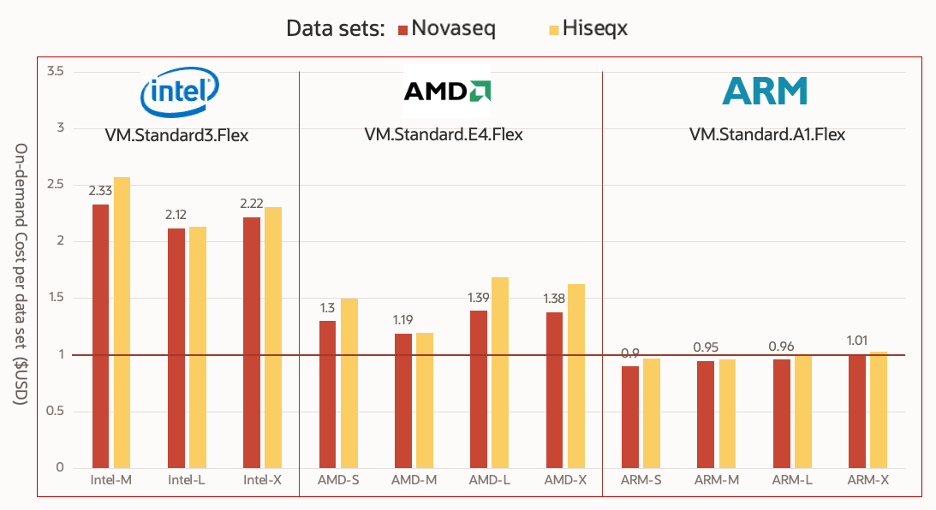
Figure 1. On-demand compute cost of cloud computing resource per data sample
Cost performance sweet spot
The on-demand cost of cloud computing resource versus analysis job runtime is plotted in Figure 2. You can identify the sweet spot for optimal cost-performance and the spots for the lowest cost and shortest runtime.
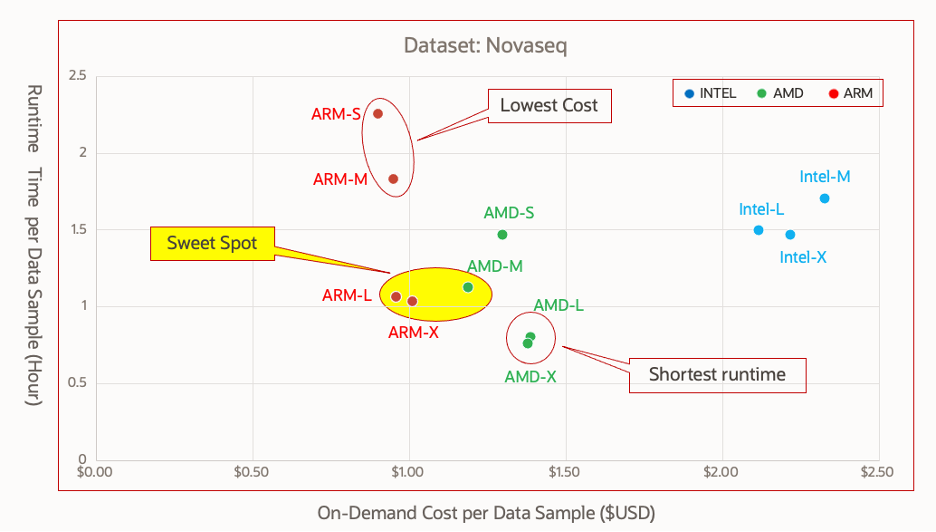
Figure 2. Sentieon DNAseq genomic analysis job runtime versus on-demand cost per sample
Figure 2 shows that AMD-M (64-core) and ARM-L/X (80-core) can finish the analysis in about one hour with cost at or less than $1. So, these examples are the optimal configuration sweet spots for this type of workload. Configured with the same number of vCPU cores, both Intel and AMD shapes delivered same level of job run speed. Intel shape is limited by the maximum numbers of vCPU cores available (64 for VM.Standard3.Flex) compared to AMD (128) or ARM (80) shapes, and Intel instances also have a higher price per vCPU. Benchmarks using the HiSeq X dataset demonstrated similar cost-performance characteristics as demonstrated in Figure 2.
Stay tuned for our next blog, which focuses on the unique RDMA network capability provided only by OCI’s Intel shapes and the benefit to applications such as Sentieon DNAseq, which can run parallel jobs across multiple instances.
Deliver optimal cloud economy to customers
The OCI sweet spot configurations ensured optimal computing resource utilization and delivered optimal cloud economy to customers. Figure 3 shows the job performance metrics captured by OCI control panel during a typical benchmark run on a VM.Standard.A1.Flex instance.
Sentieon DNAseq achieved nearly 100% CPU utilization, except when the system was handling heavy IO. This result is consistent with our expectation that alignment and haplotype variant calling are CPU-intensive stages, while sorting and deduplication is IO-intensive. Memory utilization was up to 90%, while the peak disk read bytes and write bytes were up to target limit of 240 MB/s during the most IO-intensive stage. We also observed narrower I/O peaks, or shorter runtime during IO-intensive stage, when we increased disk size from 500 GB to 1,000 GB, with I/O performance target increased from 240 MB/s to 480 MB/s. In many test cases, this increase reduced the total runtime by about 5–8 minutes.
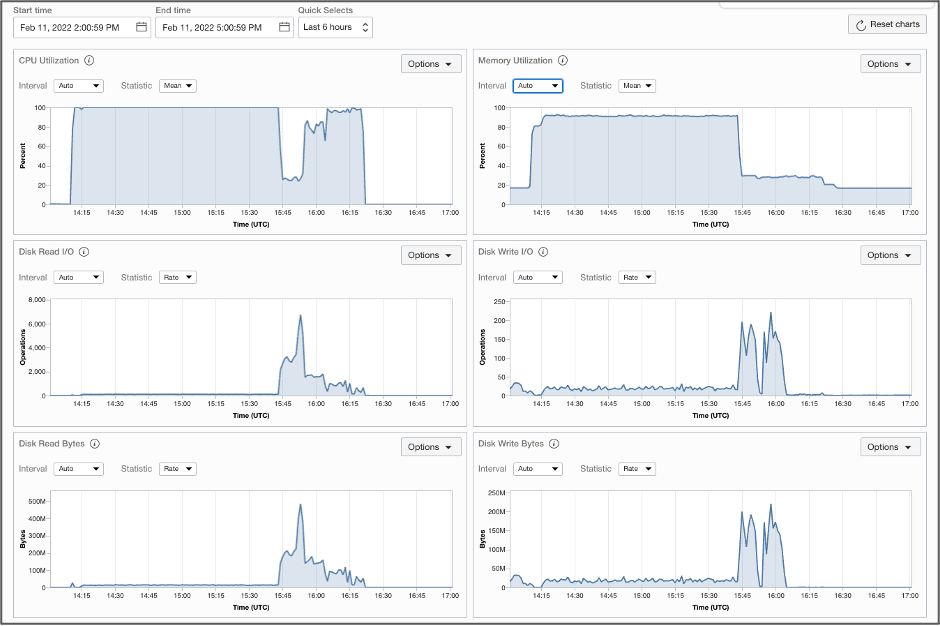
Figure 3. Performance metrics from aVM.Standard.A1.Flex (OCPU=40) during benchmark runs.
Discussion
CPU performance
To further improve runtime, Sentieon DNAseq can utilize more vCPUs by running on multiple instances in parallel. While this metric is beyond the scope of this study, which focuses on testing single VM configuration with latest CPU processors, our next blog focuses on parallel job runs across multiple instances, and we plan to return to benchmark Sentieon DNAseq’s capability in this area.
In our observation, the job run time on x86 benefited from hyperthreading. Although ARM processors don’t support hyperthreading, they delivered competitive performance against x86 processors.
Memory performance
Sentieon DNAseq is also efficient in memory management. All stages except for alignment use less than 10 GB of memory. This expansion allows for efficient handling of much larger dataset without resorting to much more expensive instance shapes. The alignment stage benefits slightly from higher memory, but it reaches diminishing return at 128-GB memory with Model X.
I/O performance
To accurately represent production analysis use cases and to best evaluate the I/O capability of the benchmarked instance shapes, we included all key output files commonly required by WGS analysis, resulting in about 90-GB result files for NovaSeq samples and 120 GB for HiSeq X samples. All instances used in this study have a single boot volume as the storage subsystem. We observed I/O speed improvement when the boot volume size (and corresponding throughput performance target) was increase from 500 GB (240 MB/s) to 1,000 GB (480 MB/s).
Throughput and scalability
If we define the throughput of a Compute instance as the number of 30X whole genome processed per day, then the throughput = 24/(runtime hours needed to process a single 30X dataset).
Figure 4 plots the throughput against the number of vCPUs for the benchmarked instance shapes. The AMD-X shape can process 32 30X dataset each day, while the ARM-S shape can only process 10 datasets during the same period.
This figure also demonstrates the runtime scalability of Sentieon DNAseq analysis on OCI. The throughput scales proportionally to the number of vCPU cores, demonstrating that different VM shapes of different CPU architectures on OCI Cloud have delivered optimal speed performance, and the Sentieon DNAseq maximally utilizes available computing resources.
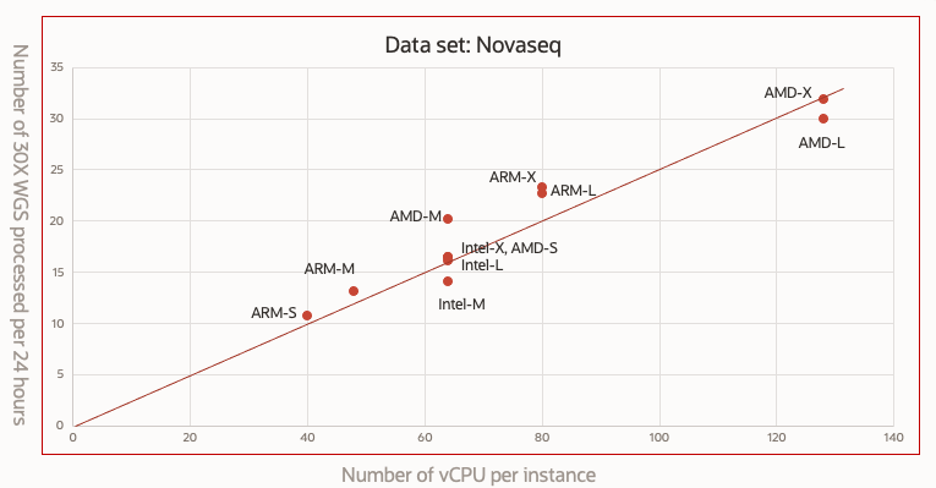
Figure 4. Number of 30X WGS processed per day versus number of VCPUs
Conclusion
This benchmark exercise provided us with the following insights:
-
The latest ARM instance shapes provided by OCI are more than capable of handling heavy HPC workloads, such as the whole genome sequencing (WGS) analysis, which is known to be computationally intensive and memory- and I/O-hungry. As demonstrated in the scalability graph, an ARM VM can deliver similar runtime performance as the latest x86 VMs without the need for hyperthreading. With ARM’s strong computational speed and lower cost, ARM instance on OCI delivered a near-one-hour job turnaround time with lowest cost directly to end users with on-demand less than $1 per 30X WGS data sample for FASTQ-to-VCF.
-
The OCI flexible shapes enable end users to customize computing nodes to best match their workload. As a result, we created VM nodes with enough memory (48–80 GB) for this workload, substantially reducing costs. This reduction brings savings directly to the life science and healthcare industry, who normally pay more than $10 for similar sample analysis. Workers who routinely process large numbers of samples can benefit the most from our sweet spot configurations.
-
Sentieon DNAseq provides fast analysis speed with identical results to the gold standard BWA-GATK best practices pipeline, with a 5–20-time runtime improvement. Installing and deploying x86 and ARM systems is also easy right out of the box. The simplicity is an indispensable contributor that enabled OCI to reduce the 30X WGS FASTQ-to-VCF on-demand computing cost to below $1 per sample while reducing processing time to nearly one hour.
“Use only what your need, and pay only what you use.” That’s the cloud economy offered only by Oracle Cloud Infrastructure. The cost-performance analysis documented in this report is yet another demonstration of how OCI delivers its promise of lowest price in the public cloud industry.
Try it for yourself
Oracle offers the lowest on-demand cloud pricing in the industry and its single-pricing-for-all-region model is also the simplest among the public cloud vendors. With costs savings like this, don’t hesitate to try it out for yourself. Start your 30-day free trial and get access to a wide range of OCI services for 30 days, including VM.Standard.A1.Flex, VM.Standard3.Flex, VM.Optimized3.Flex, and VM.Standard.E3.Flex. By using this Marketplace tmage, accessible only from within OCI control panel, you can get up and running Sentieon on OCI within minutes.
If you’re an academic researcher looking to use Oracle Cloud Infrastructure for your work, you can get $1,000 in credit toward cloud compute, storage, database, and service offerings by signing up for a Research Cloud Starter Award. For larger research workloads, researchers can also apply for a Research Project Awards from Oracle for Research.
The computing cost quoted in this report should be treated as a rough estimate of minimum cost of cloud resource for WGS analysis with Sentieon DNAseq®. The complete process for WGS analysis may include additional actions such as setting up job execution scripts, uploading input data sets and downloading output files, etc. Cost of cloud to go through these steps would be shared by all the analysis jobs to be performed on the instance but was not included in the estimated cost in Table 2. The cost for other cloud resources (such as FastConnect networking, object storage, for example) required for production cloud computing operation were not included, and the cost of Sentieon DNAseq® license was not included either.