The Oracle Cloud VMware Solution sets up a VMware-based cloud environment within a customer’s tenancy, providing extensive control using familiar VMware tools. Despite its seamless integration with various Oracle Cloud Infrastructure (OCI) services, effectively monitoring and managing the VMware software-defined data center (SDDC) poses challenges that can’t be adequately addressed through OCI’s native observability solution.
While Oracle Cloud VMware Solution is a flexible OCI native service, its inherent observability and management capabilities might not entirely align with the requirements for VMware SDDC monitoring. This issue often prompts the utilization of third-party tools to monitor the Oracle Cloud VMware Solution environment. In the market, numerous third-party solutions cater to monitoring aspects such as capacity, performance, and availability matrices, necessitating the use of separate monitoring tools for different environments hosted in OCI.
This blog post delves into an open source solution for monitoring Oracle Cloud VMware Solution, harnessing the power of Grafana, InfluxDB, and Telegraf. The established setup provides the capability to monitor various matrices from both OCI and Oracle Cloud VMware Solution. However, the primary focus of this post is to intricately detail the monitoring capabilities specifically tailored for Oracle Cloud VMware Solution using Grafana and InfluxDB.
This solution provides robust monitoring capabilities, serving as a compelling alternative to both VMware Aria Operations and other paid solutions in the market. Notably, Aria Operations cannot be independently acquired as an add-on for monitoring usage within Oracle Cloud VMware Solution. This open source alternative not only effectively meets the monitoring needs of the Oracle Cloud VMware Solution environment, but also fulfills the requirements for other OCI workloads.
High-level solution overview
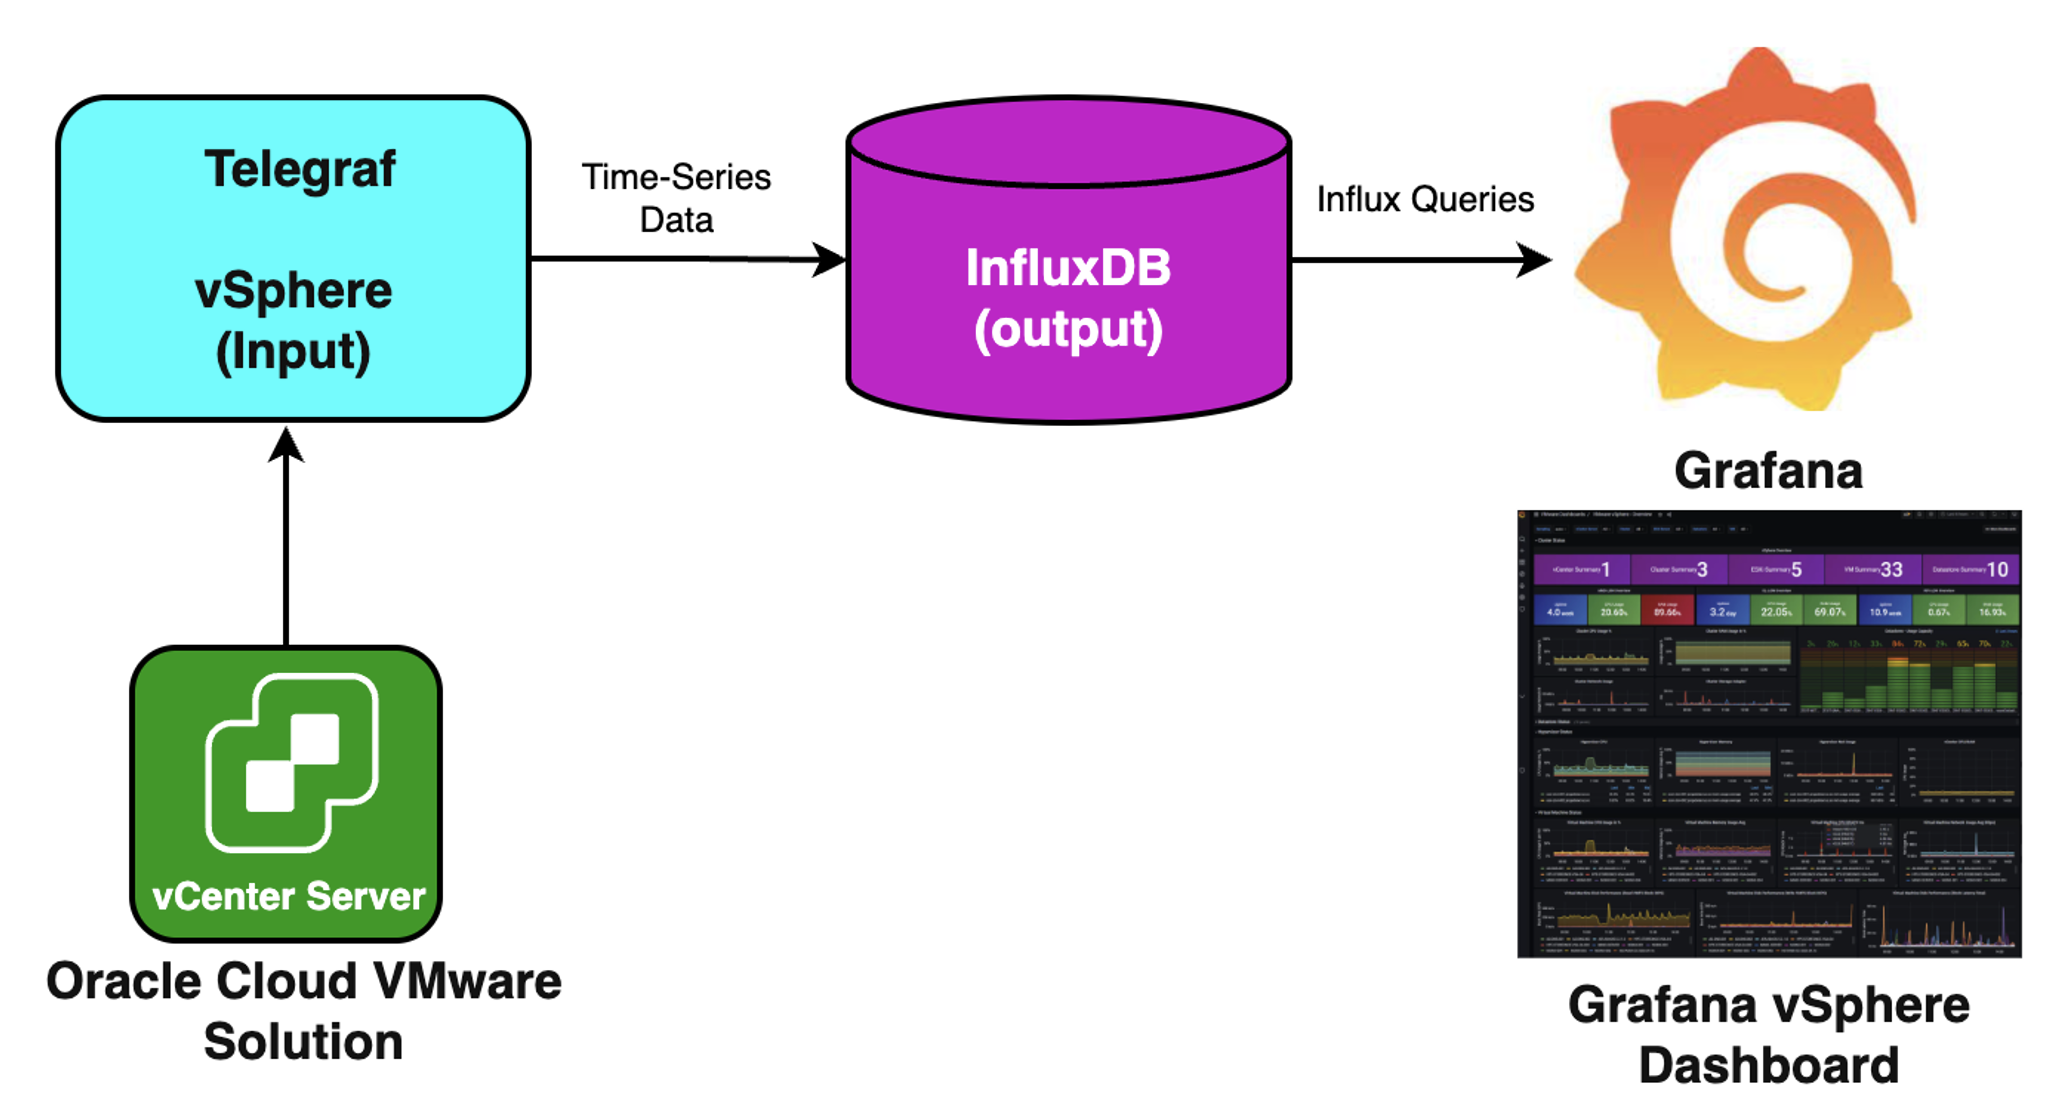
The overarching structure of this solution encompasses the deployment of Oracle Cloud VMware Solution within the customer’s OCI tenancy. Within the Oracle Cloud VMware Solution SDDC, the machines running Grafana, InfluxDB, and Telegraf are strategically deployed. The placement of these virtual machines (VMs) can also be native to OCI, offering a flexible and adaptable configuration.
Now, let’s look at a detailed breakdown of the components involved in this solution.
Oracle Cloud VMware Solution
A native VMware SDDC environment within the customer’s OCI tenancy. To learn more about the Oracle Cloud VMware Solution, refer to the reference section.
Grafana
Grafana stands as a versatile open source analytics and interactive visualization web application, operating seamlessly across multiple platforms. When linked to supported data sources, it empowers users with dynamic charts, graphs, and alerts on the web. This post guides you through the overarching steps involved in configuring Grafana to interface with Oracle Cloud VMware Solution, enabling the monitoring of diverse capacity, performance, and availability matrices of vSphere environment.
InfluxDB
InfluxDB, a product of InfluxData, is a dynamic, open source time series database designed to efficiently store and retrieve time-sensitive data. Widely employed in operations monitoring, application metrics, internet of things (IoT) sensor data, and real-time analytics, InfluxDB serves as a robust solution for managing time series information. In the context of monitoring Oracle Cloud VMware Solution, the InfluxDB data source plays a pivotal role by storing all the data received from the Telegraf agent, which is configured to collect vSphere metrics.
Telegraf
Telegraf serves as a server-based agent designed to collect and transmit metrics and events seamlessly from databases, systems, and IoT sensors. Configured with both vSphere input settings and InfluxDB output configurations, a Telegraf agent efficiently captures the necessary metrics. You can then use these collected metrics to construct a comprehensive dashboard, facilitating effective monitoring and visualization within the Grafana environment.
An overview of the configuration
This section offers more details about the configuration of each component within the solution.
InfluxDB bucket
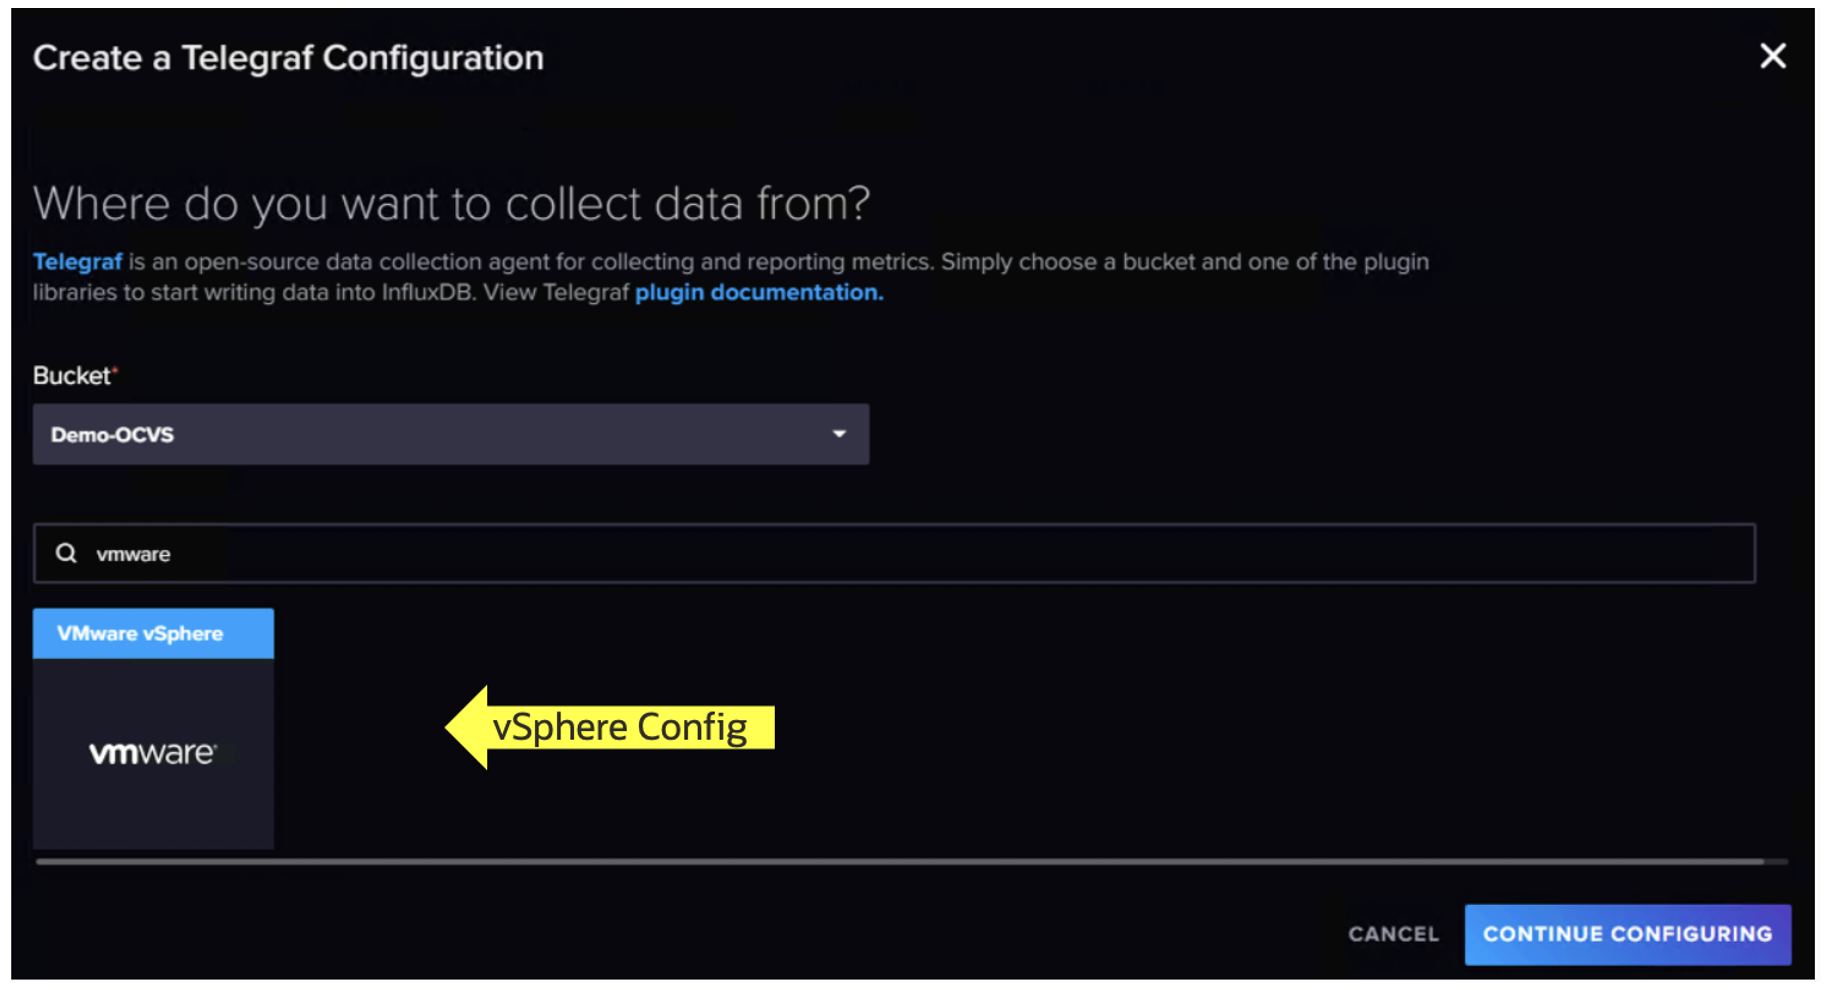
InfluxDB system buckets house crucial time series data that the InfluxDB monitoring and alerting systems and task engine use. In this context, your task involves creating a specialized bucket designated for storing data originating from the Oracle Cloud VMware Solution vCenter server. To streamline this process, predefined Telegraf configurations tailored for various sources are at your disposal. Specifically, opt for the VMware vSphere configuration when setting up your Telegraf config file as shown in the following screenshot.
Telegraf configuration
The Telegraf configuration comprises two distinct sections: Input and output. Within the output section, the InfluxDB server details are defined. Meanwhile, the input section delineates the Oracle Cloud VMware Solution vSphere details, along with its associated metrics in the same configuration file.
You can customize the configuration file to incorporate or omit specific metrics associated with hosts, clusters, data centers, VMs, and data stores. This flexibility allows for fine-tuning the monitoring setup based on your specific requirements and preferences.
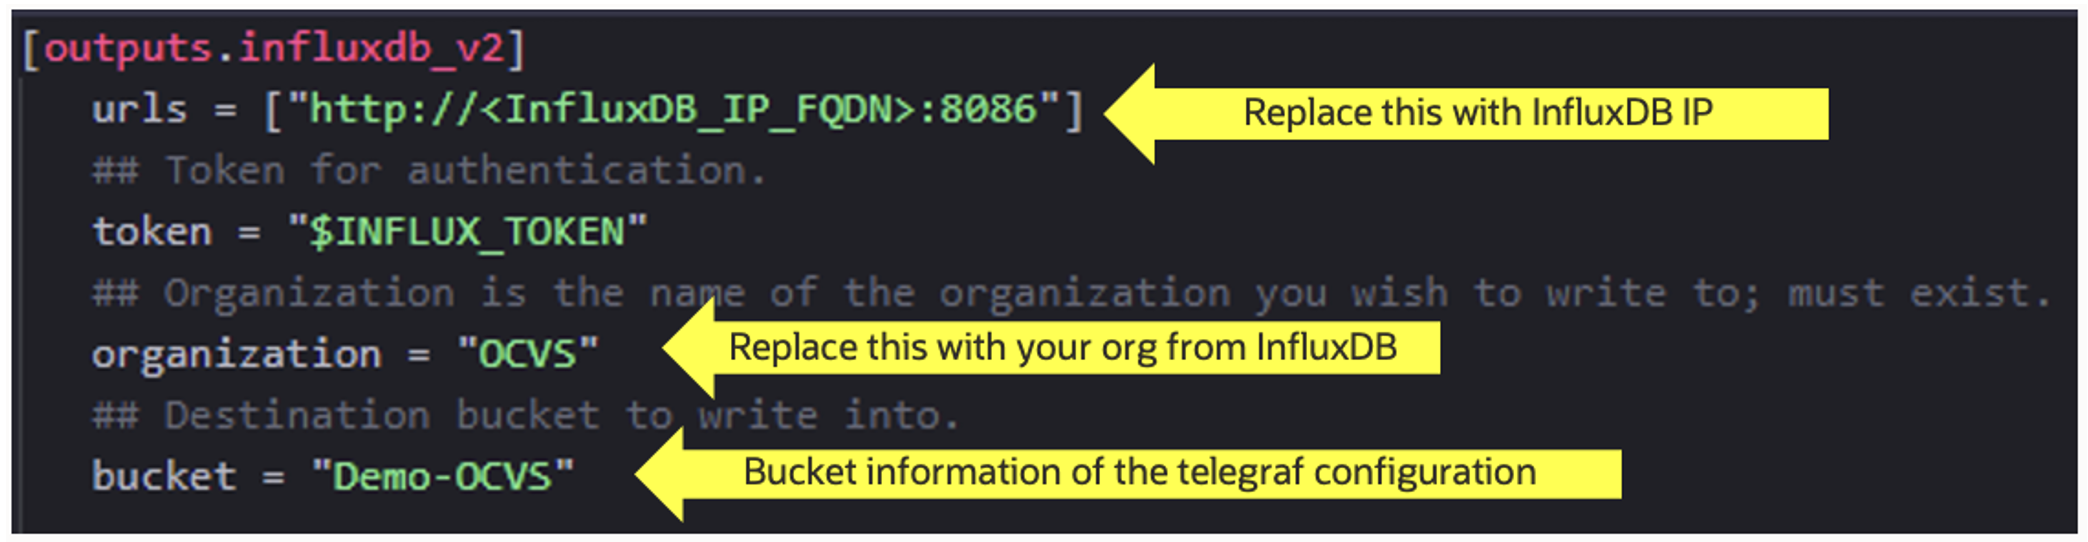
Sample output configuration
The following screenshot shows the sample output configuration for the vSphere Telegraf configuration file. This output section connects with InfluxDB bucket.
Sample input configuration
The following screenshot illustrates the input configuration specifically related to the Oracle Cloud VMware Solution vCenter configuration.
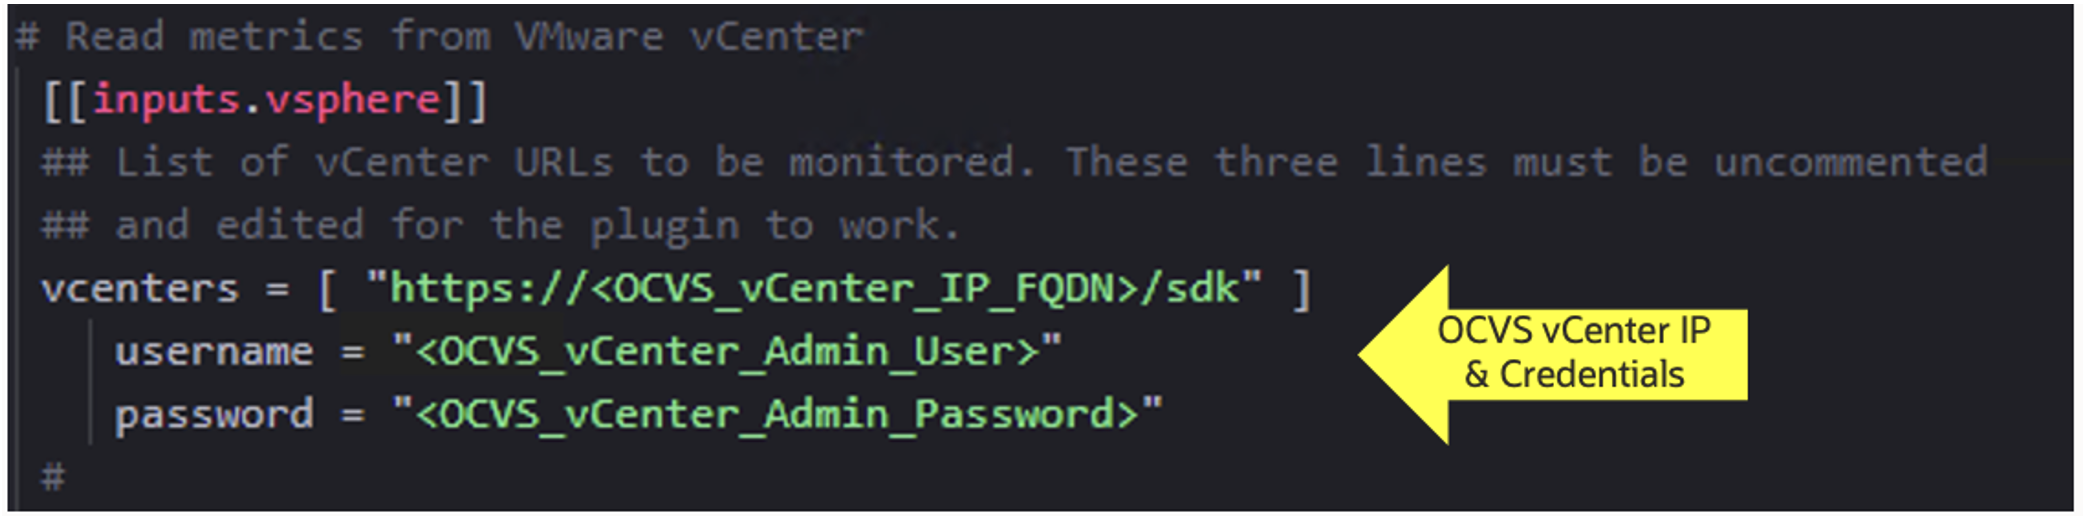
The default Telegraf configuration file provides settings for a range of input sources, among which is VMware vSphere. Telegraf seamlessly interfaces with the vCenter API, enabling the collection of essential metrics, subsequently pushing them into the designated InfluxDB bucket. Within the Telegraf configuration file, you can find specified metrics for VMs, hosts, data stores, clusters, and data centers. These metrics are diligently collected from the vCenter server, forming a comprehensive set of data to enhance monitoring capabilities.
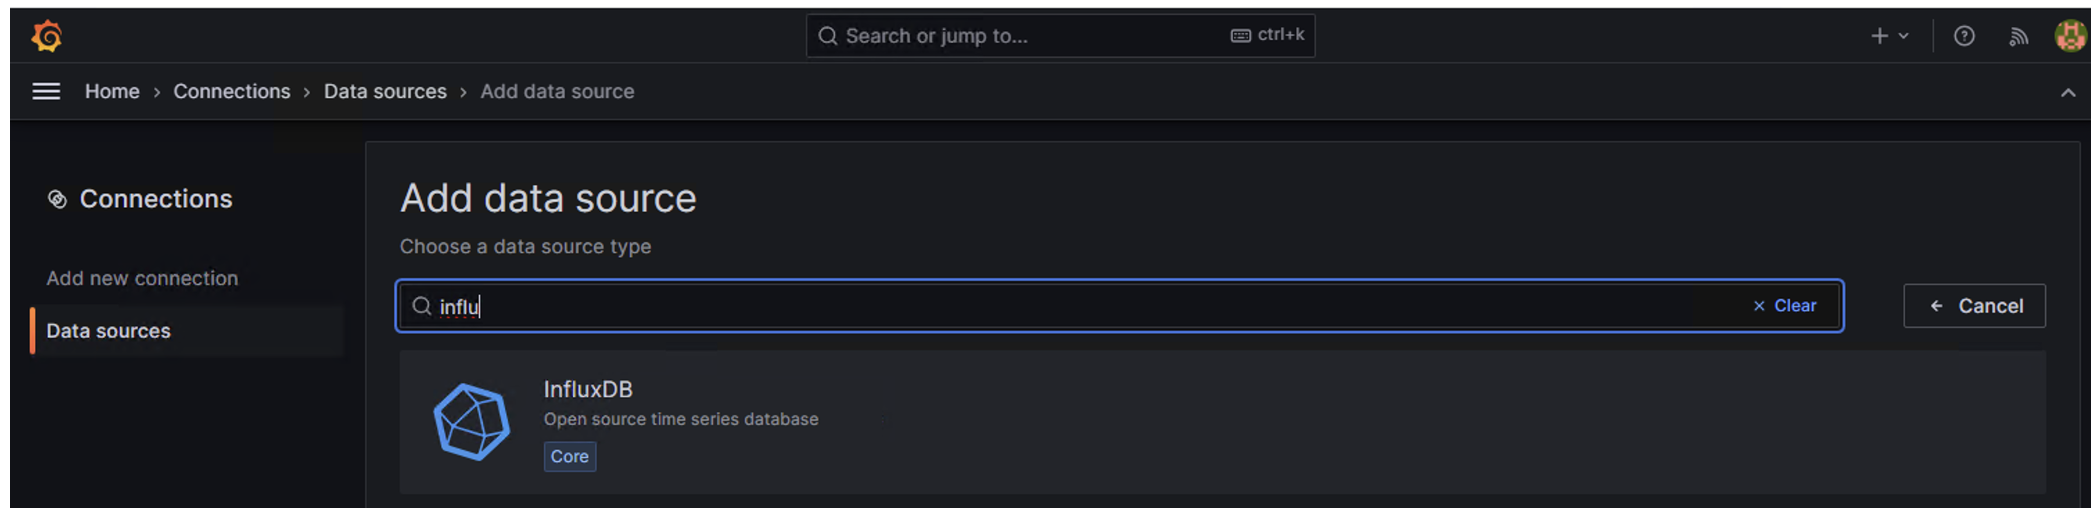
Grafana data sources
Grafana offers native support for numerous data sources, and if you require more, various data source plugins are available for installation. If the specific plugin you need isn’t already available, you can also develop a custom plugin tailored to your requirements.
Each data source, including InfluxDB, is equipped with a query editor designed to formulate custom queries based on the structure of the respective source. When a data source is added and configured, you can utilize it for various operations, such as querying the data, visualizing panels, and creating rules.
InfluxDB is seamlessly integrated as a data source in Grafana, facilitating the creation of visually appealing dashboards for the Oracle Cloud VMware Solution environment. The following screenshot illustrates the built-in data source configuration for InfluxDB.
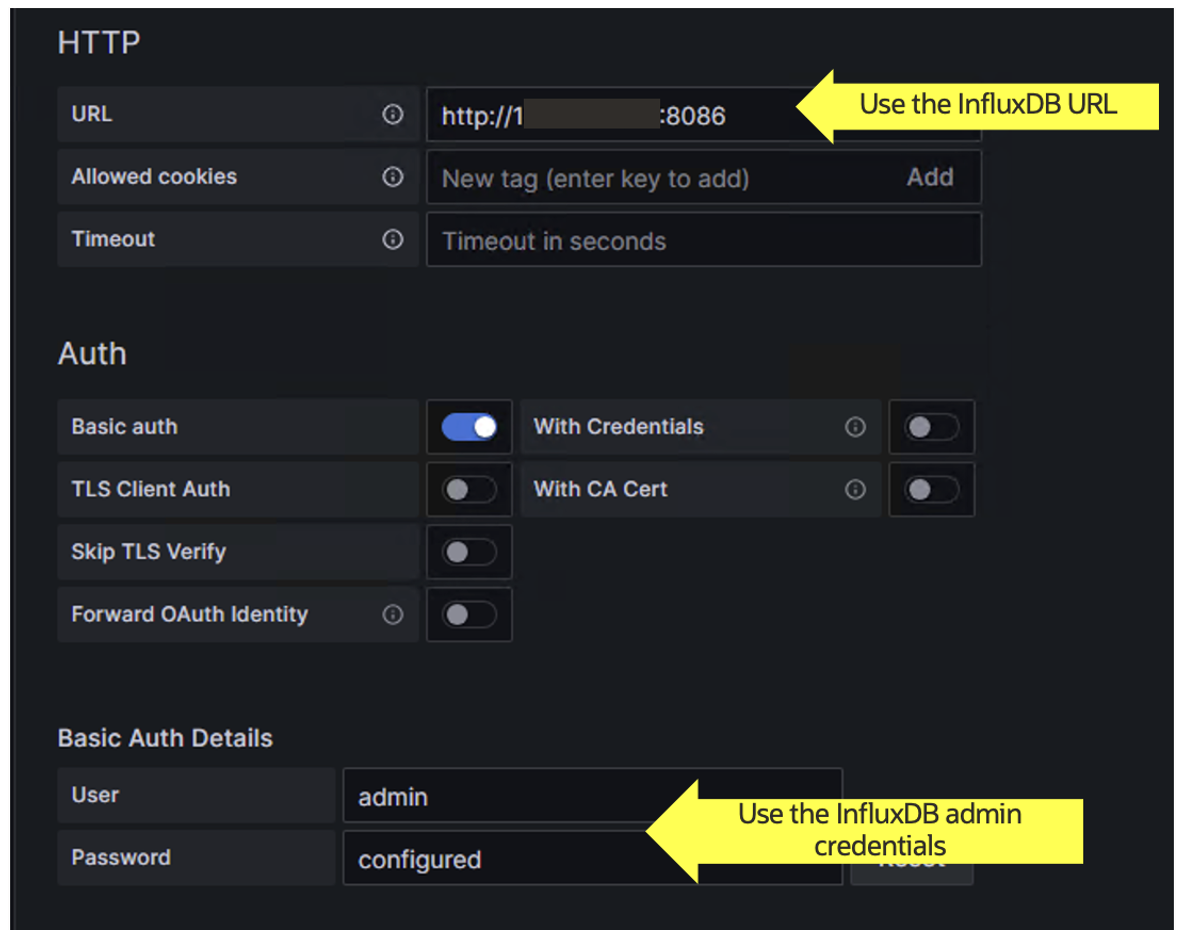
Grafana establishes communication with InfluxDB using HTTP on port 8086. Through this channel, Grafana retrieves all the metrics needed for querying data and constructing the essential dashboards. This seamless integration facilitates the dynamic visualization and analysis of metrics stored in InfluxDB, contributing to the creation of informative and user-friendly dashboards within Grafana.
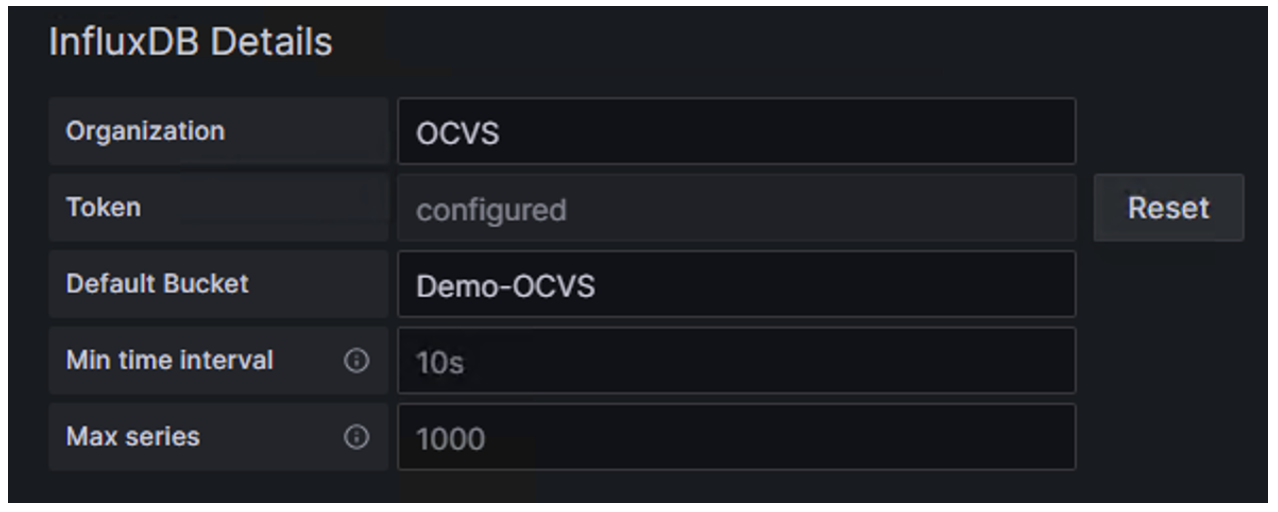
The details about InfluxDB correspond to the Telegraf bucket specifically created for the Oracle Cloud VMware Solution configuration. In building the Grafana dashboard, this designated data source is instrumental for visualizing the metrics, ensuring that the displayed information is derived from the Telegraf-collected data within the Oracle Cloud VMware Solution environment. The following screenshot shows the InfluxDB details where “Demo-OCVS” is the dedicated bucket created for the vSphere Telegraf configuration.
After selecting a data source, you can query and visualize metrics using various tools, such as charts, graphs, tables, and widgets within Grafana. The platform also offers the convenience of importing precreated dashboards directly from the Grafana Dashboard.
For VMware vSphere users, Grafana provides a dedicated portal featuring an array of prebuilt dashboards. By utilizing the search function with the keyword, “VMware,” you can effortlessly import diverse dashboards, encompassing comprehensive summaries of vSphere, detailed information on hosts and VMs, and more. This streamlined process enhances the accessibility and usability of Grafana, providing users with an efficient means to create visually impactful and informative dashboards tailored to VMware environments.
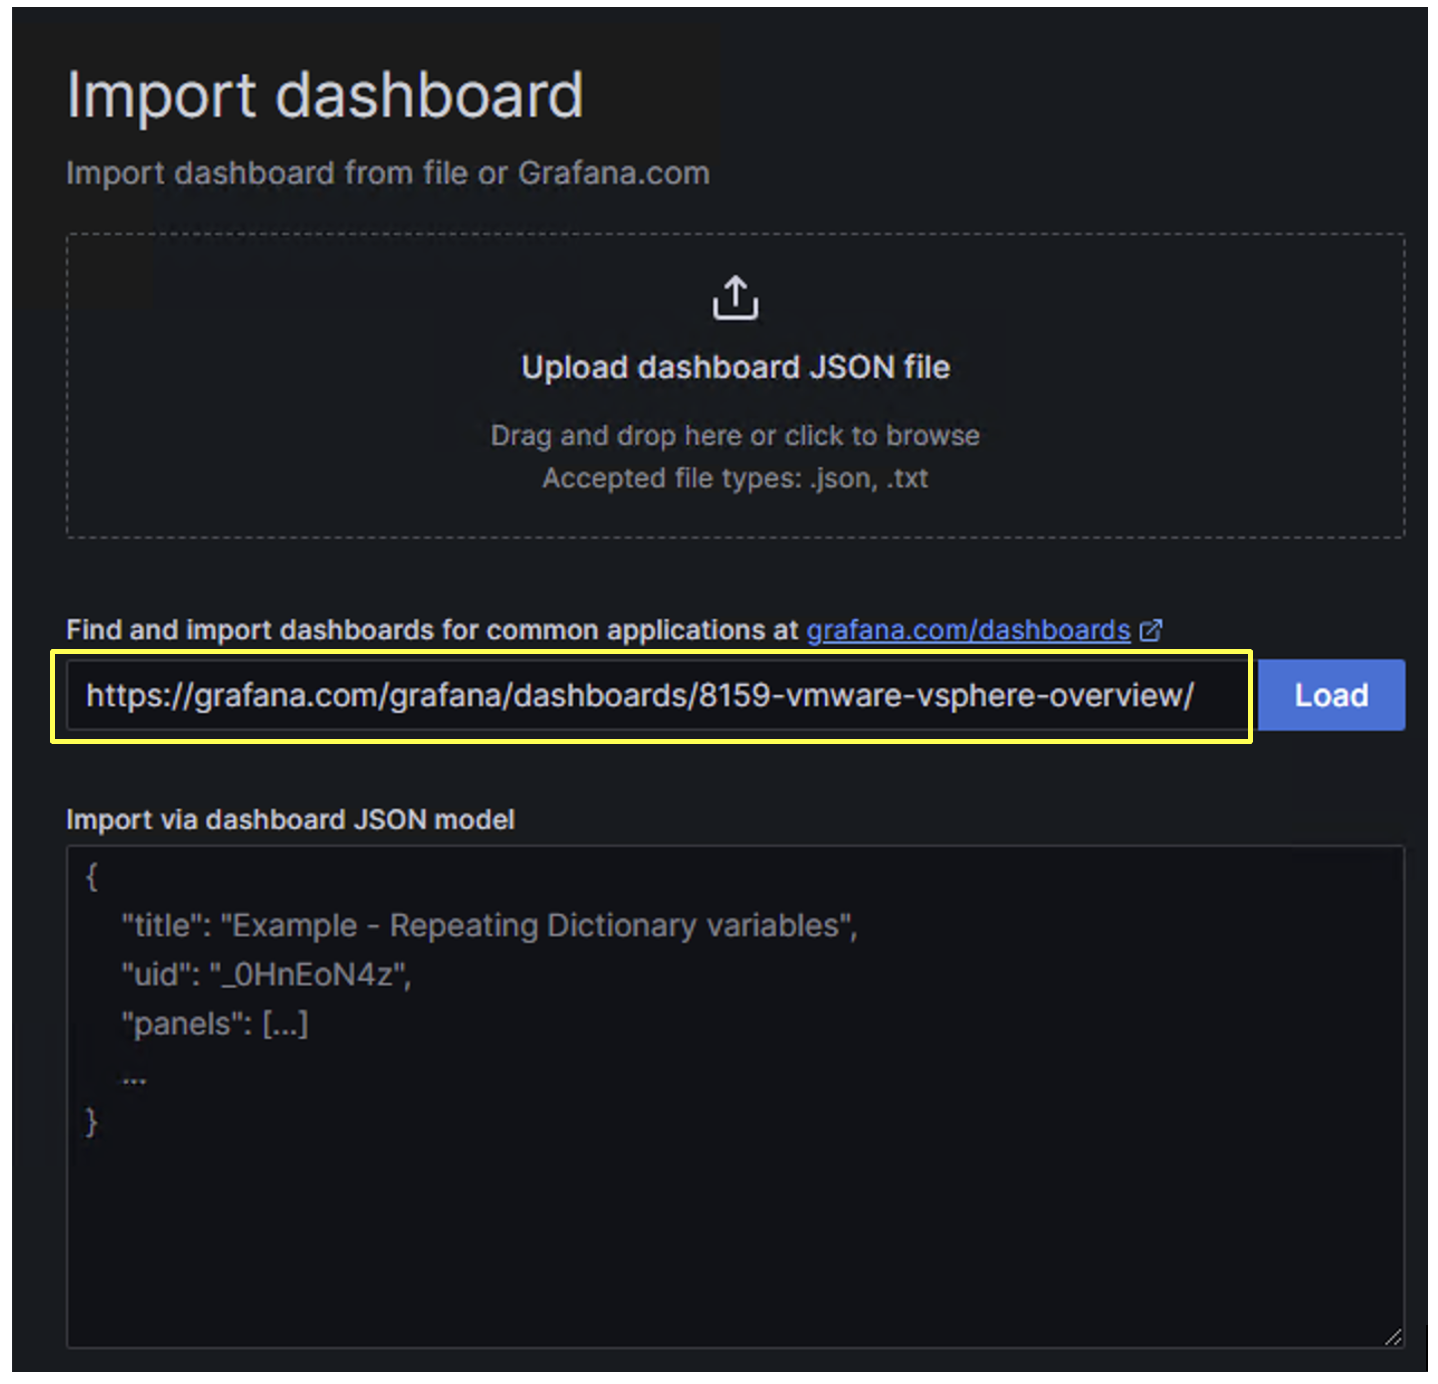
To seamlessly import a dashboard, select the Import dashboard button within Grafana. You can either use the dashboard ID, or URL or upload a JSON file. Alternatively, for a more customized approach, Grafana offers the flexibility to create your own dashboards from scratch, tailoring them to meet your specific visualization and metric analysis needs. This versatility in dashboard management ensures a user-friendly and adaptable experience within the Grafana platform.
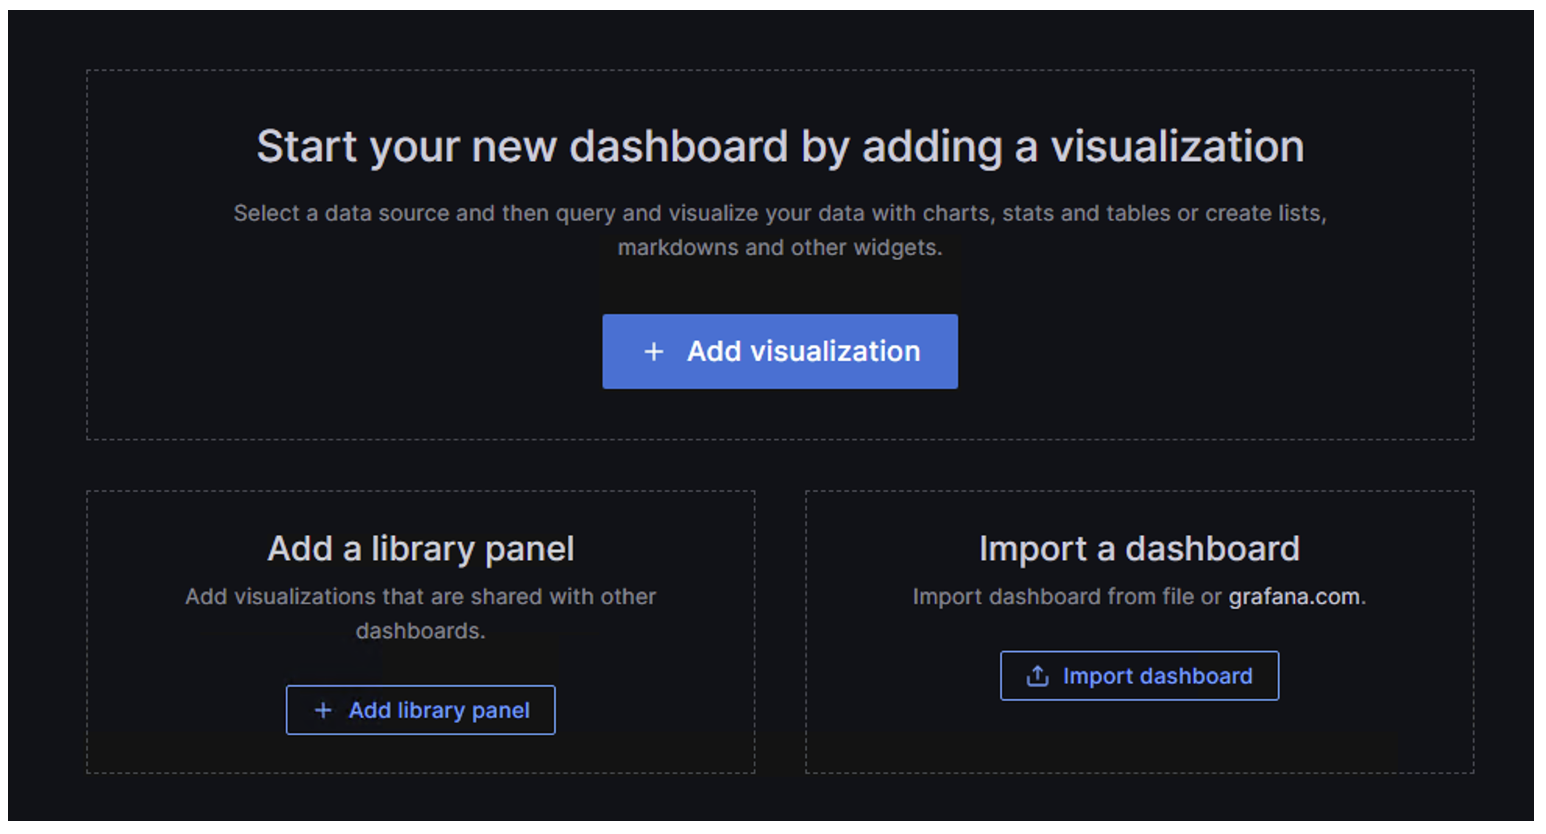
The following dashboards are available for import from Grafana, offering a comprehensive overview of the Oracle Cloud VMware Solution environment:
Refer to the following sample screenshot that shows how to import the recreated dashboards in Grafana.
Conclusion
Grafana stands out as a robust open source tool, offering the capability to visualize not only VMware-specific metrics but also extend its effectiveness to monitor various workloads within your OCI environment. This post has provided a comprehensive overview of how data sources, such as InfluxDB time series database, and agent configurations like Telegraf, synergistically empower you to query data seamlessly and construct visually appealing, prebuilt, and ready-to-use Grafana dashboards.
This solution delivers robust monitoring capabilities, standing out as a compelling alternative to paid solutions in the market. Notably, VMware Aria operations can’t be independently acquired as an add-on for monitoring usage within Oracle Cloud VMware Solution. This open source alternative is well-equipped to address the observability and manageability demands, serving as a unified monitoring solution for all Oracle Cloud Infrastructure workloads, including Oracle Cloud VMware Solution.
For more information, see the following resources: