The Oracle Cloud Infrastructure (OCI) Logging service is a highly scalable and fully managed logging platform that allows you to seamlessly ingest, analyze, and act on all your log data in one unified experience.
We heard from our DevOps customers about the need to enhance the usability of the Logging search page by providing crossregion search support, customizable visualization, and a better exploration of logs. Today, we’re excited to announce the general availability of five key usability enhancements to OCI Logging related to that feedback.
Multiregion search
We understand that our DevOps customers want to process logs across regions without switching the region in the Oracle Cloud Console. Issues arise when they want to view logs across all OCI regions (37 currently). With this new release, you can search for logs across multiple regions from your active region, removing the need to change the Console region every time. You can also show or hide the results of the individual regions after a search. The following image shows the enhancement called “Select regions to search.”
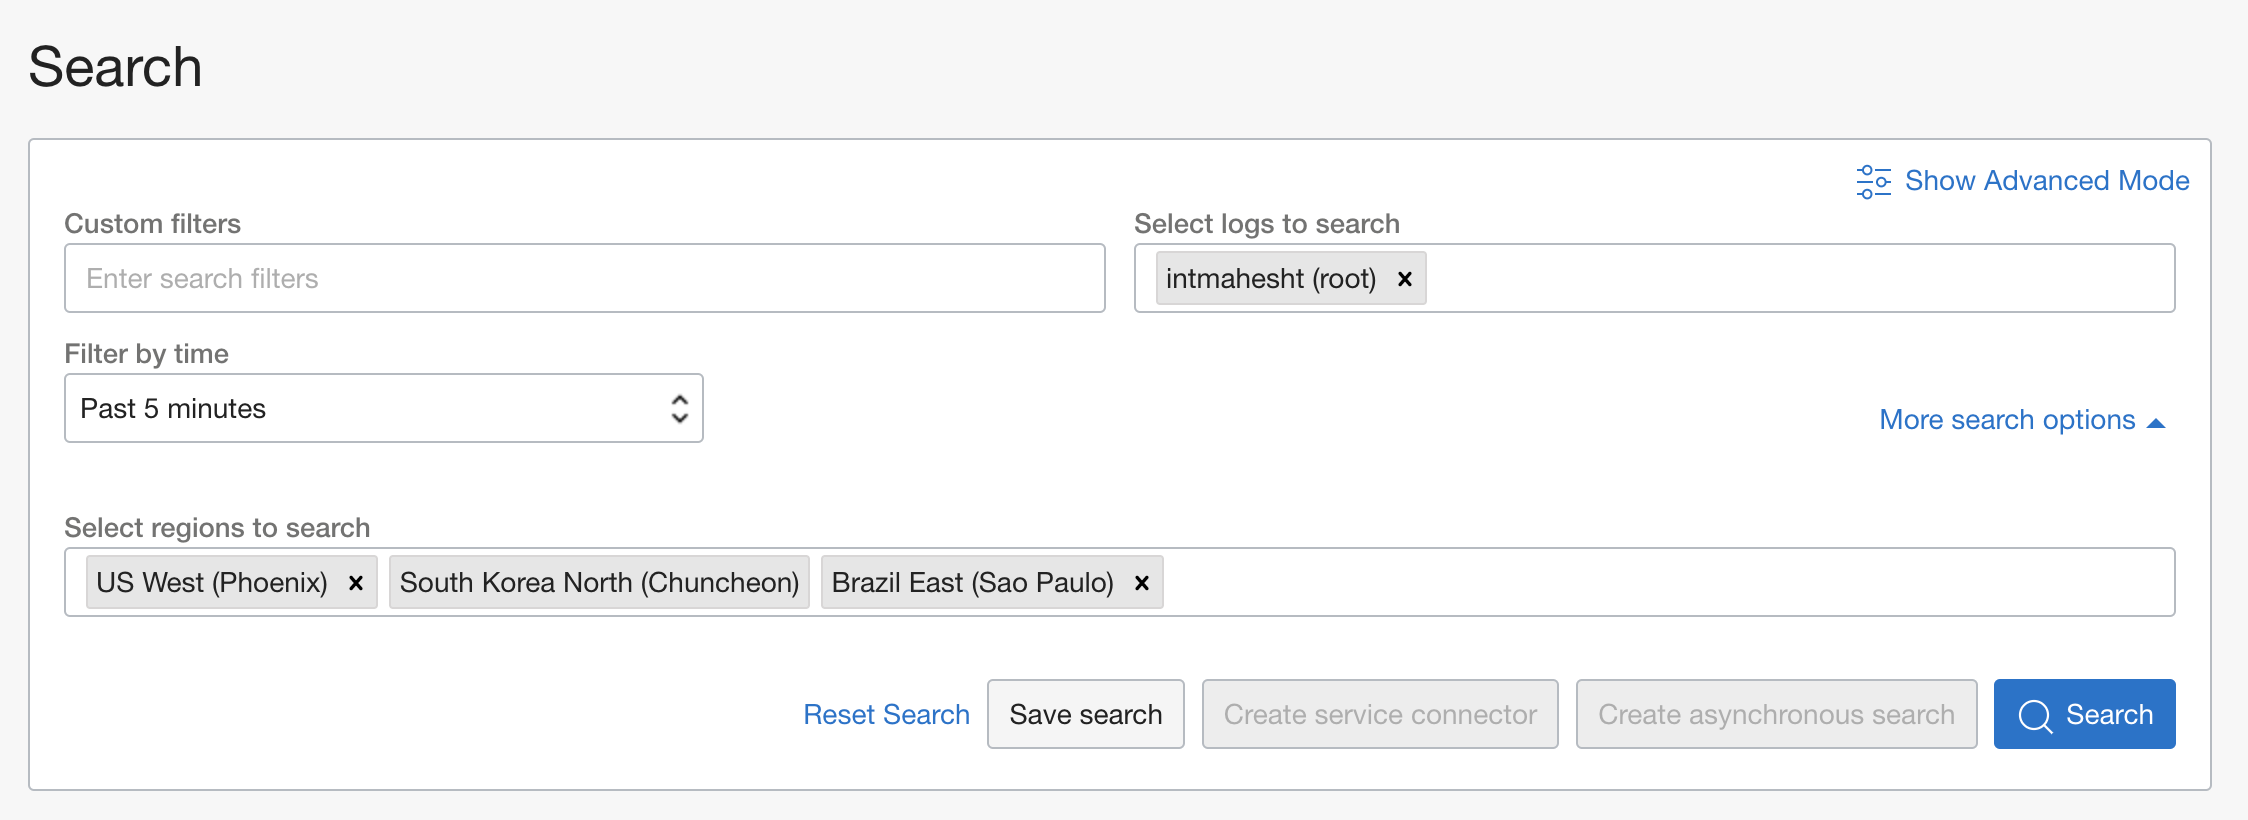
To learn more about running multiregion searches in the Console, see the documentation.
Query-based visualization
Another key feature provided by OCI Logging is the visualization of data with a fixed x-axis of DateTime. Our customers want to customize the field used for the x-axis, giving them the freedom of creating a bar histogram for a variable of their choice. This release expands the visualization feature allowing you to create more customized visualization with an x-axis and group by field of your choice, both in simple mode using UI or advanced mode using queries. This capability is available for four types of charts: Bar, line, pie, and donut. The following images show an example of a bar chart with a custom x-axis.
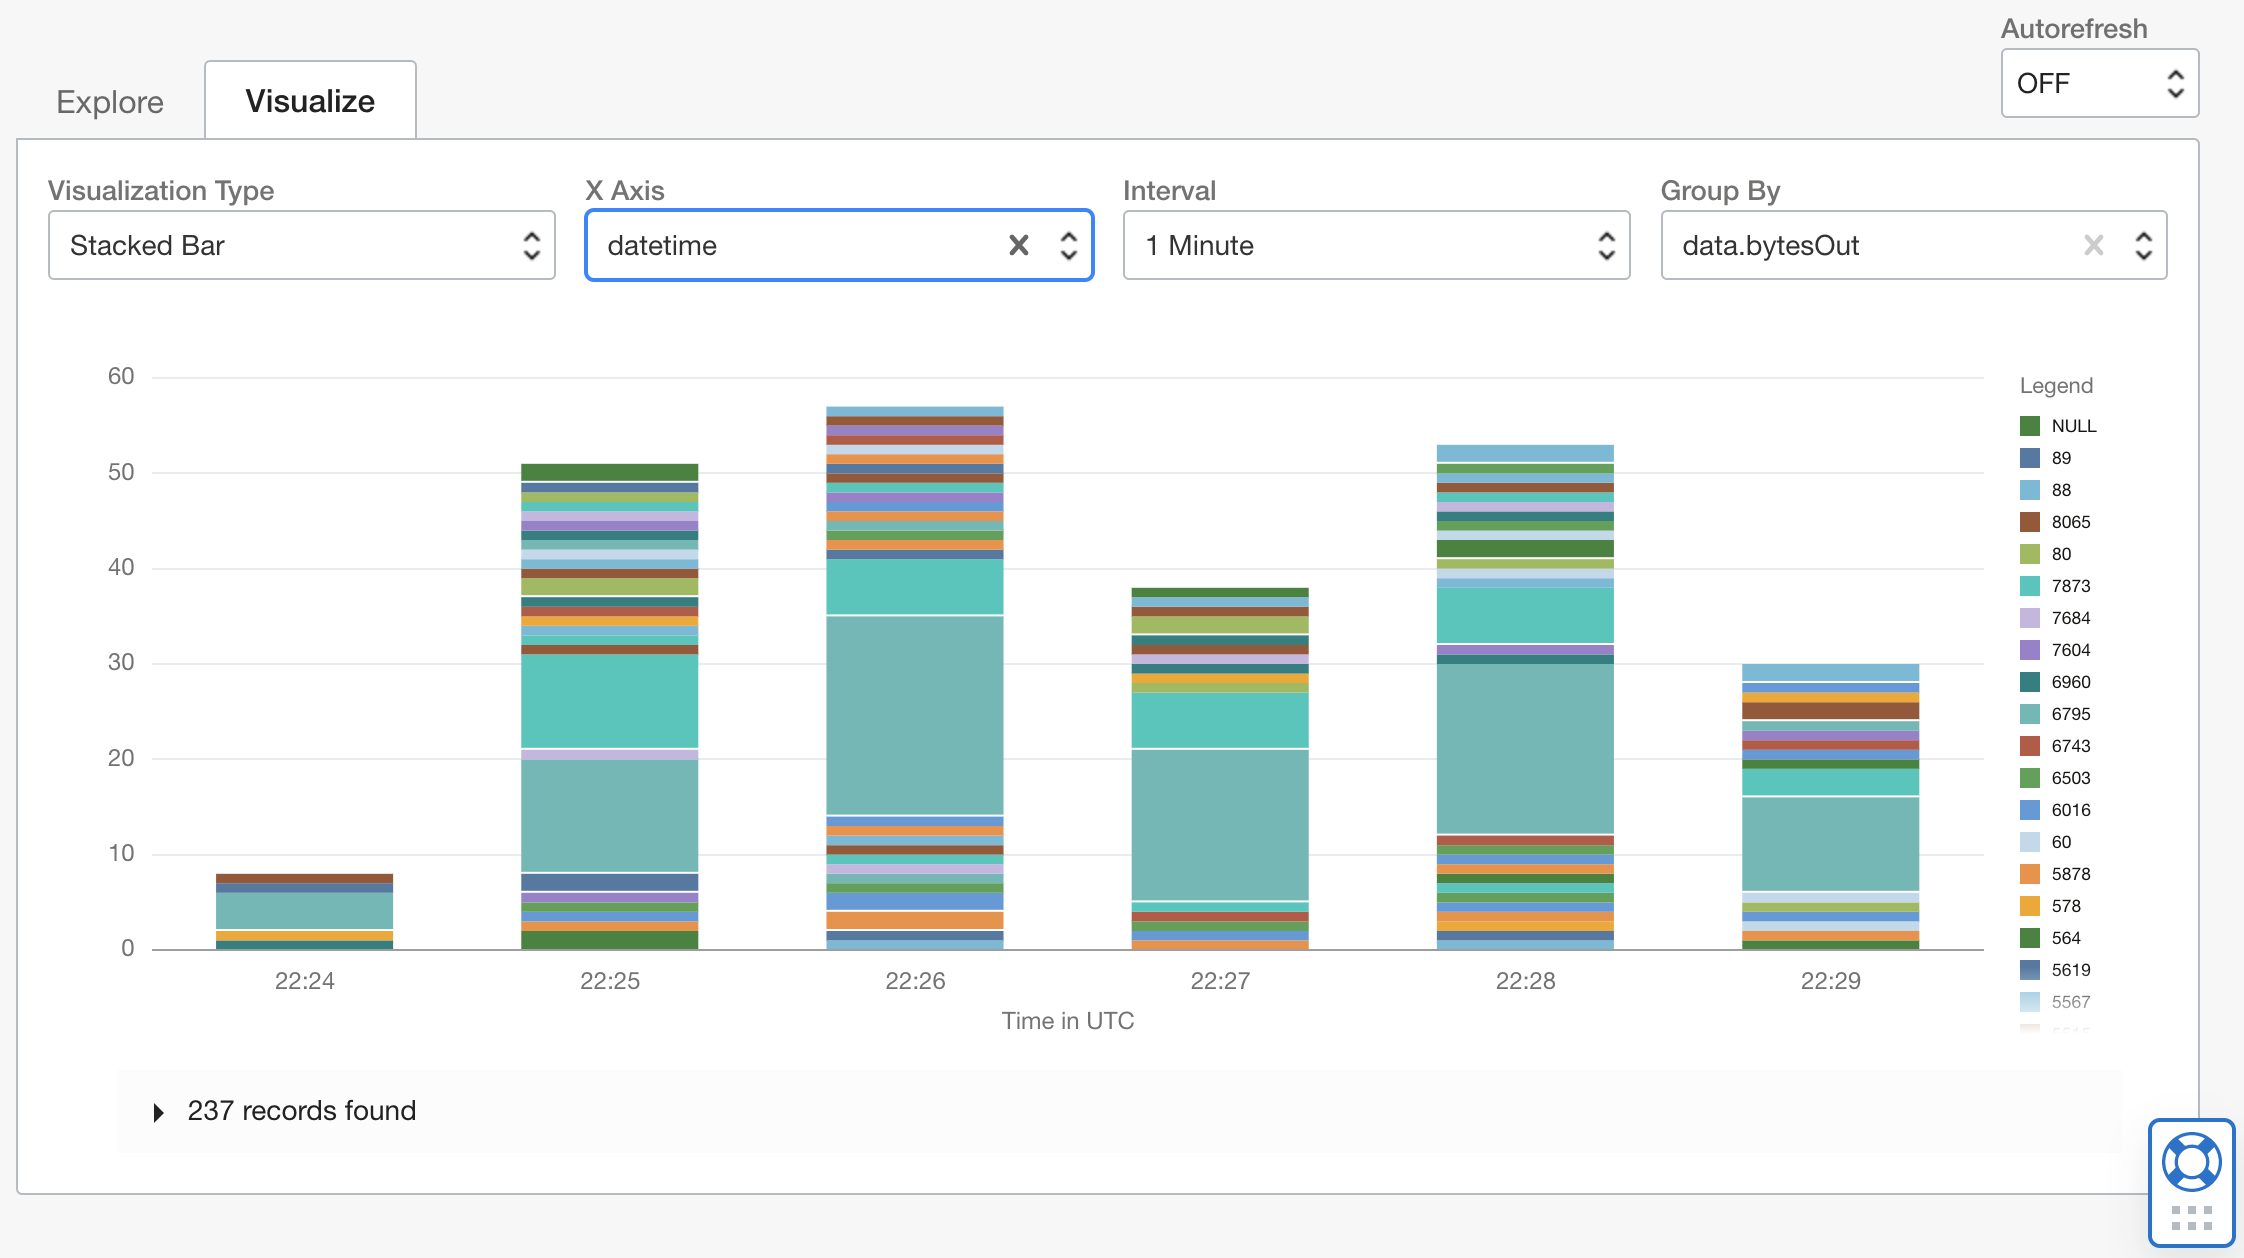
To learn more about running query-based visualization in the Console, see the documentation.
Wrap and expand log lines
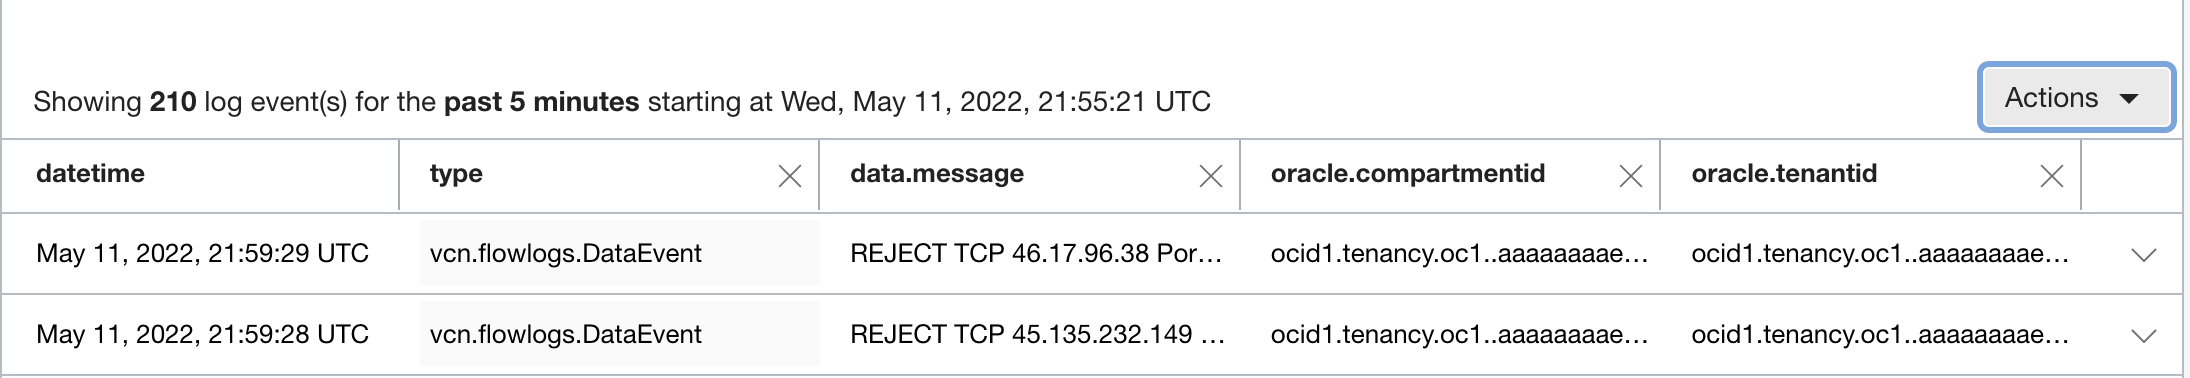
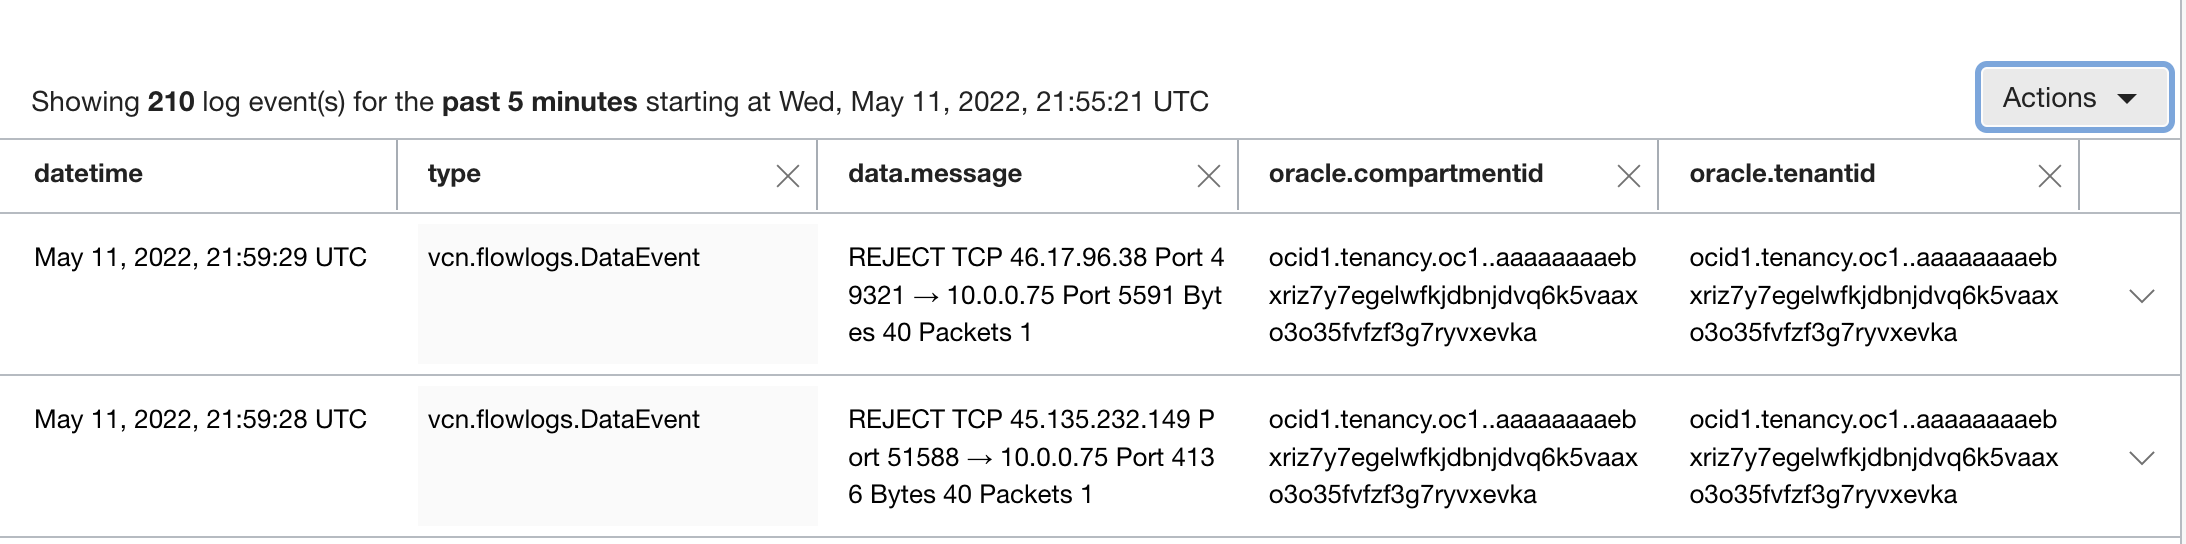
We want to enable our customers to quickly process many log lines. Today, the search result on the search page gets truncated based on the column width, making it harder for our customers to process log lines, especially on smaller screens. Now, we have added support for wrapping long log lines to consume them on smaller screens without excessive scrolling. The wrap functionality works both on the unexpanded and expanded view of logs. The following image shows a long log field unwrapped (default setting) and wrapped.
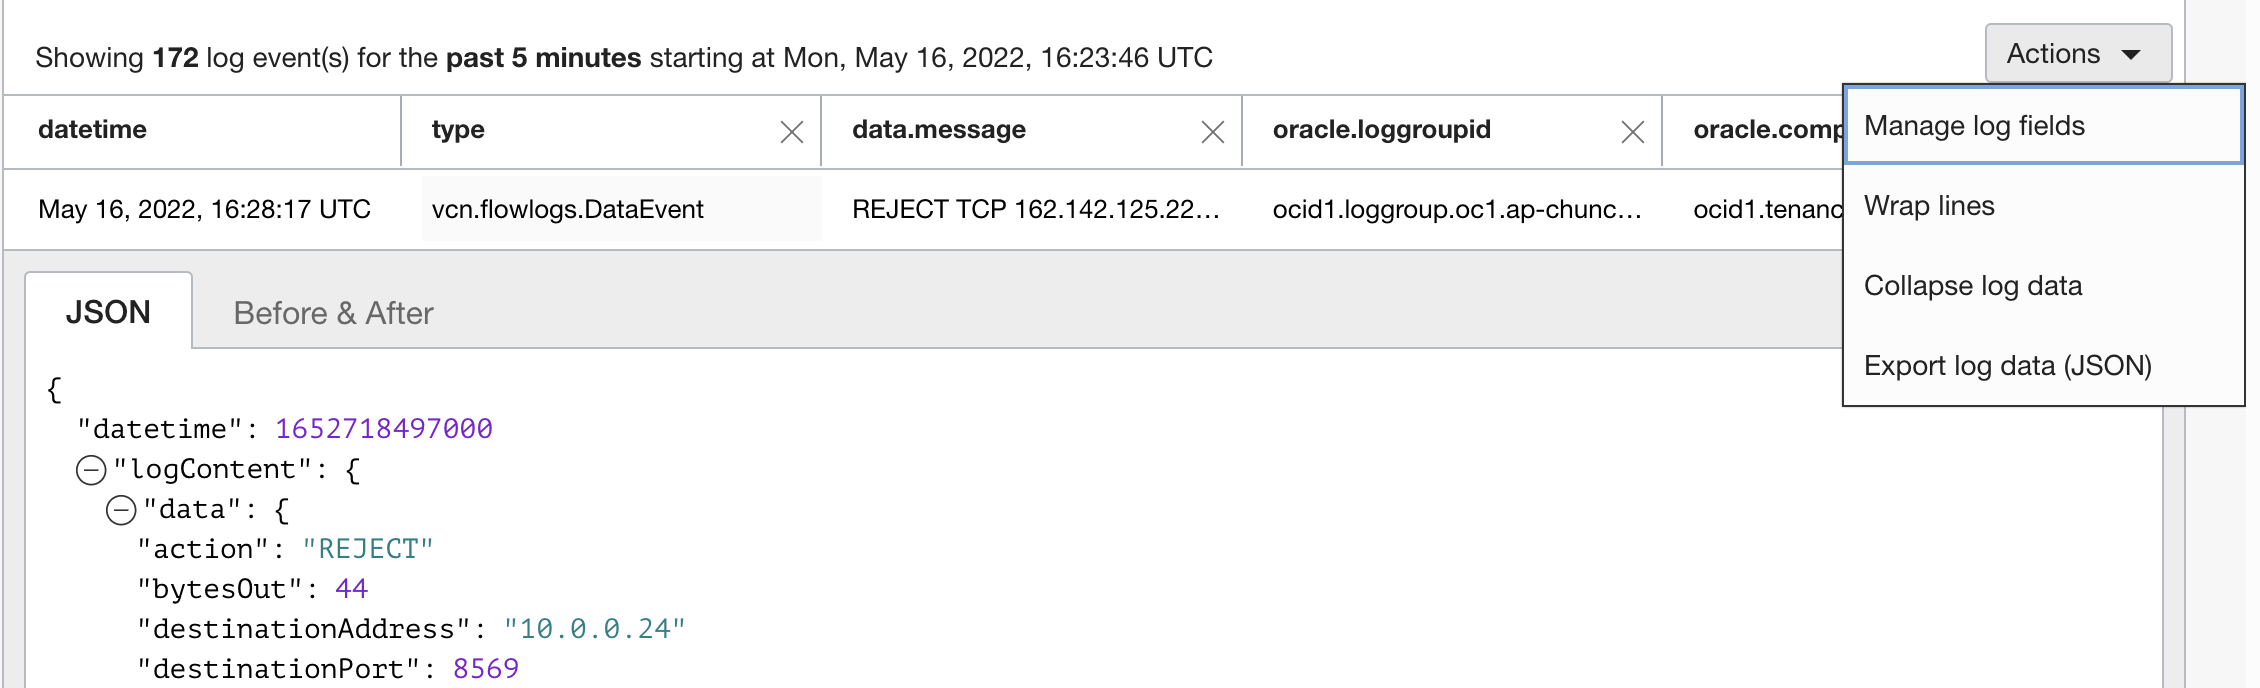
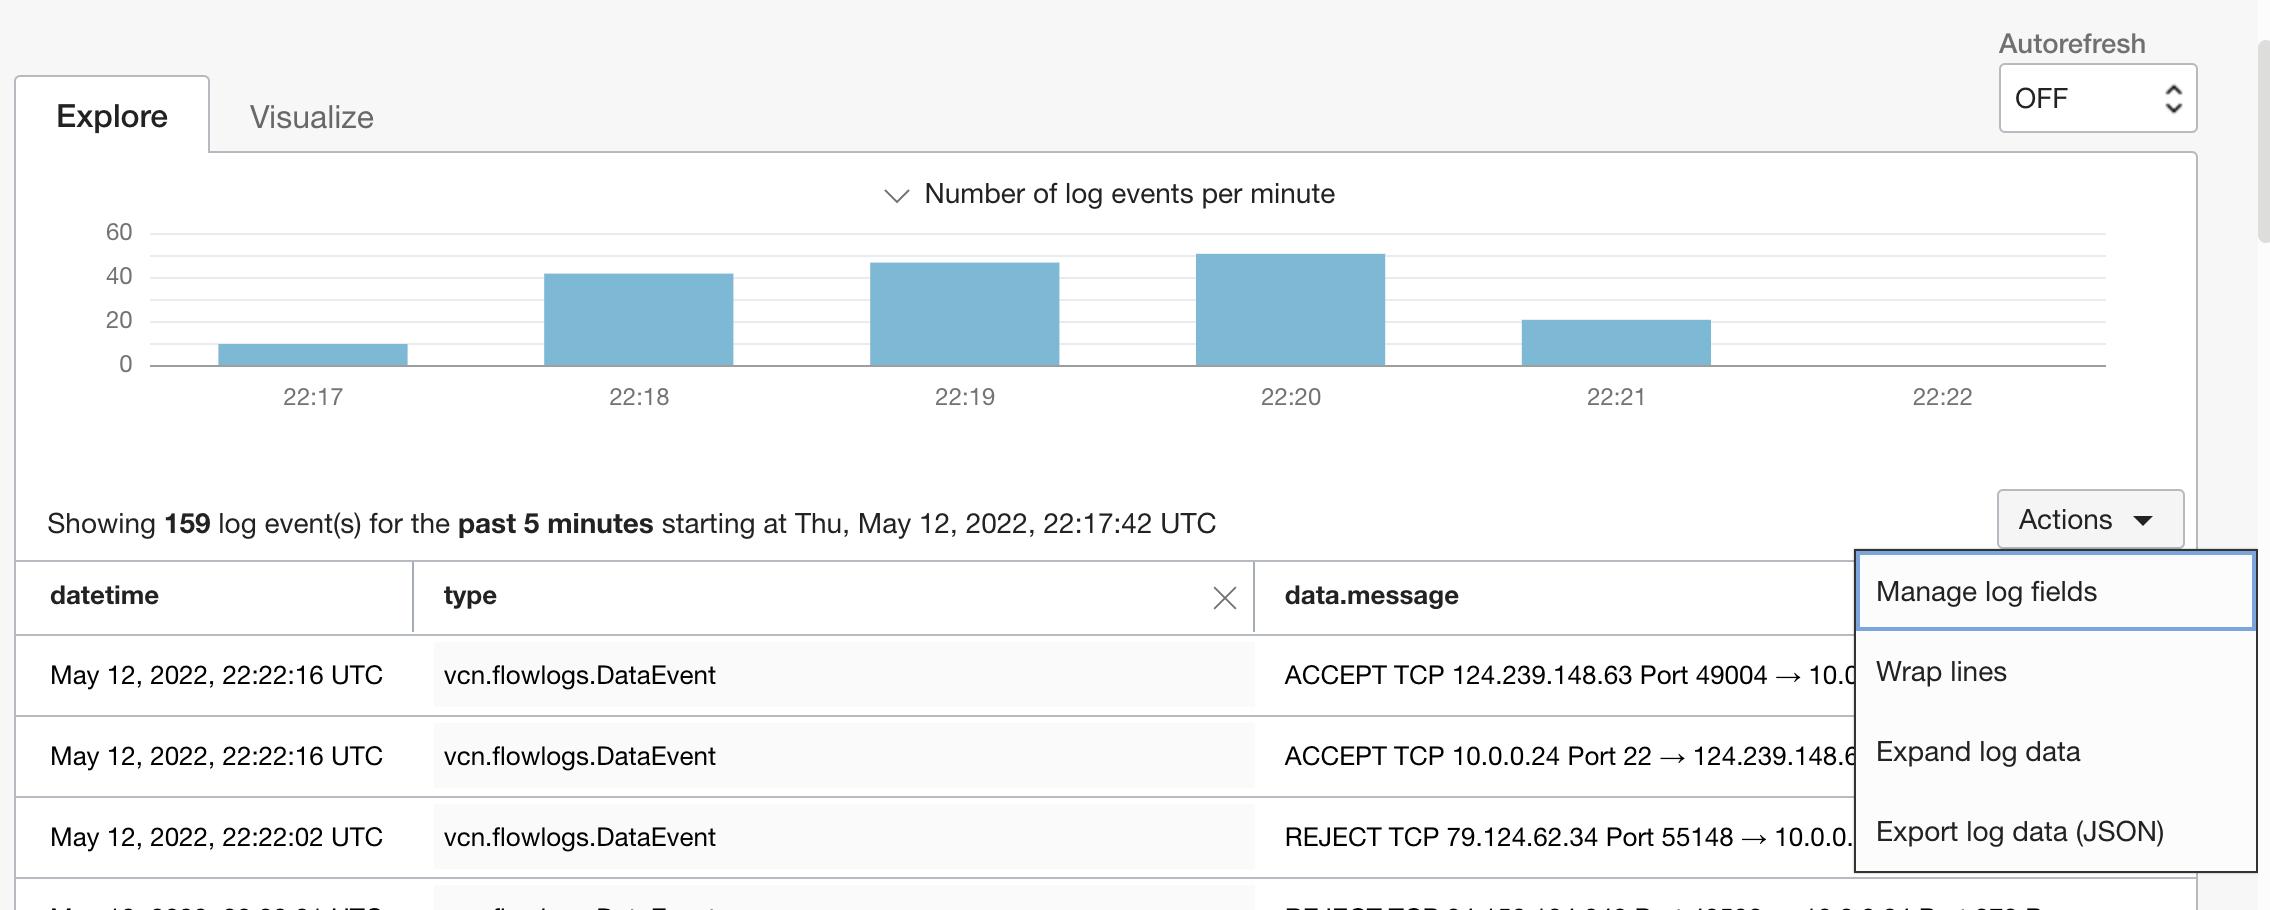
Before, you clicked on the individual expand view button for each event to have a complete view of log data, but now you can expand all entries using the Expand Log Data option and can also bulk collapse. This capability gives you the ease of going through many log details with fewer clicks. The following screenshot shows the expanded log data.
To learn more about wrapping log lines and options for expanding and collapsing in the Console, see the documentation.
Manage log fields
We’ve also introduced a new feature for managing log fields, which provides an intuitive UI-based menu to select fields of relevance from your log data and deselect unwanted information from taking up tablespace. You can access this feature under the Actions button on the Search page.
Check out more about managing log fields in the documentation.
Get started today!
Access Logging under Observability and Management in the Oracle Cloud Console menu. Logging is available through the Console, SDK, CLI, REST API, and Terraform. It’s accessible in all commercial regions, with Government regions coming soon. For more details, see the Logging documentation and FAQ.
We also encourage you to learn about Service Connector Hub, which allows you to move and take action on your logs. To try Service Connector Hub and Logging services for yourself, sign up for the Oracle Cloud Free Tier or sign in to your account.
