
Most agent frameworks still treat the “harness” as plumbing, the code that wraps a model call with a system prompt, a tool list, and a retry loop. AgentField’s harness-orchestration-alphasignal repo makes the more useful claim: a harness is one agent loop with tools, and harness orchestration is what happens once that loop stops being the whole program and becomes the atomic unit you program with. Composed, conditioned, and eventually written at runtime by the system itself, the same way functions compose into software. That reframing is worth taking seriously, because it changes what we’re actually deploying. We are not deploying a model. We are deploying a runtime that decides how many models to call, in what order, with how much authority, and the infrastructure question that follows is almost entirely a CPU and orchestration question, not a GPU one.
The core idea
The core idea is about ‘blast radius’ as the unit of measure. The repo’s seven notebooks climb a single ladder of autonomy, and each rung is measured against the same question. As we hand over higher-level intent to the system, how far does one instruction reach? AgentField calls that reach the blast radius, and the whole exercise is designed to make it observable rather than assumed.
The progression is deliberate. Notebook 01 is a single typed LLM call with a schema contract and a confidence flag, the smallest unit that can fail predictably. Notebook 02 turns a goal plus a judge into something that already behaves like an agent, a loop that checks its own output against a target rather than returning on the first pass. Notebook 03 shows that reasoners are callable like APIs, and that calling the same reasoner three times gives three different answers, which is the first honest acknowledgment that non-determinism is a property we have to manage, not an edge case. Notebook 04 is the hinge most engineering orgs actually live at today. A hand-wired graph built with an AgentRouter and asyncio.gather, where the DAG is fixed in code and produces the same outcome every run.
The interesting jump is 04 to 06. Notebook 05 has a reasoner write the prompt for its own child reasoner, meta-prompting as a first step toward self-modifying structure. Notebook 06 goes further and lets the system decide its own graph shape at runtime, with fan-out, recursion, and explicit caps, so a different incident produces a different execution graph instead of the same fixed pipeline evaluated against different inputs. Notebook 07 makes that runnable without a human staring at a notebook, using event triggers and an approval gate, and notebook 08 closes the loop by measuring the blast radius directly rather than trusting a demo. The domain is incident triage, twelve incidents with planted root causes and a twenty-six-lens taxonomy where thirteen of the twenty-six lenses appear in exactly one incident, which is what gives the runtime-generated graph something real to decide instead of a toy choice.
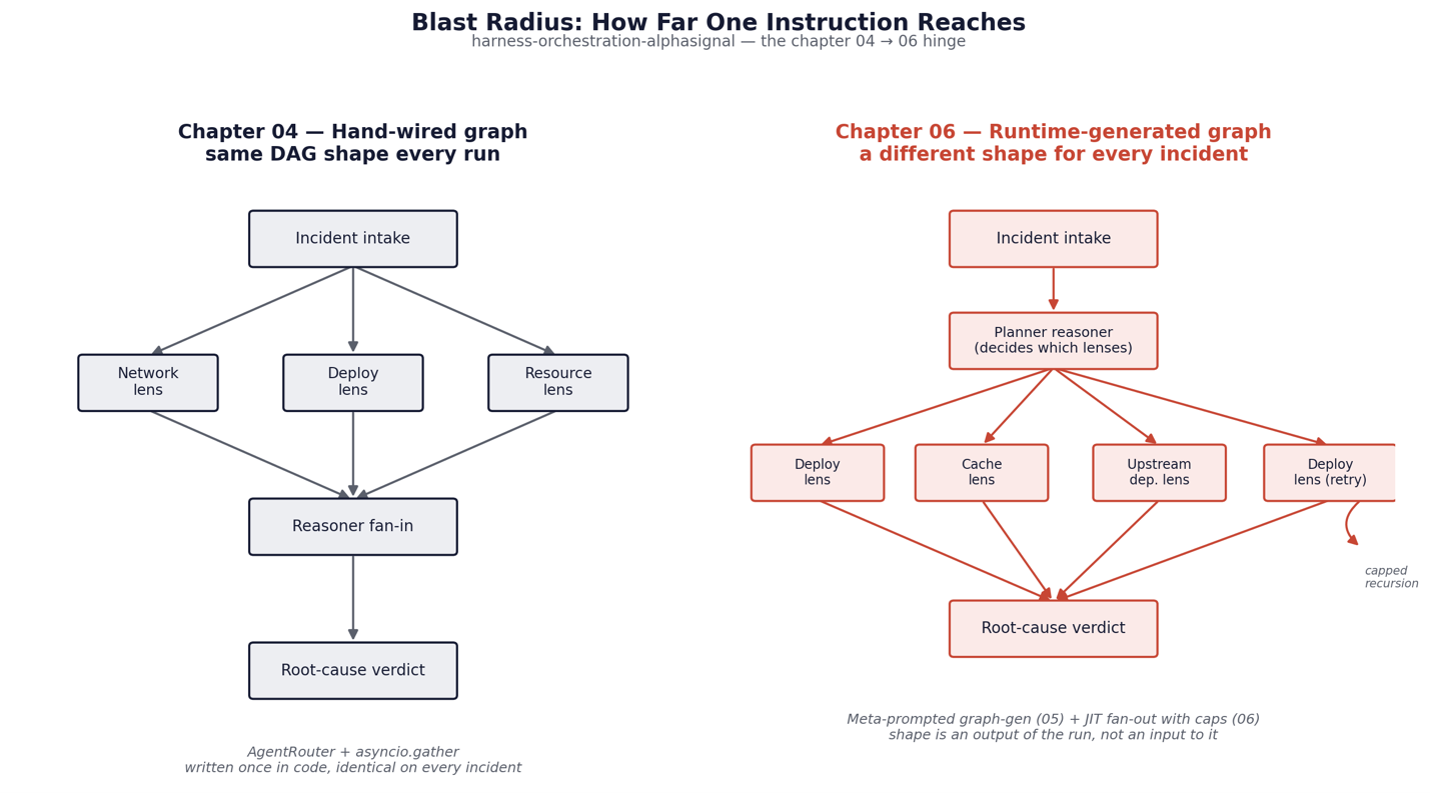
This is the part worth sitting with before touching any infrastructure decision. A hand-wired DAG is auditable because it is identical every run. A JIT-generated graph is more capable and strictly harder to reason about, because the shape of the system is now an output of the system rather than an input to it. Any enterprise architecture built on this pattern needs to treat the runtime that generates graphs as a governed component in its own right, with logging, caps, and an approval gate as first-class infrastructure, not an afterthought bolted onto a demo.
Why this is a CPU workload, not a GPU workload
Here is the part that gets missed when teams jump straight to GPU sizing for anything with “agent” in the name. The token generation happens off-box, against a hosted model through an LLM router or a similar endpoint. Nothing in the harness runtime itself, the control plane, the node process, the reasoner scheduling, the DAG rendering, the trace assembly, the blast radius metering, does matrix multiplication. It does concurrent I/O, JSON schema validation, retry and backoff logic, event handling, and light graph computation. That is a CPU-bound, memory-bandwidth-bound, and network-latency-bound profile, and it is a much better match for a well-chosen CPU shape than for GPU capacity that would sit idle waiting on an external model API to respond.
This distinction matters for cost, not just correctness. Provisioning GPU instances to run an orchestration layer that spends most of its wall-clock time waiting on HTTP responses is the kind of total-cost-of-intelligence mistake that shows up on a bill three months later. The orchestration layer and the inference layer are different workloads with different scaling curves, and they should be sized, and often deployed, separately.
Mapping the workload to the OCI CPU portfolio
OCI’s current CPU lineup gives you three real axes to choose along.
AMD EPYC (E-series),
Intel Xeon (X-series), and
Ampere Arm (A-series),
each with a bare metal and flexible VM option. The choice for a harness orchestration deployment comes down to core density per dollar and concurrency headroom, not clock speed.
AMD EPYC E5 and E6 Standard shapes are the default for the control plane and for any pod doing heavier synchronous work, DAG rendering, trace HTML assembly, or the meter’s self-checks. E6 Standard bare metal ships with 256 cores, 3 TB of memory, and 200 Gbps of network throughput per instance, and OCI’s own testing puts E6 at up to twice the price-performance of E5 at the same price point. If the control plane needs to coordinate many concurrent reasoner fan-outs during a JIT graph run like chapter 06’s incident triage, that memory bandwidth and core count matter more than any single-thread frequency number.
Intel X12 (Acceleron) Standard shapes, the successor to X9 and now built on Xeon 6 rather than Xeon 3, are worth evaluating if the deployment has a hard dependency on AVX-512 or Intel-specific tuning somewhere in the stack, for instance if the meter or an embedding step in the incident evidence matcher leans on an Intel-optimized math library. X12 delivers up to 2.5x the CPU performance of X9 per bare metal instance and 42% higher memory bandwidth, which closes a lot of the gap with AMD on raw throughput, though I have not run a side-by-side benchmark of this specific harness runtime on X12 versus E6 and would not claim a winner without one.
Ampere A1 and A2 Arm shapes are the shape I actually prototyped the reasoner fan-out pods on. The workload chapters 04 and 06 describe, many concurrent lightweight async tasks awaiting external API responses, is closer to a web-serving concurrency profile than a compute-bound one, and that is exactly where high core count per dollar on Arm tends to win on cost per concurrent session. A1 is available at no cost up to a modest core and memory allowance, which makes it a reasonable place to run the dev cockpit, the make demo control plane, node, and JupyterLab combination the repo ships with, before anything goes to a production node pool.
The honest caveat here is that none of this replaces load testing your specific reasoner mix. A harness that does heavy local validation, schema checking, or evidence-substring matching across long incident logs will lean more CPU-bound than one that is purely a thin router waiting on OpenRouter, and that shifts the balance back toward E6’s raw core count.
Running it on OKE
The repo already ships a docker-compose.yml, which means the control plane, node, and supporting services are containerized from day one, and the lift into OKE is a packaging exercise rather than a rearchitecture. A few decisions matter more than the others.
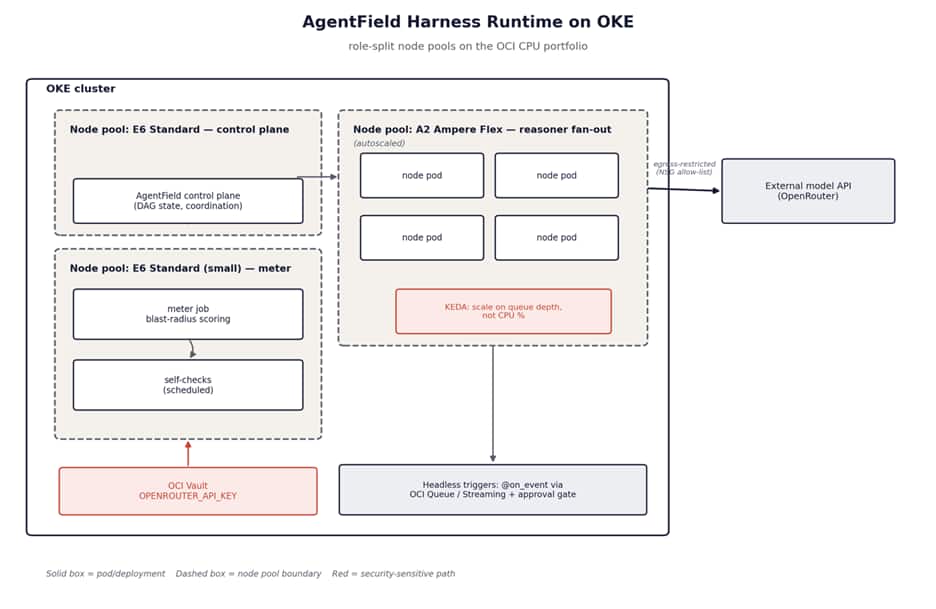
We split the deployment by role rather than running everything as one pod type. The control plane, which owns DAG state and coordinates the graph whether hand-wired or JIT-generated, ran as a small, stable deployment on an E6 node pool, sized for coordination overhead rather than for scale-out. The node processes that actually execute reasoners belong in a separate, horizontally scaled deployment, ideally on an A2 node pool given the concurrency profile, with autoscaling driven by queue depth or in-flight reasoner count rather than CPU utilization alone, since a fleet of async tasks waiting on an LLM API will show low CPU usage right up until the queue backs up. KEDA on OKE, scaling against a queue or event source, fits better here than the Kubernetes HPA’s default CPU metric.
The meter, which computes blast radius and runs the self-checks the repo uses to validate that measurement, fits well as a scheduled job or a lightweight sidecar rather than a long-running service, since it operates on completed run traces rather than live traffic. We kept it on a separate, small node pool. We also tested it as a batch workload so its resource footprint never competes with the node pool actually serving reasoner calls during an incident.
For the headless mode introduced in notebook 07, @on_event triggers and the approval gate need a durable event source and a place for the approval step to live outside the cluster’s happy path. OCI Queue (or Streaming) works for the event trigger side. The approval gate itself should not be a Kubernetes admission webhook improvised for the purpose. It is a business control, and it deserves its own service boundary with its own audit log, separate from the harness runtime it is gating.
Network-wise, this deployment needs none of the RDMA or RoCEv2 tuning that matters for GPU training clusters. Standard OCI VCN-native pod networking on OKE is sufficient, and the actual sensitive surface is egress control, since every node process is making outbound calls to an external model API with a credential in the environment. We restricted egress at the security list and network security group level to the specific LLM router and model endpoint domains rather than leaving pods with open internet egress, and we kept the LLMROUTER_API_KEY in OCI Vault, injected at pod start, never baked into an image or committed alongside the .env.example pattern the repo uses for local development.
What I have not verified
I have not run a cost model comparing sustained OKE node pool spend against a serverless or OCI Container Instances deployment for the bursty, event-triggered headless mode, which may be the cheaper answer for low-frequency incident triage rather than a standing node pool sized for peak fan-out.
The chapter 04 to chapter 06 hinge is the right place to focus engineering attention regardless of which shape you land on. A hand-wired graph is a known infrastructure cost. A runtime that writes its own graph is a variable one, and the meter’s job, measuring blast radius honestly, is what turns that variability from a risk into a number you can actually plan capacity against.
Next Steps
To explore the CPU, Kubernetes, networking, and security building blocks behind this architecture, visit Oracle AI Infrastructure. If you want to prototype a lightweight control plane or reasoner fan-out environment, start with Oracle Cloud Free Tier. For a deeper look at the ideas behind this approach, join the Oracle AI World session, Harness Engineering using OCI CPU and OKE