In this blog, I cover how to bring Oracle Cloud Infrastructure (OCI)’s rich Metrics resources over to Datadog to accomplish common goals such DevOps monitoring, application performance monitoring, and so on. Datadog’s API exposes some unique features. Their API allows you to characterize each metric using tags, which is essential to aggregating and correlating data as needed for its monitoring, reporting, dashboards, and so on.
OCI Monitoring
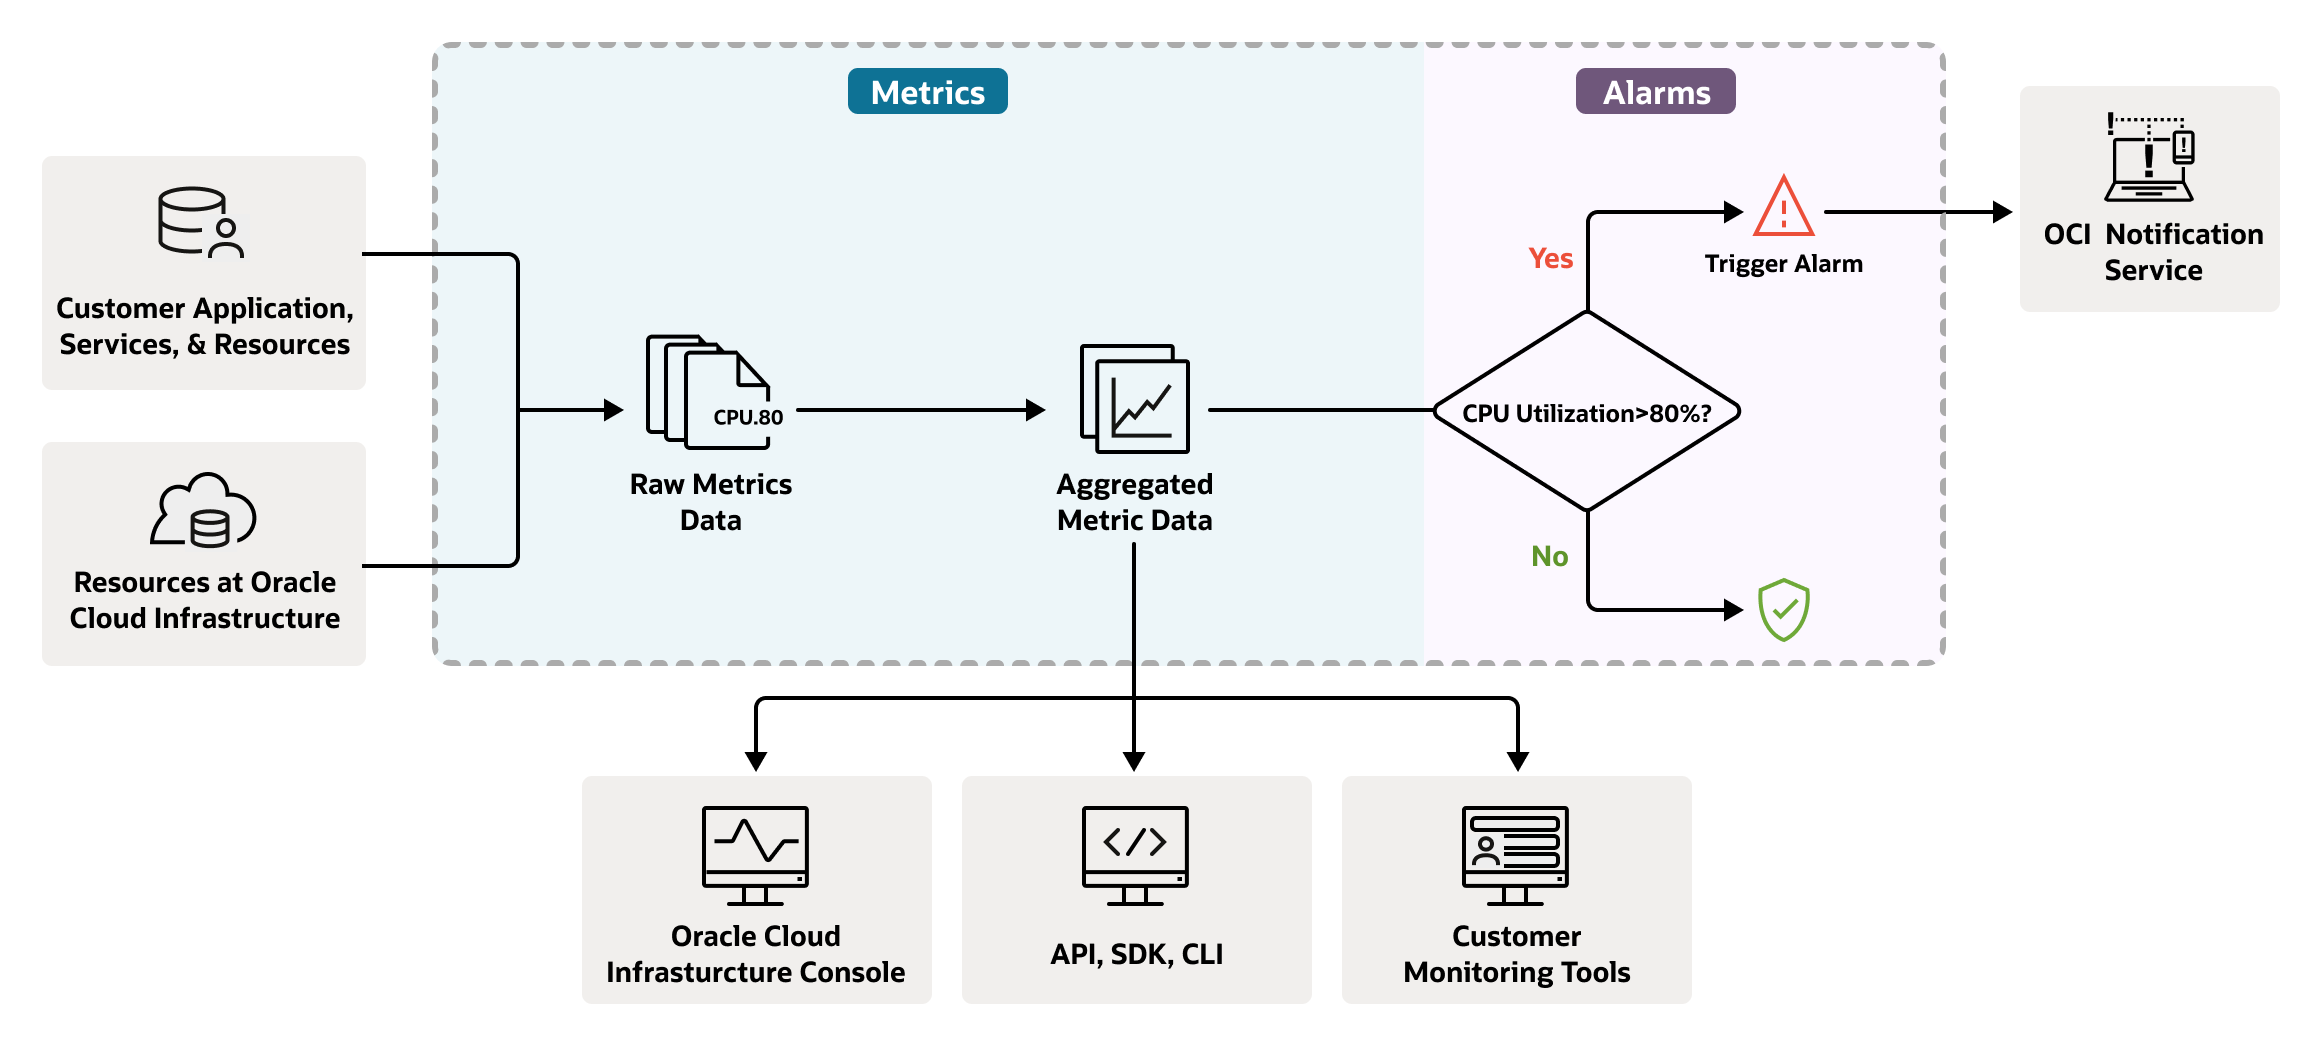
The first OCI service Monitoring service receives these metrics as data points or timestamp-value pairs with dimensions and metadata. Monitoring uses metrics to monitor resources and respond when aggregate metrics cross over thresholds. For more information, see the Overview of Monitoring.
Service Connector Hub
The second service of interest is the Service Connector Hub. The Service Connector Hub manages movement of data between services in OCI. As shown in the following diagram, metrics are consumable by a service connector as a source. For our example, I use that feature to export metrics to Datadog. For details for setting up a monitoring source, see Overview of Service Connector Hub.
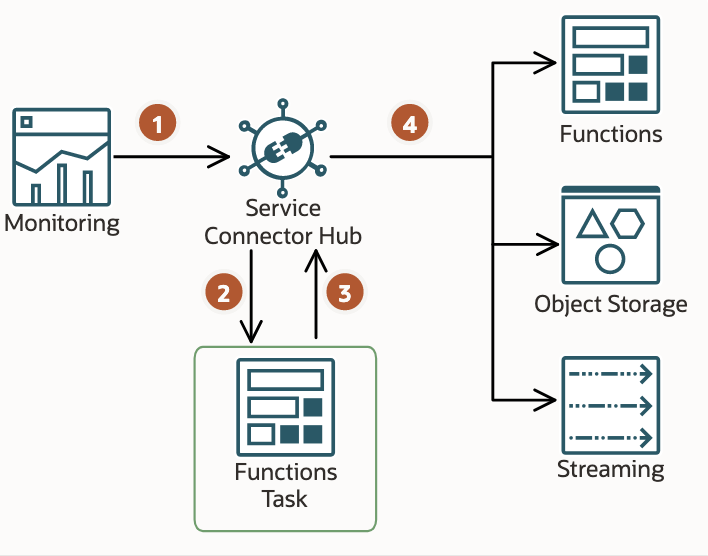
The following steps show the process for Service Connector Hub consuming data:
-
Service Connector Hub reads metric data from Monitoring.
-
If configured, Service Connector Hub triggers a task.
-
The task returns processed data to Service Connector Hub.
-
Service Connector Hub writes the metric data to a target service.
Functions service
The solution calls for a little custom logic to transform between formats and run Datadog API client calls. I also have an event-driven stream of Metric data that must be handled on-demand and at scale. The OCI Functions service is a natural fit for the task. Functions integrate nicely with Service Connectors as a target, so I can focus on writing the logic needed without needing to address how to deploy and scale it.
If you’re new to Functions, get familiar by running through the Quick Start guide on OCI Functions before proceeding.
Logical design
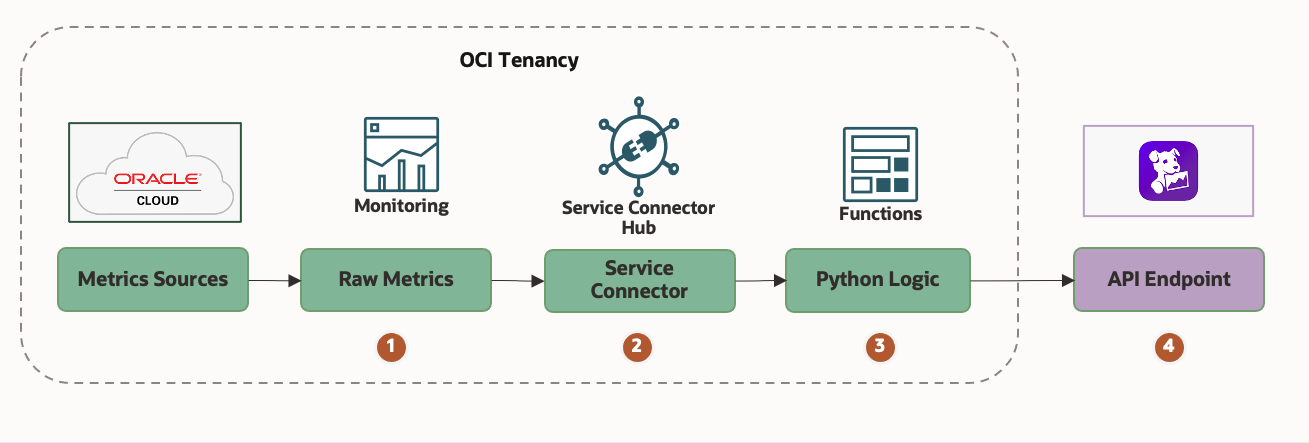
The design uses the following steps:
-
OCI services emit metric data to the Monitoring service.
-
Service Connector Hub connects that metric data source and sends to a target function.
-
The Function transforms the metric data to Datadog format and posts to Datadog API.
-
Datadog ingests the metrics, building its own aggregations using the provided tagging.
OCI metric data format
OCI metrics are emitted as data points, or timestamp-value pairs, dimensions, and metadata. Metrics declare a namespace (category) and a metric name. For example, the Networking service posts metrics for monitoring-enabled virtual cloud network (VCN) instances through the oci_vcn namespace. One of the named metrics in oci_vcn namespace is VnicFromNetworkBytes.
{
    "namespace": "oci_vcn",
    "resourceGroup": null,
    "compartmentId": "ocid1.compartment.oc1...",
    "name": "VnicFromNetworkBytes",
    "dimensions": {
        "resourceId": "ocid1.vnic.oc1.phx..."
    },
    "metadata": {
        "displayName": "Bytes from Network",
        "unit": "bytes"
    },
    "datapoints": [
        {
            "timestamp": 1652196912000,
            "value": 5780.0,
            "count": 1
        }
    ]
}
Datadog data format
Now let’s look at the message format that the Datadog API expects.
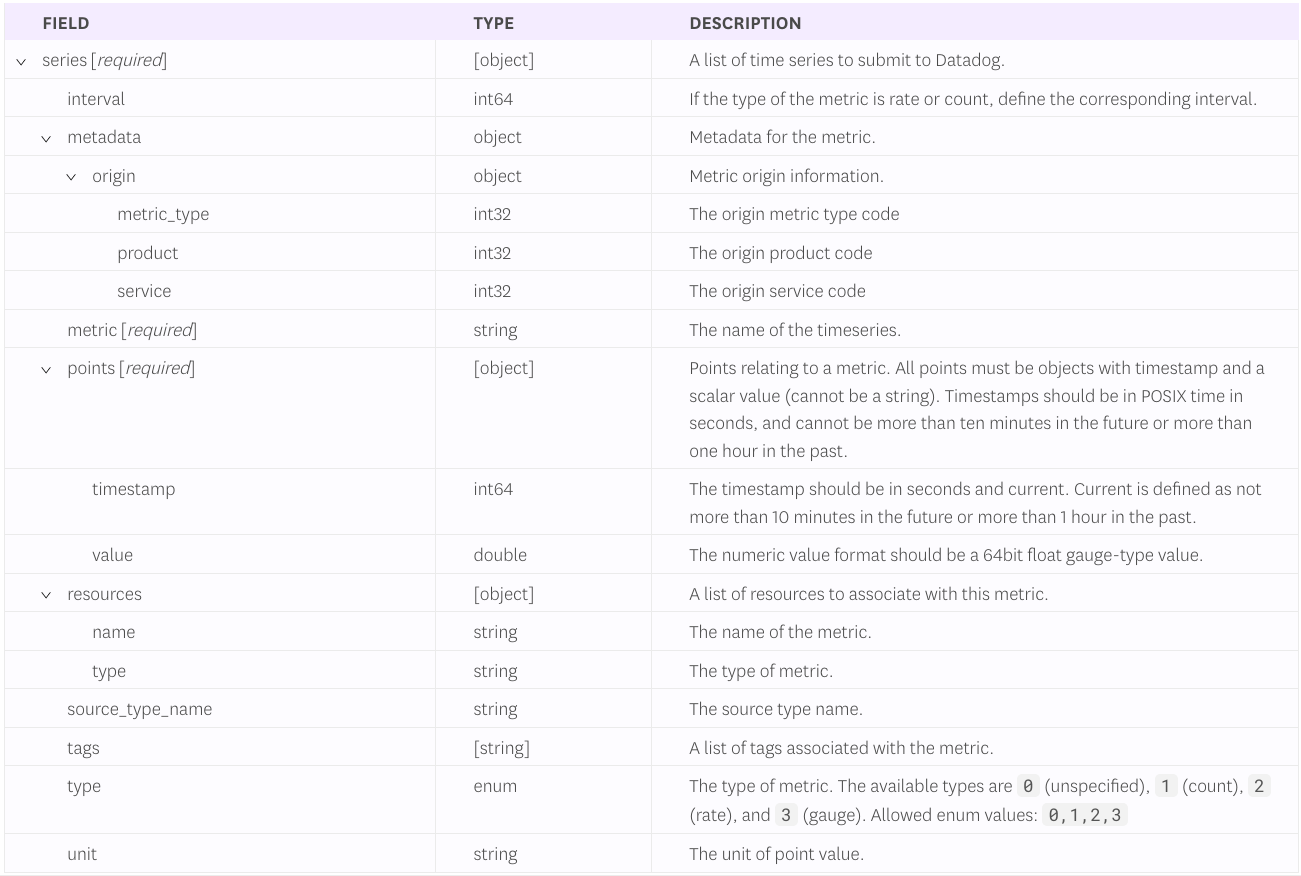
The DataDog metrics API contract defines its inputs as time-series data with the ability to express aggregation tags. The formats are close, but some transformation is required.
{
  "series": [
    {
      "metric": "system.load.1",
      "type": 0,
      "points": [
        {
          "timestamp": 1636629071,
          'value": 1.1
        }
      ],
      "tags": [
        "test:ExampleSubmitmetricsreturnsPayloadacceptedresponse"
      ]
    }
  ]
}
Mapping behavior
To make things clearer, I can show you a pseudo-mapping of OCI JSON attributes to Datadog attributes. These points are easy because we’re using timestamp and metric value. I synthesize a metric name to more closely match the convention in Datadog. Tags are the set of OCI JSON attributes that you want to map over as tags (dimensions) in Datadog. Datadog recommends that you tag attributes that can be aggregated (like host name) and avoid attributes that can’t (like an ID).
{
  "series": [
    {
      "metric": "{re-characterized OCI namespace and metric name values}",
      "type": {mapped_type_enum},
      "points": [
        {
          "timestamp": {datapoint.timestamp},
          "value": {datapoint.value}
        }
      ],
      "tags": [
        "{metrics tag key1:oci payload value}",
        "{metrics tag key2:oci payload_value}"
      ]
    }
  ]
}
Resulting DataDog message
The following example shows a JSON message after transforming from OCI to Datadog format.
{
  "series": [
    {
      "metric": "oci.vcn.vnic.from.network.bytes",
      "type": 0,
      "points": [
        {
          "timestamp": 1652196912,
          "value": 5780.0
        }
      ],
      "tags": [
        "name:VnicFromNetworkBytes",
        "unit:bytes",
        "namespace:oci_vcn",
        "displayName:Bytes from Network"
      ]
    }
  ]
}
Building the function
Let’s look at the implementation details. This example assumes a working knowledge of OCI Functions. In the following sections, you can find the three source files needed to build your Function.
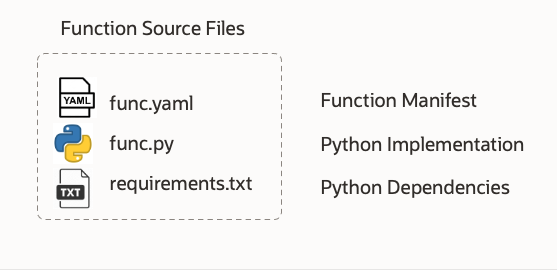
func.yaml
schema_version: 20180708
name: oci_monitoring_metrics_to_datadog
version: 0.0.1
runtime: python
build_image: fnproject/python:3.9-dev
run_image: fnproject/python:3.9
entrypoint: /python/bin/fdk /function/func.py handler
memory: 256
requirements.txt
The Python function only has a few dependencies.
requests
fdk
func.py
The Python function code has some environment variables supported to assist with troubleshooting. The following table calls out each environment variable and what it does.
#
# oci-monitoring-metrics-to-datadog version 1.0.
#
# Copyright (c) 2022, Oracle and/or its affiliates. All rights reserved.
# Licensed under the Universal Permissive License v 1.0 as shown at https://oss.oracle.com/licenses/upl.

import io
import json
import logging
import os
import re
import requests
from fdk import response
from datetime import datetime

"""
This sample OCI Function maps OCI Monitoring Service Metrics to the DataDog
REST API 'submit-metrics' contract found here:

https://docs.datadoghq.com/api/latest/metrics/#submit-metrics

"""

# Use OCI Application or Function configurations to override these environment variable defaults.

api_endpoint = os.getenv('DATADOG_METRICS_API_ENDPOINT', 'not-configured')
api_key = os.getenv('DATADOG_API_KEY', 'not-configured')
is_forwarding = eval(os.getenv('FORWARD_TO_DATADOG', "True"))
metric_tag_keys = os.getenv('METRICS_TAG_KEYS', 'name, namespace, displayName, resourceDisplayName, unit')
metric_tag_set = set()

# Set all registered loggers to the configured log_level

logging_level = os.getenv('LOGGING_LEVEL', 'INFO')
loggers = [logging.getLogger()] + [logging.getLogger(name) for name in logging.root.manager.loggerDict]
[logger.setLevel(logging.getLevelName(logging_level)) for logger in loggers]

# Exception stack trace logging

is_tracing = eval(os.getenv('ENABLE_TRACING', "False"))

# Constants

TEN_MINUTES_SEC = 10 * 60
ONE_HOUR_SEC = 60 * 60

# Functions

def handler(ctx, data: io.BytesIO = None):
    """
    OCI Function Entry Point
    :param ctx: InvokeContext
    :param data: data payload
    :return: plain text response indicating success or error
    """

    preamble = " {} / event count = {} / logging level = {} / forwarding to DataDog = {}"

    try:
        metrics_list = json.loads(data.getvalue())
        logging.getLogger().info(preamble.format(ctx.FnName(), len(metrics_list), logging_level, is_forwarding))
        logging.getLogger().debug(metrics_list)
        converted_event_list = handle_metric_events(event_list=metrics_list)
        send_to_datadog(event_list=converted_event_list)

    except (Exception, ValueError) as ex:
        logging.getLogger().error('error handling logging payload: {}'.format(str(ex)))
        if is_tracing:
            logging.getLogger().error(ex)


def handle_metric_events(event_list):
    """
    :param event_list: the list of metric formatted log records.
    :return: the list of DataDog formatted log records
    """

    result_list = []
    for event in event_list:
        single_result = transform_metric_to_datadog_format(log_record=event)
        result_list.append(single_result)
        logging.getLogger().debug(single_result)

    return result_list


def transform_metric_to_datadog_format(log_record: dict):
    """
    Transform metrics to DataDog format.
    See: https://github.com/metrics/spec/blob/v1.0/json-format.md
    :param log_record: metric log record
    :return: DataDog formatted log record
    """

    series = [{
        'metric': get_metric_name(log_record),
        'type' : get_metric_type(log_record),
        'points' : get_metric_points(log_record),
        'tags' : get_metric_tags(log_record),
    }]

    result = {
        'series' : series
    }
    return result


def get_metric_name(log_record: dict):
    """
    Assembles a metric name that appears to follow DataDog conventions.
    :param log_record:
    :return:
    """

    elements = get_dictionary_value(log_record, 'namespace').split('_')
    elements += camel_case_split(get_dictionary_value(log_record, 'name'))
    elements = [element.lower() for element in elements]
    return '.'.join(elements)


def camel_case_split(str):
    """
    :param str:
    :return: Splits camel case string to individual strings
    """

    return re.findall(r'[A-Z](?:[a-z]+|[A-Z]*(?=[A-Z]|$))', str)


def get_metric_type(log_record: dict):
    """
    :param log_record:
    :return: The type of metric. The available types are 0 (unspecified), 1 (count), 2 (rate), and 3 (gauge).
    Allowed enum values: 0,1,2,3
    """

    return 0


def get_now_timestamp():
    return datetime.now().timestamp()


def adjust_metric_timestamp(timestamp_ms):
    """
    DataDog Timestamps should be in POSIX time in seconds, and cannot be more than ten
    minutes in the future or more than one hour in the past.  OCI Timestamps are POSIX
    in milliseconds, therefore a conversion is required.

    See https://docs.datadoghq.com/api/latest/metrics/#submit-metrics
    :param oci_timestamp:
    :return:
    """

    # positive skew is expected
    timestamp_sec = int(timestamp_ms / 1000)
    delta_sec = get_now_timestamp() - timestamp_sec

    if (delta_sec > 0 and delta_sec > ONE_HOUR_SEC):
        logging.getLogger().warning('timestamp {} too far in the past per DataDog'.format(timestamp_ms))

    if (delta_sec < 0 and abs(delta_sec) > TEN_MINUTES_SEC):
        logging.getLogger().warning('timestamp {} too far in the future per DataDog'.format(timestamp_ms))

    return timestamp_sec


def get_metric_points(log_record: dict):
    """
    :param log_record:
    :return: an array of arrays where each array is a datapoint scalar pair
    """

    result = []

    datapoints = get_dictionary_value(dictionary=log_record, target_key='datapoints')
    for point in datapoints:
        dd_point = {'timestamp': adjust_metric_timestamp(point.get('timestamp')),
                    'value': point.get('value')}

        result.append(dd_point)

    return result


def get_metric_tags(log_record: dict):
    """
    Assembles tags from selected metric attributes.
    See https://docs.datadoghq.com/getting_started/tagging/
    :param log_record: the log record to scan
    :return: string of comma-separated, key:value pairs matching DataDog tag format
    """

    result = []

    for tag in get_metric_tag_set():
        value = get_dictionary_value(dictionary=log_record, target_key=tag)
        if value is None:
            continue

        if isinstance(value, str) and ':' in value:
            logging.getLogger().warning('tag contains a \':\' / ignoring {} ({})'.format(key, value))
            continue

        tag = '{}:{}'.format(tag, value)
        result.append(tag)

    return result


def get_metric_tag_set():
    """
    :return: the set metric payload keys that we would like to have converted to tags.
    """

    global metric_tag_set

    if len(metric_tag_set) == 0 and metric_tag_keys:
        split_and_stripped_tags = [x.strip() for x in metric_tag_keys.split(',')]
        metric_tag_set.update(split_and_stripped_tags)
        logging.getLogger().debug("tag key set / {} ".format (metric_tag_set))

    return metric_tag_set


def send_to_datadog (event_list):
    """
    Sends each transformed event to DataDog Endpoint.
    :param event_list: list of events in DataDog format
    :return: None
    """

    if is_forwarding is False:
        logging.getLogger().debug("DataDog forwarding is disabled - nothing sent")
        return

    if 'v2' not in api_endpoint:
        raise RuntimeError('Requires API endpoint version "v2": "{}"'.format(api_endpoint))

    # creating a session and adapter to avoid recreating
    # a new connection pool between each POST call

    try:
        session = requests.Session()
        adapter = requests.adapters.HTTPAdapter(pool_connections=10, pool_maxsize=10)
        session.mount('https://', adapter)

        for event in event_list:
            api_headers = {'Content-type': 'application/json', 'DD-API-KEY': api_key}
            logging.getLogger().debug("json to datadog: {}".format (json.dumps(event)))
            response = session.post(api_endpoint, data=json.dumps(event), headers=api_headers)

            if response.status_code != 202:
                raise Exception ('error {} sending to DataDog: {}'.format(response.status_code, response.reason))

    finally:
        session.close()


def get_dictionary_value(dictionary: dict, target_key: str):
    """
    Recursive method to find value within a dictionary which may also have nested lists / dictionaries.
    :param dictionary: the dictionary to scan
    :param target_key: the key we are looking for
    :return: If a target_key exists multiple times in the dictionary, the first one found will be returned.
    """

    if dictionary is None:
        raise Exception('dictionary None for key'.format(target_key))

    target_value = dictionary.get(target_key)
    if target_value:
        return target_value

    for key, value in dictionary.items():
        if isinstance(value, dict):
            target_value = get_dictionary_value(dictionary=value, target_key=target_key)
            if target_value:
                return target_value

        elif isinstance(value, list):
            for entry in value:
                if isinstance(entry, dict):
                    target_value = get_dictionary_value(dictionary=entry, target_key=target_key)
                    if target_value:
                        return target_value


def local_test_mode(filename):
    """
    This routine reads a local json metrics file, converting the contents to DataDog format.
    :param filename: cloud events json file exported from OCI Logging UI or CLI.
    :return: None
    """

    logging.getLogger().info("local testing started")

    with open(filename, 'r') as f:
        transformed_results = list()

        for line in f:
            event = json.loads(line)
            logging.getLogger().debug(json.dumps(event, indent=4))
            transformed_result = transform_metric_to_datadog_format(event)
            transformed_results.append(transformed_result)

        logging.getLogger().debug(json.dumps(transformed_results, indent=4))
        send_to_datadog(event_list=transformed_results)

    logging.getLogger().info("local testing completed")


"""
Local Debugging
"""

if __name__ == "__main__":
    local_test_mode('oci-metrics-test-file.json')
Function Configuration
The following table shows the environment variables that the function aspects. Other than the required API endpoint and API token, all the others have default values. The function has a few logging and tracing features that you can turn on to troubleshoot if needed. See the documentation for methods of passing configuration parameters to Functions.
| Environment Variable | Default | Purpose |
|---|---|---|
| DATADOG_METRICS_API_ENDPOINT | not-configured | REST API endpoint for reaching DataDog (see docs) |
| DATADOG_API_TOKEN | not-configured | API license token obtained from DataDog |
| METRICS_TAG_KEYS | name, namespace, displayName, resourceDisplayName, unit | OCI Metric Dimensions and metadata to convert to DataDog Metric Tags |
| LOGGING_LEVEL | INFO | Controls function logging outputs. Choices: INFO, WARN, CRITICAL, ERROR, DEBUG |
| ENABLE_TRACING | False | Enables complete exception stack trace logging |
| FORWARD_TO_DATADOG | True | Determines whether messages are forwarded to DataDog |
Policy setup
You need a specific policy that lets the Service Connector invoke your function.
allow any-user to use fn-function in compartment id ocid1.compartment.oc1... where all {request.principal.type=’serviceconnector’, request.principal.compartment.id=’ocid1.compartment.oc1...’}Dynamic group setup
The Function doesn’t make any OCI API calls, so a dynamic group isn’t strictly required. However, for completeness, I added it as a reminder if you need it later.
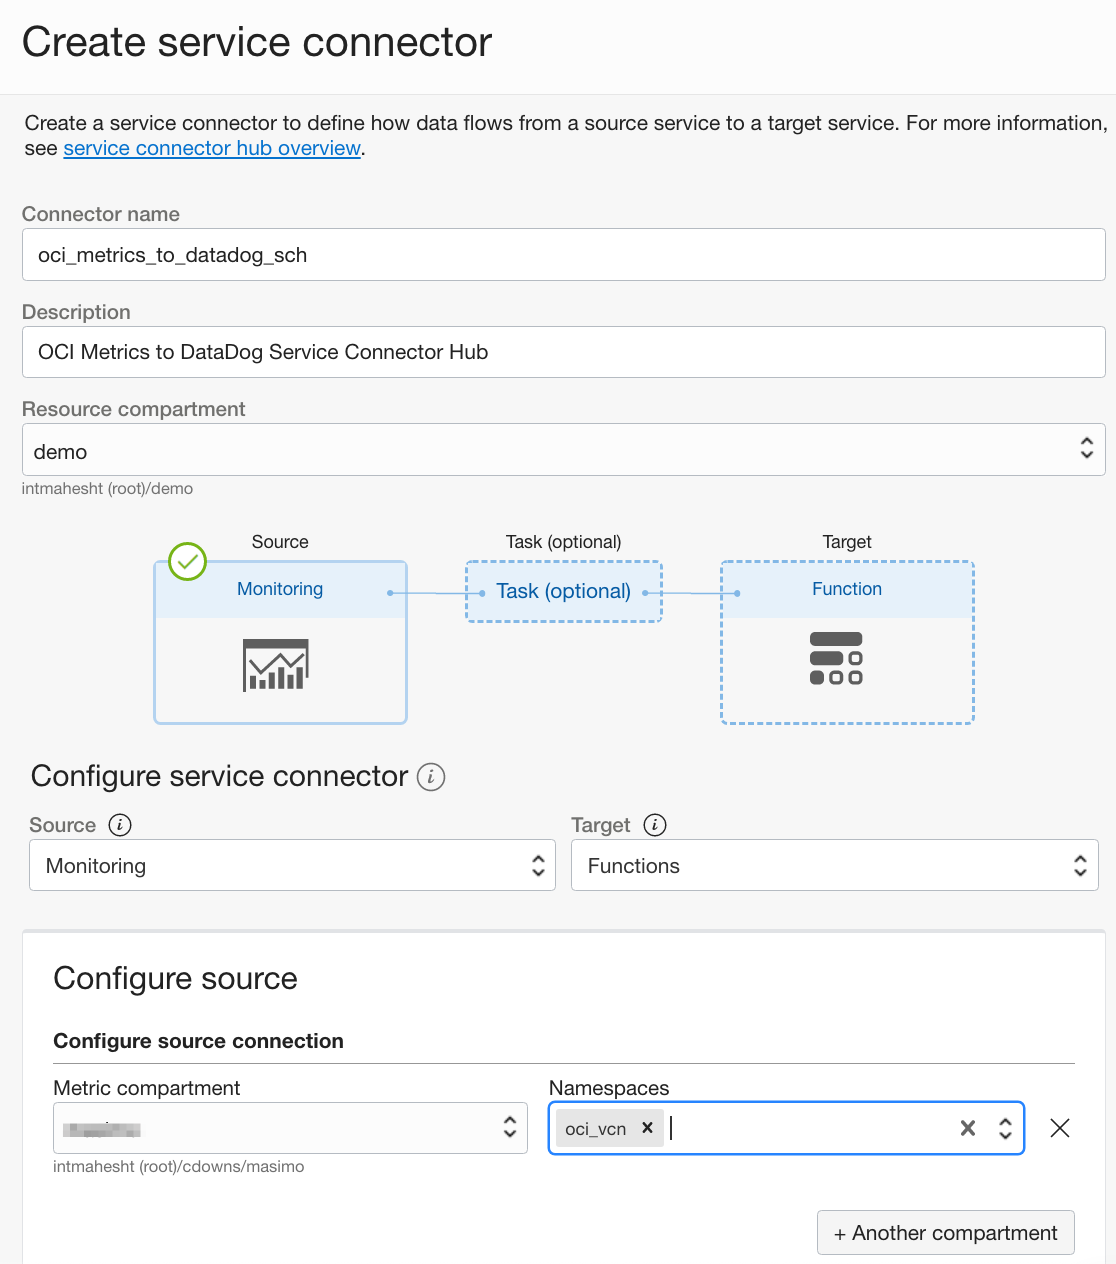
ALL {resource.type = ’fnfunc’, resource.compartment.id = ’ocid1.compartment.oc1...’}Service Connector setup
Now let’s set up a simple service connector instance that takes Monitoring sources and passes them to our function. I use a VCN as my metric data source. Functions require a VCN, so we have one readily available to monitor. Select Monitoring as the source and the function as the target. Configure your source as the compartment where your VCN resides and the Monitoring namespace (oci_vcn) that you want to pick up. Set your function application and the function within it as the target.
After saving, the Service Connector starts to send metrics. If you don’t see metrics appearing in Datadog, see the Troubleshooting section.
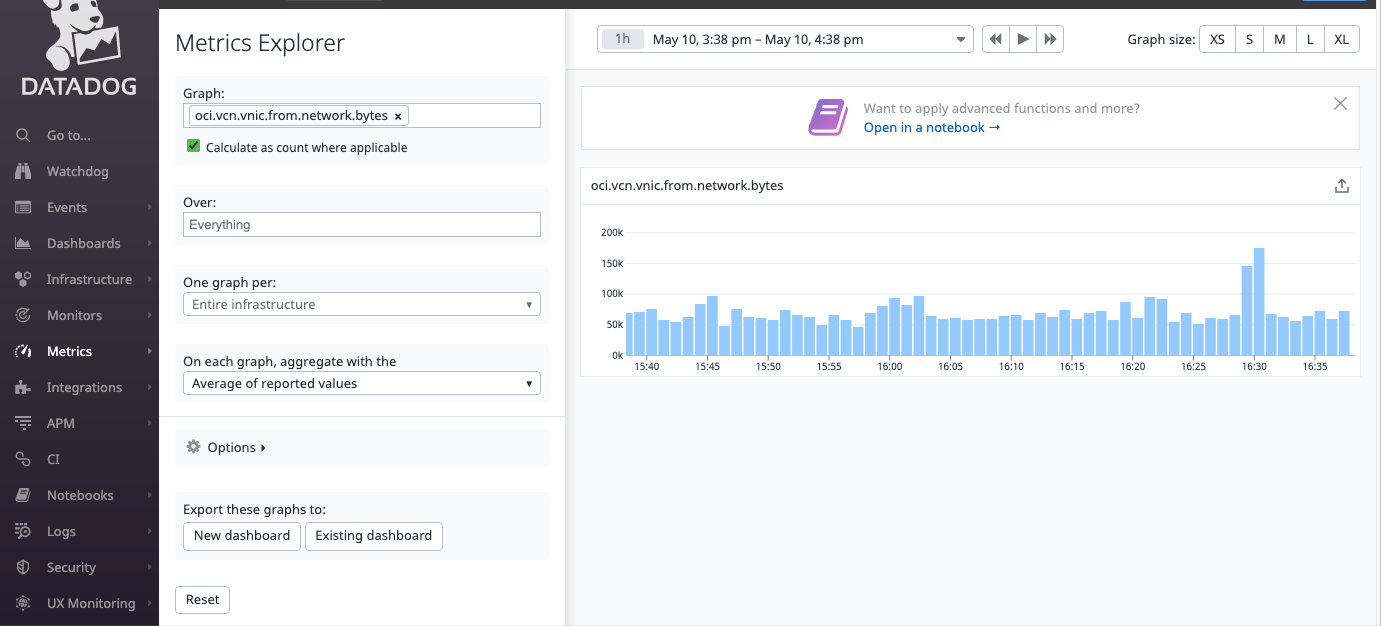
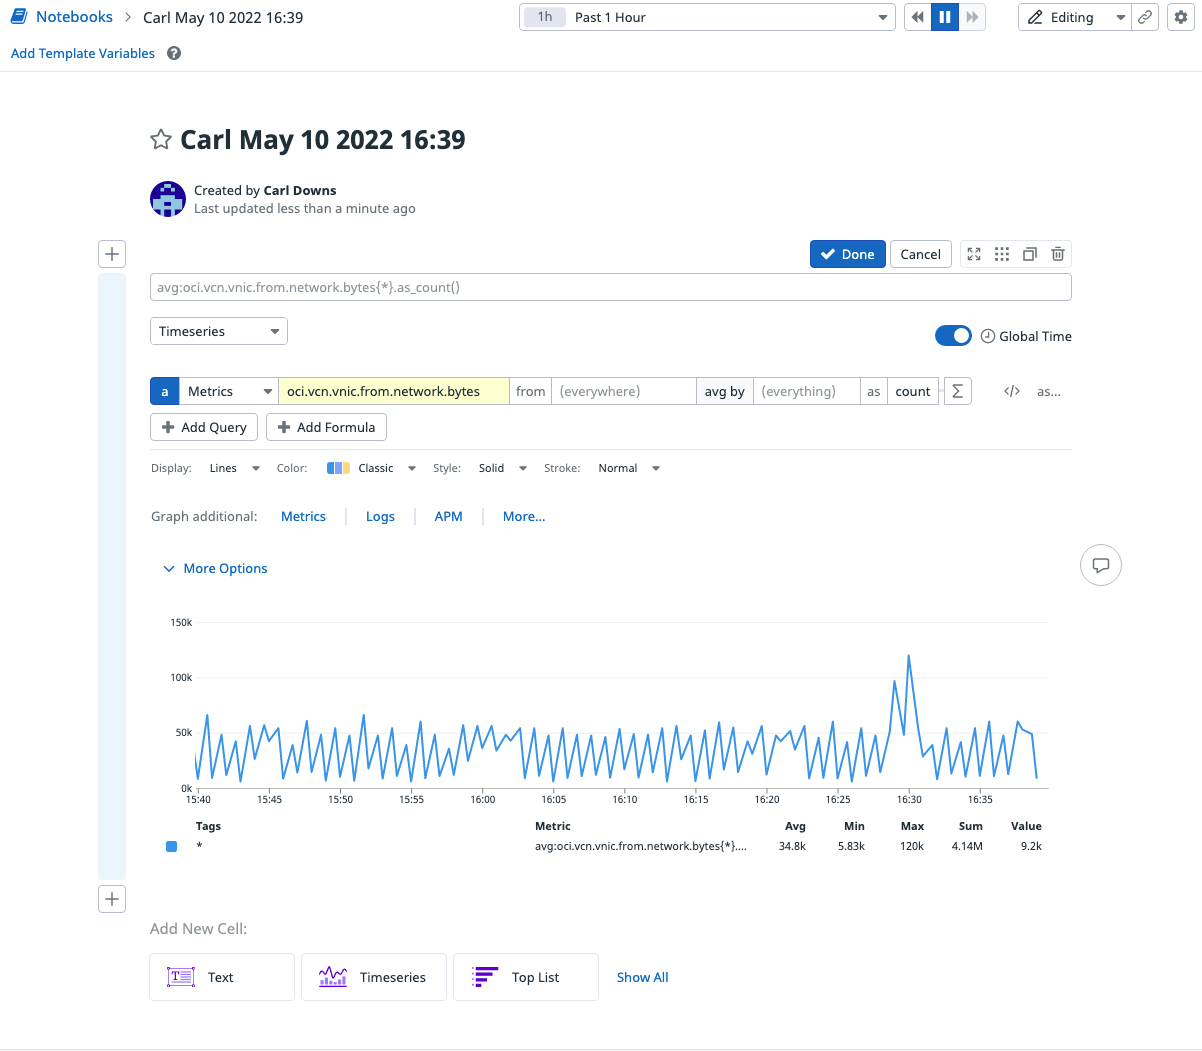
View metrics In DataDog
When you have the Service Connector configured, metrics appear in Datadog’s Metrics Explorer and notebooks after a few minutes. The following images show the Metrics Explorer and Notebook user interfaces in Datadog. Your VCN metrics are displayed.


Troubleshooting
Nothing is happening
Enable service logs for your function. Also set the function environment variable LOGGING_LEVEL to DEBUG to get a detailed output in your ‘invoke’ service logs. These can be enabled on the Function page of the Application you created.
Timeouts
If your function is timing out at 30 seconds, you can extend the max time to run at 300 seconds. For information on changing default timeout and memory settings, see the documentation. A better approach is to increase the number of function instances that are kept active to handle inbound metrics calls. For more information, see Enabling Asynchronous Operations.
Timestamp X too far in the past for Datadog
This warning tells us that by the time Service Connector Hub passes the metric data to the function, the data is too stale to send to Datadog. This error occurs when metrics’ arrival rate is overwhelming the Service Connector Hub scheduler. The simplest way to solve this issue is to use more Service Connector Hub instances to address it. Try setting up a Service Connector Hub instance for Monitoring namespace.
Conclusion
You now have a low-maintenance, serverless function that can send raw metrics over to DataDog in near-real time. I encourage you to experiment with the dimensions and metadata tag mappings to see which combination works best for your use case. For more information, see the following resources: