Managing Kubernetes environments can feel like navigating a storm—dynamic, complex, and, at times, overwhelming. OCI Kubernetes Engine (OKE) offers a powerful arsenal of monitoring and observability tools that help bring order to that chaos. Whether you’re relying on native OCI dashboards, tapping into the flexibility of open-source solutions, or investing in robust third-party platforms, the right dashboards can transform your OKE experience. This blog explores the essential monitoring options available, helping you stay ahead of performance issues, streamline operations, and maintain high availability across your Kubernetes landscape.
OCI Native Dashboards
OKE Monitoring Dashboards
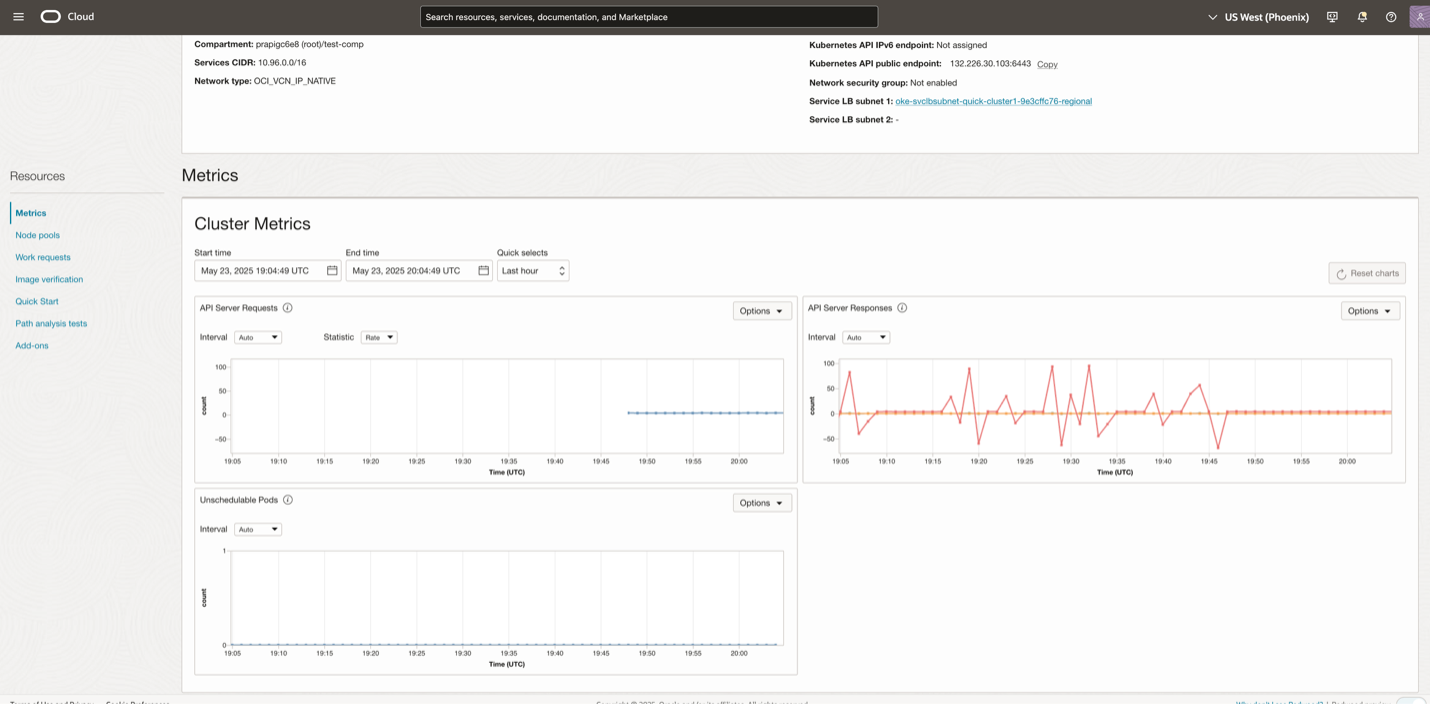
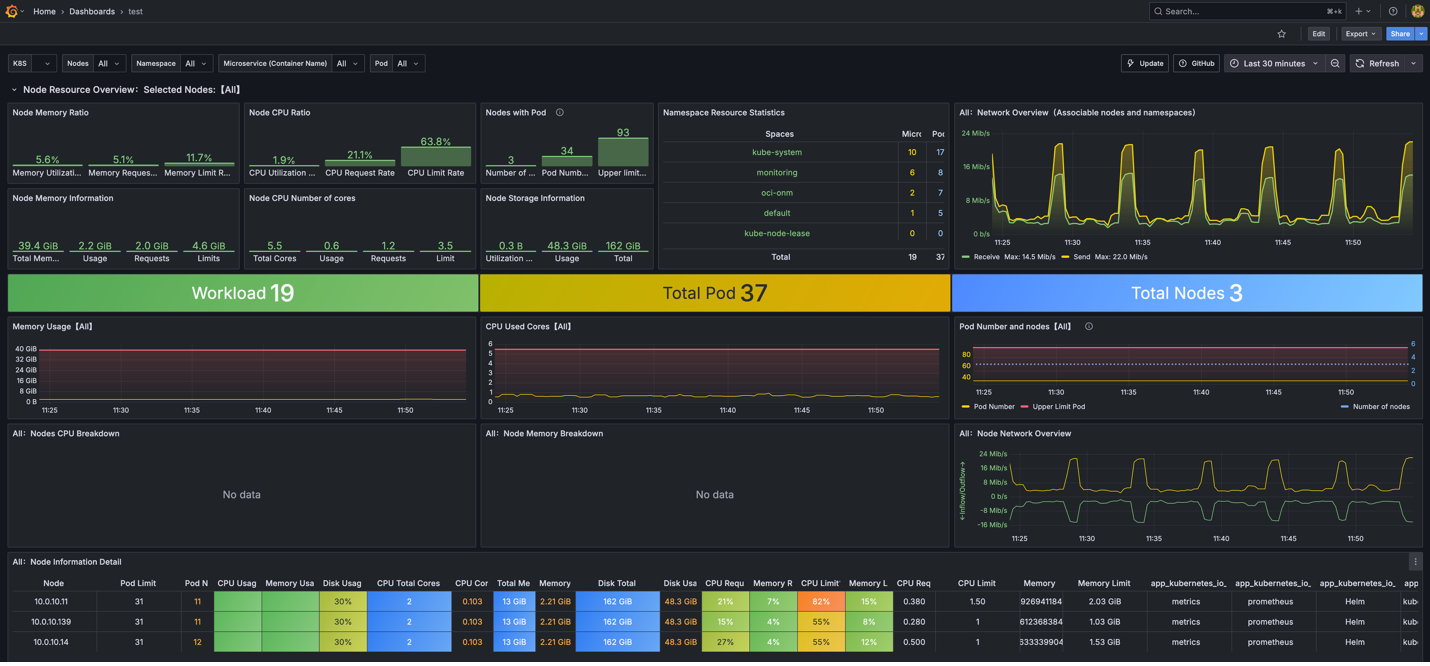
Oracle provides built-in dashboards for monitoring the performance, health and resource usage of your OKE clusters. These dashboards display various metrics, including node status, CPU, memory usage, network activity, and pod performance.
Key Features:
- Cluster-level Metrics: At the highest level, dashboards present an overview of the entire cluster’s health and performance. You can monitor key metrics such as overall CPU, memory, and disk usage, as well as the status of all nodes in your cluster.
- Namespace & Pod Metrics: For more granular monitoring, these dashboards allow you to drill down into individual namespaces and pods. Here, you can track resource consumption, availability, and error rates for specific workloads.
- Service Metrics: The dashboards also visualize the performance of services running within your Kubernetes cluster. By monitoring service-specific metrics, you can assess the responsiveness and reliability of your applications, helping you maintain optimal user experiences.
Log Analytics Dashboards
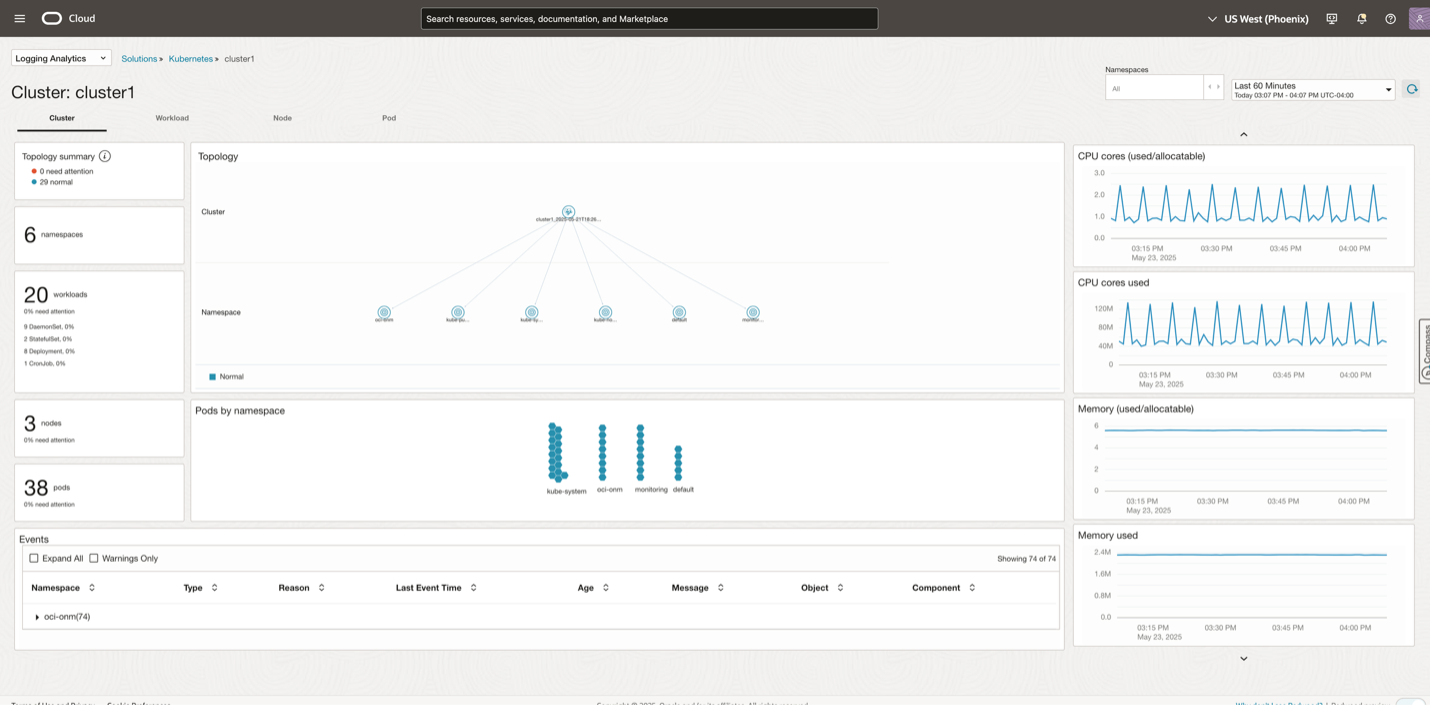
Log Analytics Dashboards in OKE enable users to visualize and analyze log data from OCI services and Kubernetes components. With features like automatic tagging, powerful querying, and intuitive visualizations, these dashboards simplify troubleshooting and provide operational insights. Pod and Node Log Dashboards also allow viewing logs from individual pods and nodes.
Key Features:
- Log aggregation and visualization: The dashboards aggregate log data from OKE clusters and other OCI resources, presenting them in a unified interface for easier monitoring and analysis.
- Automatic Metadata tagging of log entries: Logs are automatically tagged with relevant metadata, including pod names, namespaces, and application names. This makes it easier to filter and search logs based on specific Kubernetes entities.
- Built-in log query capabilities: Users can utilize built-in log query tools to search through logs and create customized views, enabling tailored monitoring and rapid root-cause analysis.
Dashboard Layout and Functionality at a glance
This image illustrates a typical Log Analytics dashboard in OKE that includes Cluster Overview, Topology Visualization, Resource Utilization Panels, Log Entry Table and Customizable Views.
Open-Source Dashboards
Prometheus Dashboards
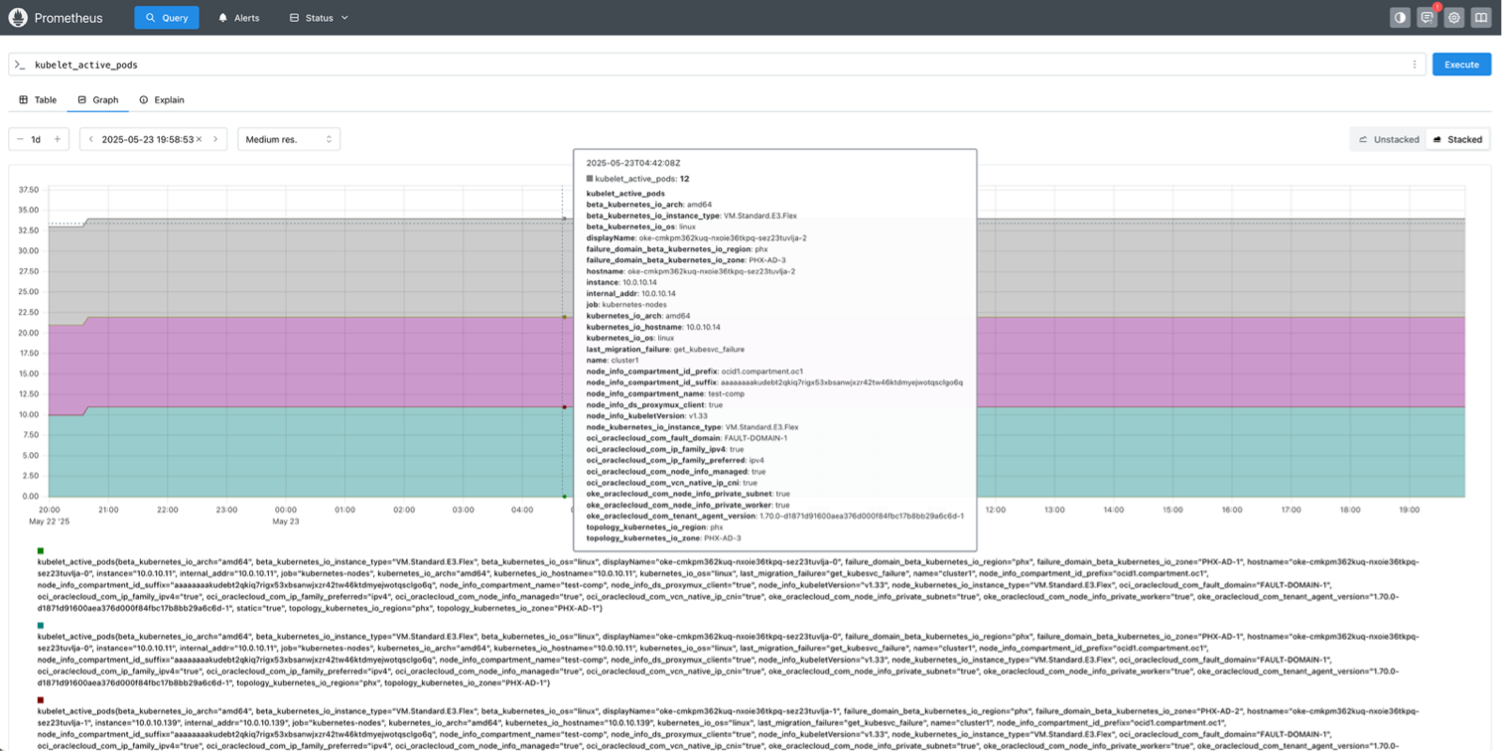
Prometheus has become the de facto standard for monitoring Kubernetes environments, including OKE. Its robust metrics collection, flexible querying, and integration with visualization tools like Grafana make it a core component for observability in cloud-native deployments.
Key Features:
- Time series Metric Visualization: The central graph shows the metric data (such as CPU or memory usage) across multiple pods or nodes over a 24-hour period, with data stacked to illustrate totals across multiple nodes.
- Detailed Metadata: Hovering over a data point reveals rich metadata, including node architecture, instance type, zone, hostname, internal and external IP addresses, and Oracle Cloud-specific identifiers. This contextual information is crucial for troubleshooting and understanding the environment in which each metric is collected.
- Query Interface: The query bar at the top allows users to run custom PromQL queries, enabling flexible exploration of cluster metrics. In this case, kubelet_active_pods provides a direct view into pod activity at the node level.
- Time Range and Resolution Controls: The interface allows users to select custom time ranges and adjust the resolution of the data, supporting both high-level trends and granular analysis
Grafana Dashboards
Grafana integrates with Prometheus to provide visualization for OKE, offering pre-built dashboards that display key Kubernetes metrics such as CPU, memory, disk I/O, pod counts, and network traffic. These dashboards help users quickly assess cluster health and performance.
Key Features:
- Highly customizable dashboards: Grafana allows users to create and modify dashboards to fit their specific operational needs. Panels can be arranged and configured to display any metric available from Prometheus or other data sources, supporting a wide range of visualization types such as time series graphs, heatmaps, tables, and histograms.
- Multi-Source Data Integration: Grafana supports integration with over 150 data sources, including Prometheus, Grafana Loki, SQL databases, and cloud monitoring services. In OKE, this means users can unify cluster metrics, application logs, and external data into a single dashboard, streamlining monitoring and troubleshooting workflows.
- Pre-Built and Community Dashboards: Grafana provides a variety of pre-built dashboards for Kubernetes, OKE, and related services, which can be used out-of-the-box or further customized. Community-contributed dashboards are also widely available, offering modern designs and best-practice visualizations for common OKE monitoring scenarios.
Commercial Dashboards
DISCLAIMER: This is not a comprehensive list; many other commercial dashboard solutions are also available and supported in OKE.
Datadog
Datadog offers a full-stack monitoring solution with real-time metrics, logs, and traces, enabling users to track the health and performance of Kubernetes clusters, containers, and applications. Its integration with OKE makes it easy to visualize metrics across multiple services and set up automated alerts to detect issues before they escalate.
Key Features:
- Kubernetes Cluster Dashboards: Visualizes the health and performance of the Kubernetes clusters with metrics for nodes, pods, and namespaces.
- Application Performance Dashboards: Includes APM (Application Performance Monitoring) features that give insights into application-level metrics, traces, and logs.
- Custom Dashboards: Allows users to create their own dashboards to monitor custom application metrics and other specific use cases.
Sysdig
Sysdig represents a comprehensive container-native monitoring and security platform that provides deep integration capabilities with Kubernetes environments, particularly OKE. The platform’s architecture is built on open-source foundations, incorporating industry-standard tools like Falco for runtime threat detection and supporting Prometheus compatibility for monitoring.
Key Features:
- Kubernetes Infrastructure Dashboards: Provide real-time health metrics for monitoring cluster status, resource allocation, and node and service performance in OKE.
- Application Performance Dashboards: Allow teams to track key metrics called Golden Signal Metrics which includes latency, traffic, errors, and saturation for microservices, offering a comprehensive view of service health.
- Security Dashboards and Threat Detection: Use Falco-based rules for real-time threat detection, vulnerability management, and compliance monitoring across containers and registries.
- Advanced Monitoring Capabilities: Deliver scalable, enterprise-grade Prometheus monitoring with automated scaling, long-term retention, and high availability, all compatible with open-source Prometheus.
Lens IDE/OpenLens
Lens is widely recognized as a popular Integrated Development Environment (IDE) for Kubernetes, offering a powerful and intuitive graphical interface that dramatically simplifies the management and monitoring of Kubernetes clusters, including those running on OKE. With Lens, users can connect to and manage multiple clusters in OKE from a single unified dashboard. OpenLens, the open-source foundation of Lens, delivers much of this core functionality, making it a compelling choice for users seeking a free, community-driven solution. OpenLens provides a unified interface for managing and observing Kubernetes clusters, offering essential features such as cluster management, real-time monitoring, and enhanced visualization of resources.
Key Features:
- Integrated context-aware terminal: This automatically matches the correct kubectl version and context for each cluster.
- Built-in Prometheus metrics: Used for live resource monitoring, comprehensive logging, and role-based access control (RBAC) for secure, multi-user environments.
- Helm chart management: Lens also supports Helm chart management, enabling users to deploy and update applications efficiently, and offers workspaces for organizing clusters and configurations at scale.
Turning Metrics Into Meaning
Achieving full visibility into your Oracle Kubernetes Engine environment isn’t about choosing one tool— it’s about crafting the right blend for your specific needs. Native OCI dashboards deliver seamless, built-in observability; open-source platforms like Prometheus and Grafana offer unmatched customization; and enterprise-grade solutions like Datadog, Sysdig, etc. elevate your monitoring game with powerful features and expert-backed insights. The key is not just monitoring for the sake of it— but turning metrics into meaningful action. With the right mix in place, your teams can shift from reactive firefighting to proactive performance management, ensuring your OKE clusters remain resilient, reliable, and ready for whatever comes next.
Enhanced monitoring in OKE with Logging Analytics
Monitor Oracle Cloud Infrastructure with Datadog
Sysdig Monitoring & Security for Oracle Cloud – OKE and Oracle Linux