“Reporting & Analytics is the ability to gain insights into cloud data by creating reporting mechanisms to serve the needs of the organization’s various persona groups. Reporting can detail, highlight, summarize, categorize, and compare cloud data to support ad hoc reporting, showback, investigative reports or routine reporting used by the organization. This is one of the most important and critical of the FinOps capabilities, supporting almost every other Capability. “
This blog will discuss an Oracle cloud cost reporting solution focused on the capabilities of Oracle Analytics Cloud (OAC) and Artificial Intelligence.
Current OCI Native Cost Reporting Capabilities
- Cost Analysis can help you visualize and track your spending based on an array of dimensions and filters, e.g., Tags, Service, Compartment, Sku’s, Tenancy, etc.
- Cost Reports give you a breakdown of your invoice line items at resource-level granularity. This allows you to make better-informed cloud spending decisions, optimize, forecast and allocate costs.
Challenge
Cost reports are generated every 6 hours and provide a breakdown of consumption at the resource level every hour. Many files are generated, and the csv’s can include millions of rows of consumption data, which makes effectively and efficiently using these files difficult.
Oracle based cost reporting solution “Usage2ADW”
Usage2adw is an automated Python-based tool to extract cost reports from an OCI tenancy and load them into Oracle Autonomous Database. Having cost reports stored in Autonomous Database enables you to easily integrate with BI platforms as well as incorporating AI into the analysis of consumption within OCI. Additionally, Usage2ADW allows for the loading of additional details of each resource type within your environment by utilizing a Python-based tool called ShowOCI.
For details on setting up Usage2ADW, see the following resources below:
Addition of Oracle Analytics Cloud
Oracle Analytics Cloud has built-in capabilities that address the entire data and analytics process including ingestion and modeling, preparation and enrichment, and visualization and collaboration, without compromising security and governance. The AI assistant is included with OAC and allows different personas to easily create customizable dashboards based on the cost and usage data of their tenancies using regular language prompts.
Usage2ADW2OAC can provide a lower-cost FinOps tool that can aid in some of the top priorities of FinOps practitioners:
| “Workload optimization and waste reduction” | “Rate Optimization” |
| “Full allocation of cloud spending” | “Multi-cloud cost reporting” |
| “Accurate forecasting of spend” | “Enabling automation” |
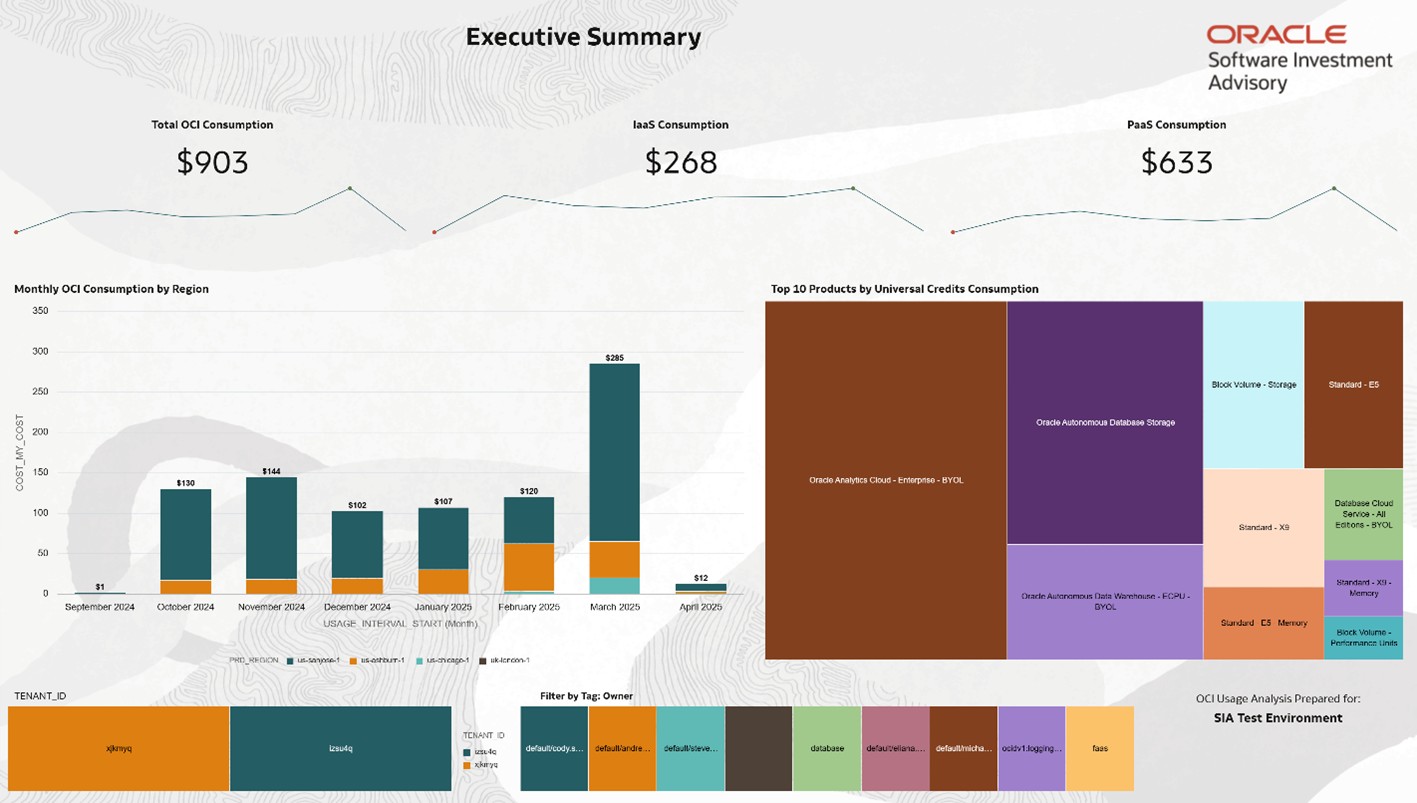
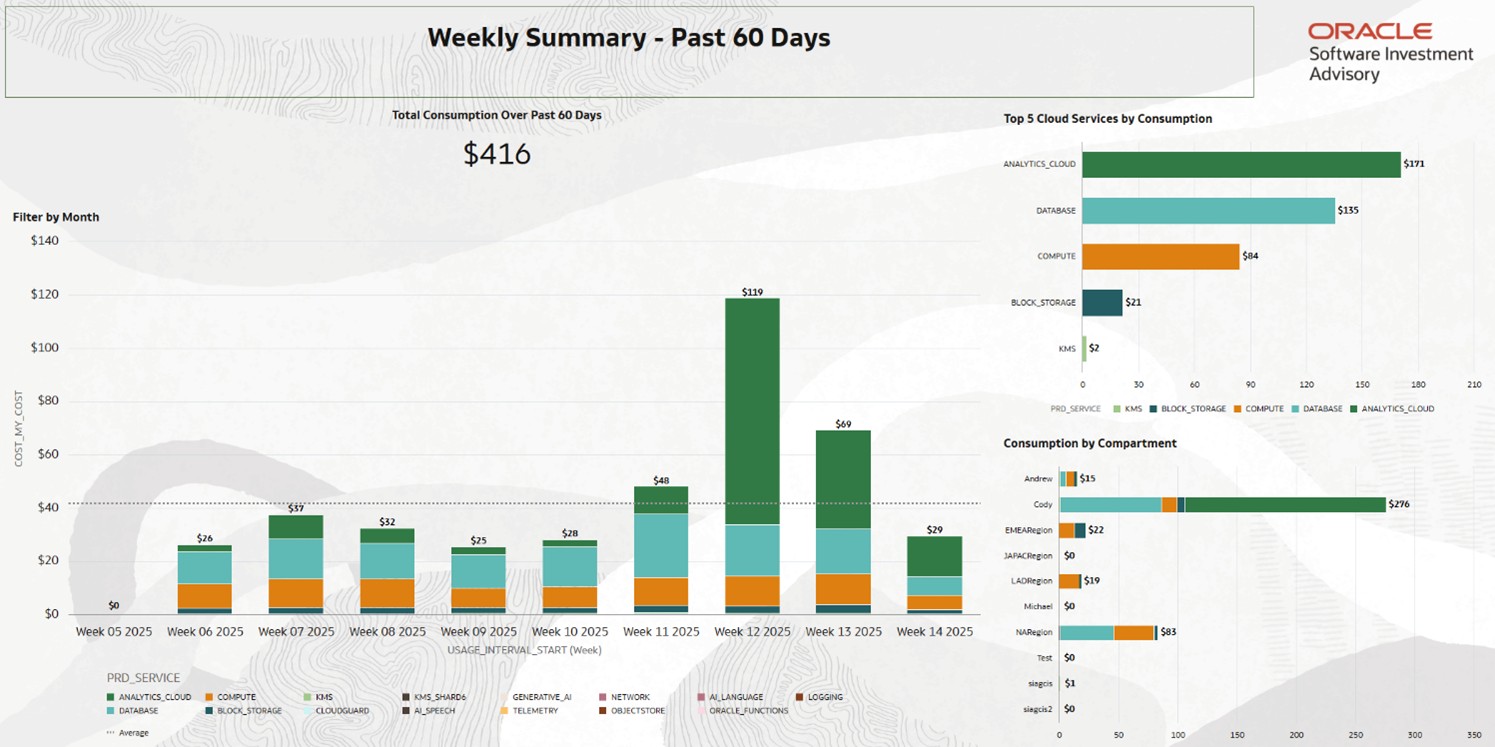
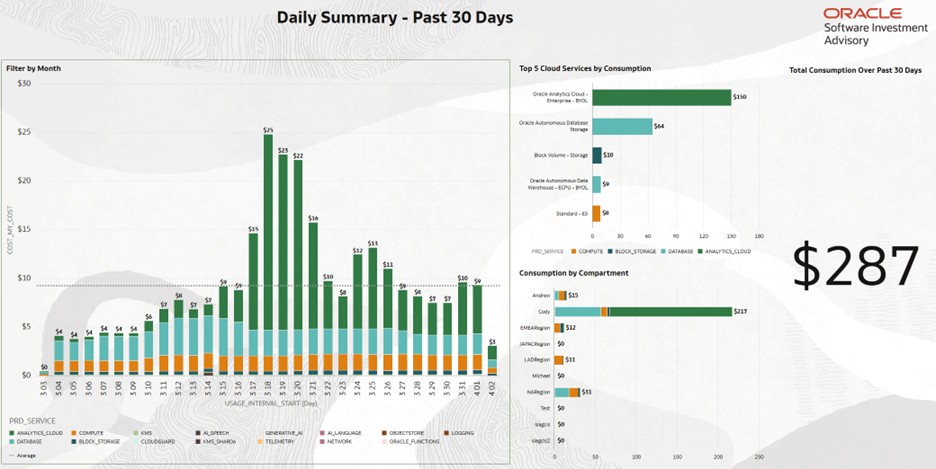
Dashboard overview examples
Below are screenshots of example reports you can customize and save that are automatically updated as cost reports are generated within OCI.
Weekly Summary:
Daily Summary:
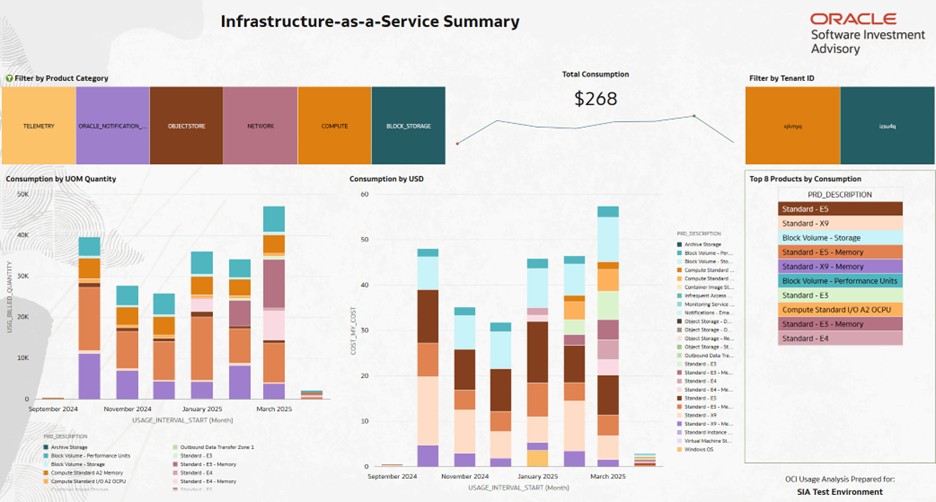
IaaS Summary:
The full Dashboard includes other canvases including:
| Executive summary | Tag Audit |
| Monthly Summary | PaaS Summary |
| Annual Summary | Summary by Subscription |
| Summary by Service | Database Summary |
| Cost Allocation | Bring Your Own License Summary |
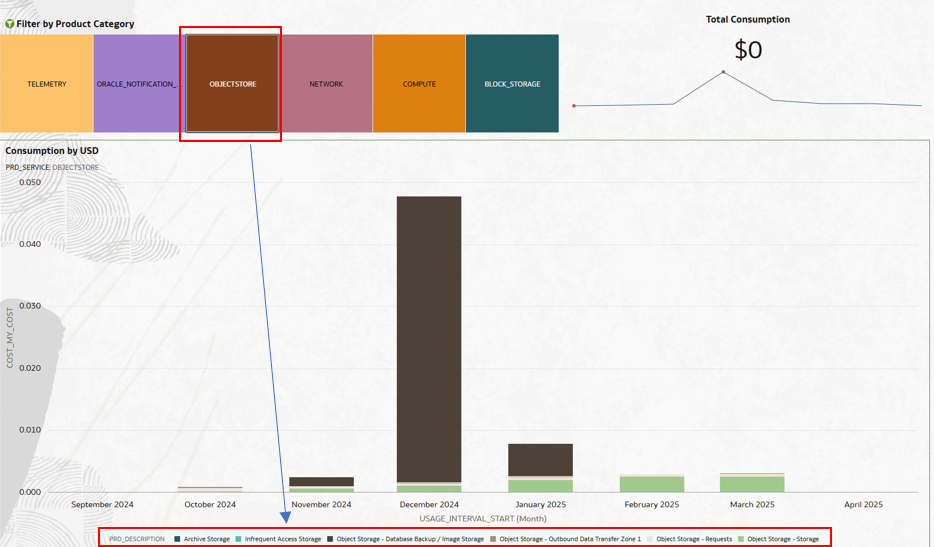
OAC allows for live filtering of the data on any parameter in the cost and usage report (e.g. Tenancy, Service level, Compartments, Tags, etc.). The example below shows the IaaS summary filtered with only object storage level Sku’s:
OAC allows for additional flexibility compared to the cost analysis tool within the OCI console. OAC allows for slicing the consumption data by multiple dimensions as well as the ability to share customizable report canvases. For example, you can create multiple canvases with pre-built reporting to target different personas, e.g., engineering, finance, leadership, practitioners, etc.
Leverage Gen AI via AI assistant & OCI Gen AI service
AI Assistant
The Analytics AI Assistant helps users ask questions and get data visualizations generated by the AI Assistant using their Dataset and an LLM.
https://blogs.oracle.com/analytics/post/oracle-analytics-ai-assistant-getting-started-in-3-steps
Utilizing this out-of-the box AI functionality within OAC allows for easy generation of visuals and insights for any persona and skill level. Each generated chart can easily be added to the main canvas by dragging or clicking the “plus” symbol.
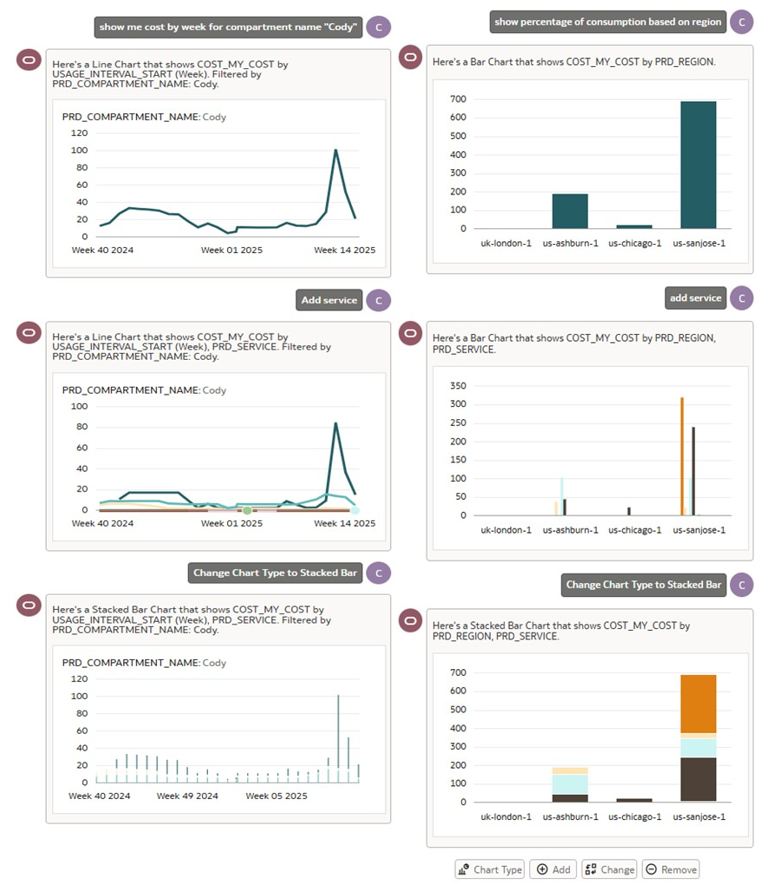
Below are some examples of how AI assistant can help generate insights into your cloud consumption data:
Example1 | Example 2 |
|---|---|
| Prompt1: Show me cost by week for compartment “Cody” | Prompt1: show percentage of consumption based on region |
| Prompt2: Add service | Prompt2: add service |
| Prompt3: change chart to stacked bar | Prompt3: change chart to stacked bar |
| Example 3 |
|---|
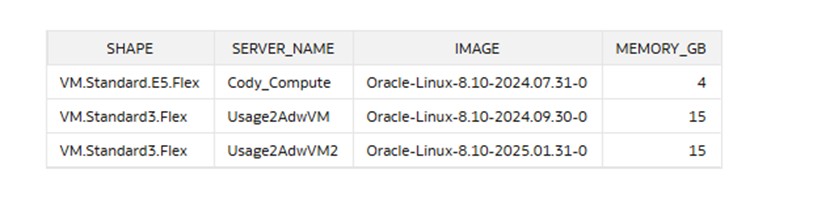
| You can also use AI assistant to analyze insights into the ShowOCI output. |
| Recall ShowOci is an optional portion of usage2adw that extracts a collection of data on the resource level for resources in your tenancy |
| Prompt1: Show me server name OCPU’s and Memory (Output a scatter showing my 2 instances, each instance is 1 OCPU one with 4MB of Memory and 15MB of Memory. |
| Prompt2: show me the shapes of my servers. (Output a table displaying the shapes of my instances) |
| Prompt3: add server name. (Adds server name to the table of shapes) |
| Prompt4: add image. (Adds image name to the table of shapes & server names) |
| Prompt5: add memory. (Output are bar graphs that shows memory by shape, server name, and image |
| Prompt6: Change to table |
Overall output is a table with my instances and their shapes, names, images, and memory.
Conclusion
By combining Usage2ADW, Oracle Analytics Cloud, and Oracle’s AI Assistant, you can create a comprehensive and low-cost FinOps reporting solution. This setup enables you to extract, load, visualize, and analyze cost data efficiently, helping your organization optimize cloud spending and make informed financial decisions regarding OCI usage.
The Oracle GLAS FinOps team is available for more information on this solution and/or a live demo.
https://www.oracle.com/corporate/global-licensing-advisory-services/finops/