Using Oracle Cloud Infrastructure (OCI) Dashboards service, service, you can derive insights, observe trends, and diagnose issues all from a single location in the Oracle Cloud Console. Can Dashboards be used by your FinOps team for cloud financial management? Yes! In this article, we show how the new cost management widget enables you to create dashboards for a quick yet comprehensive financial insights.
Welcome to Dashboards
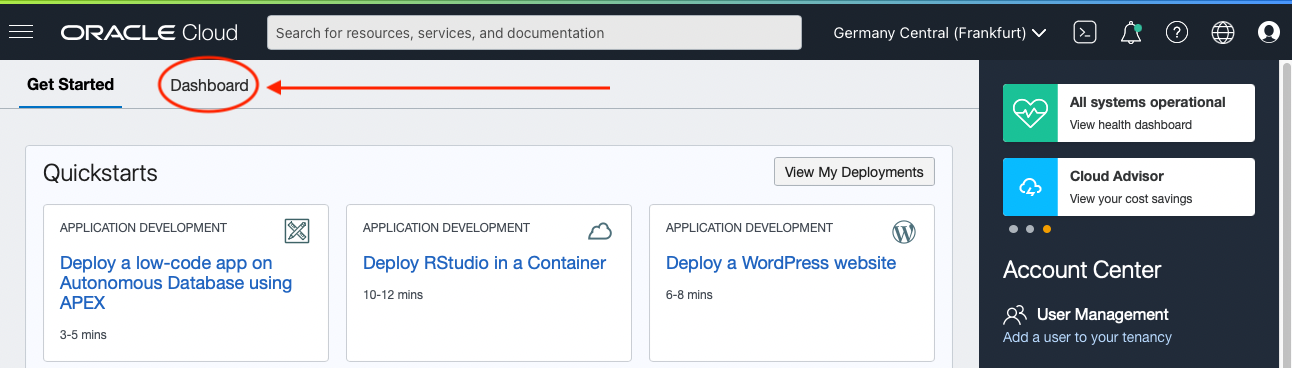
Log into your OCI account. On the homepage, you see a new tab called Dashboard.
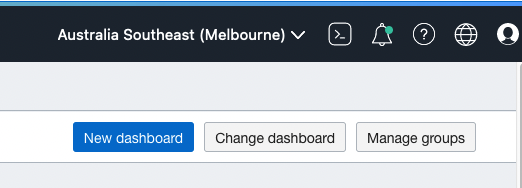
Clicking the link takes you to the default dashboard. On this page, you can create a new dashboard by clicking the New Dashboard button.
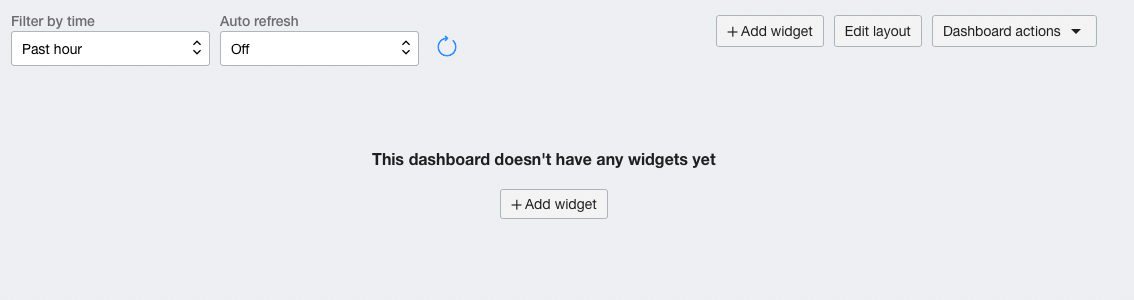
Give your dashboard a name, place it in a compartment, add it to a new dashboard group, and click the Create button. We now have a blank canvas to start adding widgets.
Your financial view
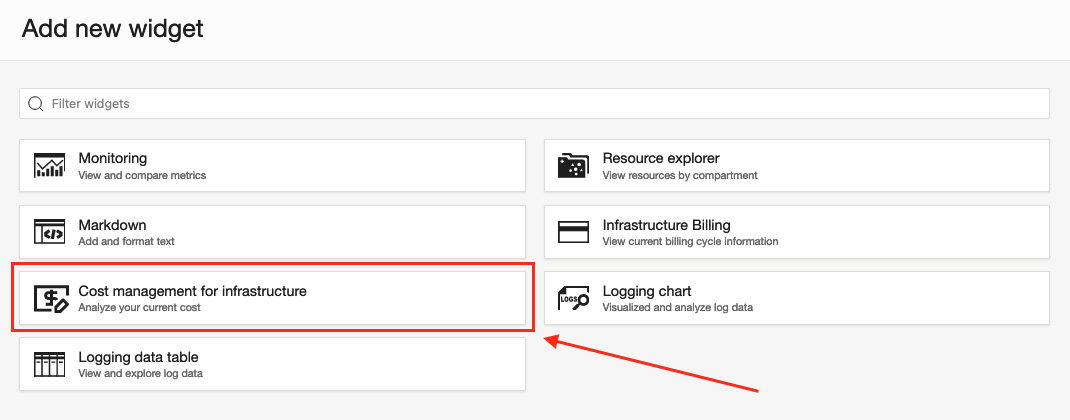
To create a cost management widget, click the +Add widget button. Select the cost management widget from the list of widgets.
Here, we have a few options, but we want the Cost Management chart.
After selecting this chart, you can see it on your dashboard. The default tile shows the cost by service over the past seven days. You can customize your widget by clicking the three-dot menu in the widget and selecting View and edit settings.

Let’s customize the following attributes of the widget:
-
Name: Cost by Service
-
Dynamic time range for the query to run: 3 months to date
-
Granularity: Monthly
-
Chart type: Bars
-
Grouping dimensions: Service
You can preview your changes by selecting the Preview changes button.

When you’re satisfied, click Submit to add the tile to your dashboard. You can create more widgets by selecting +Add widget again or selecting the duplicate widget option under the contextual menu (three dots) and then editing settings. Within minutes, you can create a comprehensive dashboard that communicates your cloud financial management picture.

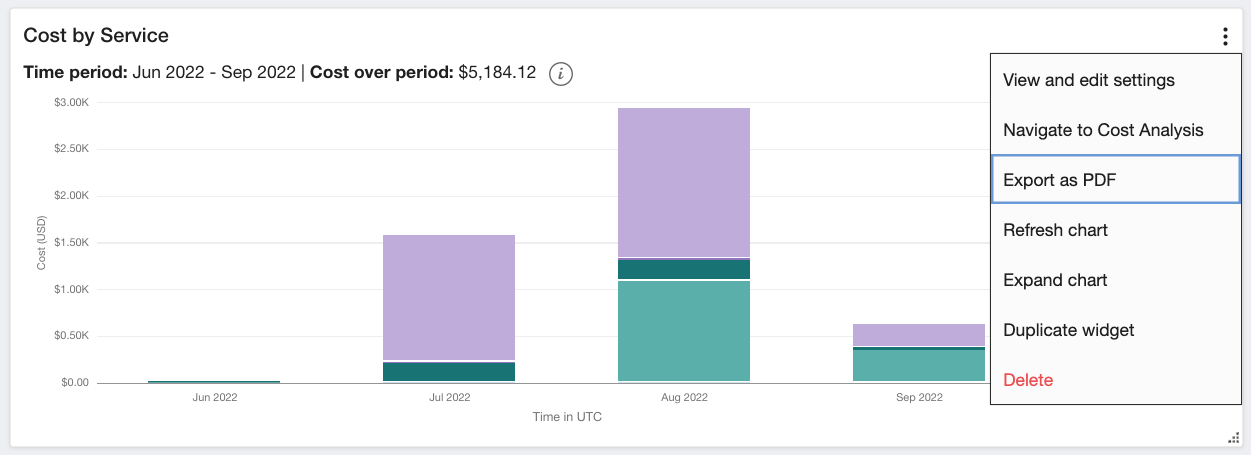
Do more with the widget
You can export the cost analysis data shown in the graph (as a table) in PDF format by selecting Export as PDF from the contextual menu of the widget. Navigate to Cost Analysis from the contextual menu from any widget. The same graph and supporting query are displayed in Cost Analysis. In this page, you can take advantage of other capabilities, such as forecasting and custom tabs.
Additional capabilities
Cost Management in Oracle Cloud Infrastructure also provides periodic reports for usage and cost as a csv file. You can also use tools to set a budget for your infrastructure spend. You can read more in Billing and Cost Management.