Oracle Enterprise Manager 13.5 customers gain greater operations, capacity planning, and forecasting insight by enabling rich target-level Enterprise Manager data with Oracle Cloud Observability & Management platform services (O&M). When Enterprise Manager transfers data from Oracle Management Repository (OMR) to OCI Object Storage, it is accessible by Oracle Cloud O&M services and its use-case specific EM warehouse (e.g. Operations Insights).
Off-the-shelf warehouse for solving IT Ops analytics and planning use-cases
Oracle Cloud enables new storage, processing, and machine learning technologies to help customers solve more business problems using target-level data already collected and managed by Oracle Enterprise Manager. It helps eliminate custom scripting, warehousing building, or the need to have extra hardware or storage onsite to perform IT Operational analytics and planning.
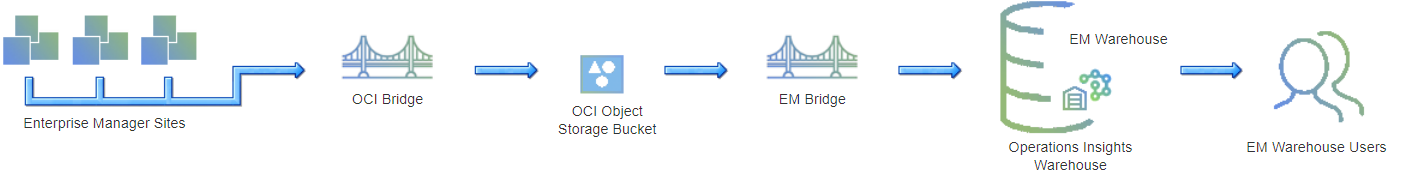
Customers configure Oracle Enterprise Manager to transfer data from the targets it manages and the Oracle Management Repository (OMR) into Oracle Cloud Infrastructure (OCI) Object Storage, enabling it to be securely accessible by Oracle Cloud services. Once OCI connectivity is set up, data automatically and routinely uploads to OCI Object Storage to enable a data lake. IT Operations and DBAs can then use OCI Operations Insights to set up & configure EM Warehouse, which can continuously ingest Enterprise Manager repository infrastructure monitoring and configuration data from OCI Object Storage ( i.e.data lake) and store it in an Oracle Autonomous Data Warehouse (ADW).
The following graphic illustrates how the target data flows from Enterprise Manager to an Oracle Cloud service and is utilized by EM Warehouse in Oracle Operations Insights service once the configuration process has been completed.
Easy setup within OCI Operations Insights – EM Warehouse
With direct access to raw observability and manageability data, EM customers can gain insight into the current and future state of targets. Customers are able to find noisy-neighbors across targets and run statistical models to predict future target forecasts managed by Enterprise Manager.
Now, in terms of initial setup, a user can access the EM Warehouse using the OCI Operations Insights menu as shown below.
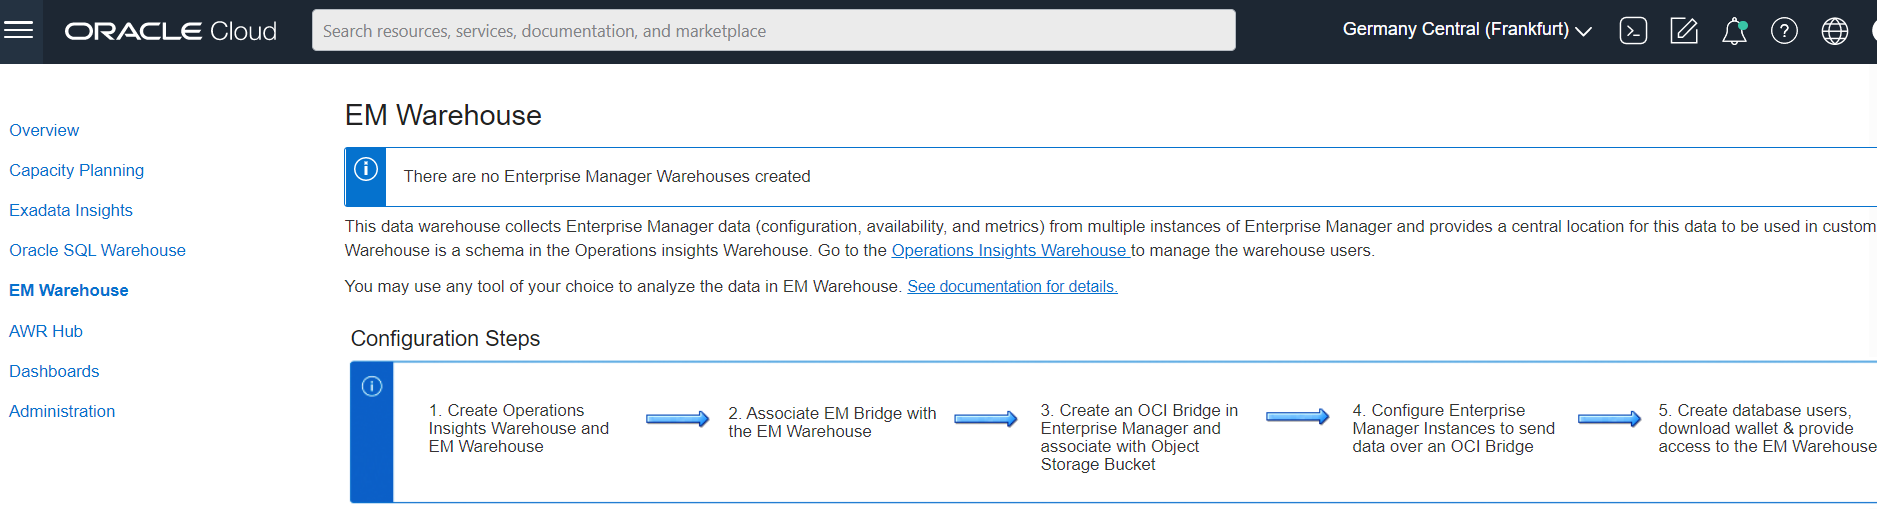
Once at the EM Warehouse setup page, the user can connect to the EM data via the EM Bridge in the respective compartment. It takes approximately 5 – 10 mins to create an EM Warehouse in your own tenancy.
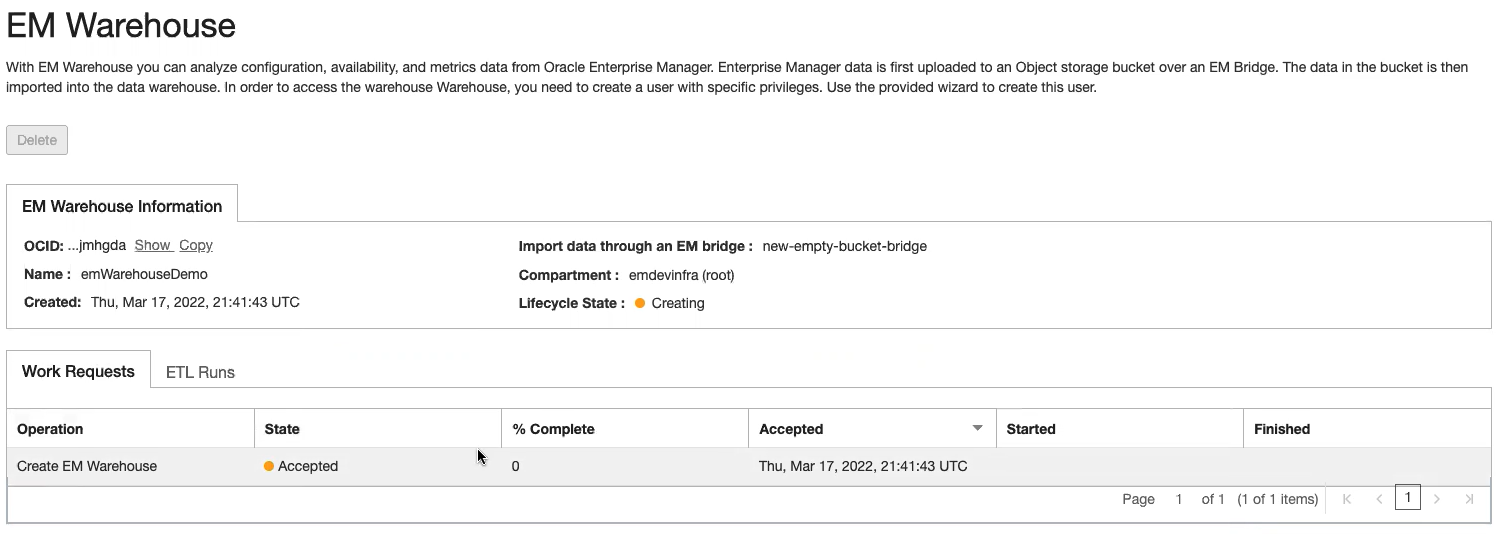
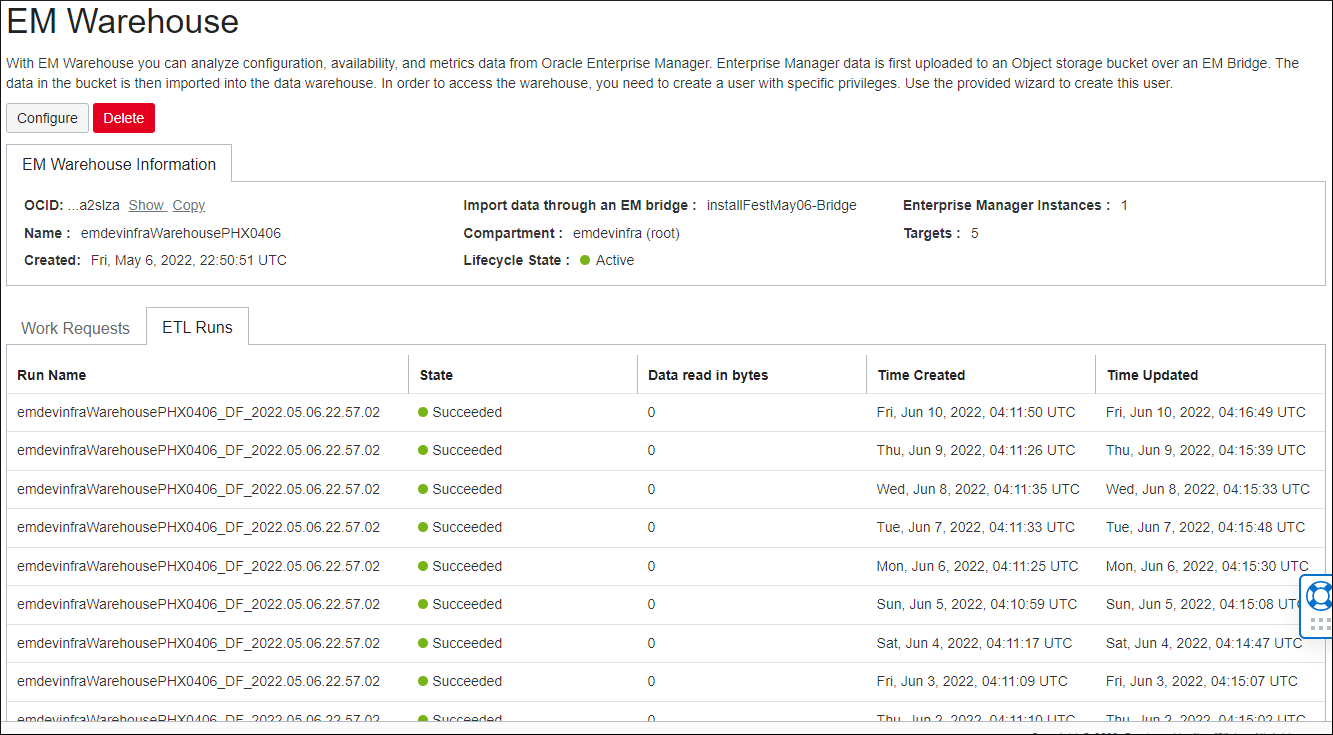
Once the Work Request completes, and the EM Warehouse has been successfully created, the Lifecycle State will become Active. The ETL Runs tab shows the data extraction jobs that have been run. The purpose of an ETL Run job is to move information that the EM bridge points to into an Autonomous Data Warehouse (ADW). An ETL Run will be processed every 24 hours if new data is present.
Monitoring ETL Runs shows whether data is being successfully uploaded to the EM Warehouse on a regular basis in addition to the amount of data that’s regularly being transferred.
Analyzing EM Warehouse data to gain insights and create custom analytics
By utilizing the EM Warehouse, customers can easily access rich data to gain insights in 2 different ways:
Version 1: Enterprise Manager data is loaded into OCI Object Storage. Customers can use the published Jupyter Notebooks for Datalake, or build their own analytics on top of the data residing in OCI Object Store OR
Version 2: Enterprise Manager data is loaded into EM Warehouse (ADW). Customers can then utilize either of the following:
- Jupyter Notebooks
- SQL Queries
- Oracle Analytics Cloud
Using Jupyter Notebooks to analyze data in EM Warehouse
You can download the Jupyter Notebooks to analyze data residing in the EM Warehouse. You have an option to use either Oracle Data Science Service or Anaconda to run these Jupyter Notebooks. For more information about installing and using Jupyter Notebooks for EM Warehouse, see Jupyter Notebooks for Oracle Enterprise Manager Warehouse.
Jupyter Notebooks demonstrates the following:
- The utility of high density grid plots for visualizing database instance telemetry for a wide variety of metrics collected by Enterprise Manager. The notebook displays database metrics as well as a representation of the cumulative distribution of these metrics. This notebook illustrates the use of interactive controls to enable the user to select the databases and the metrics being visualized.
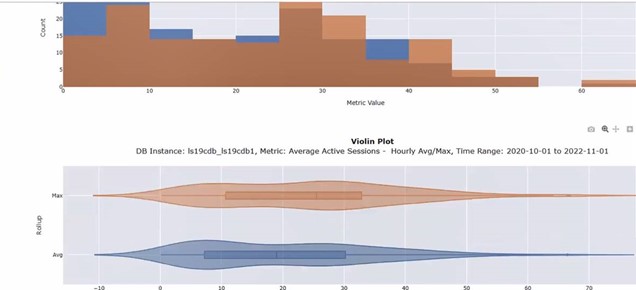
- A variety of chart types that are useful in understanding the distribution of database instance time series telemetry values collected by Enterprise Manager. This notebook illustrates the use of interactive controls to enable the user to select the databases and the metrics being visualized.
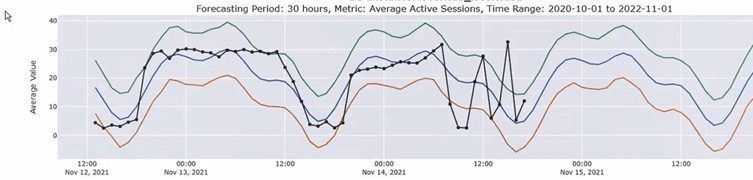
- Advanced statistical analysis, including forecasting, for database time series telemetry values collected by Enterprise Manager. Analytics from that are available as native python libraries or as third-party add-ons. This notebook illustrates the use of interactive controls to enable the user to select the data being visualized.
Using SQL Queries to extract data from EM Warehouse
Use SQL *Plus or other SQL editors to extract relevant data directly from the EM Warehouse to facilitate resource analysis.
For example, the following SQL will display parameter value changes that have occurred to the db_init_params configuration metric for a given parameter over a specific period of time. The example shows the changes for open_cursors parameter.
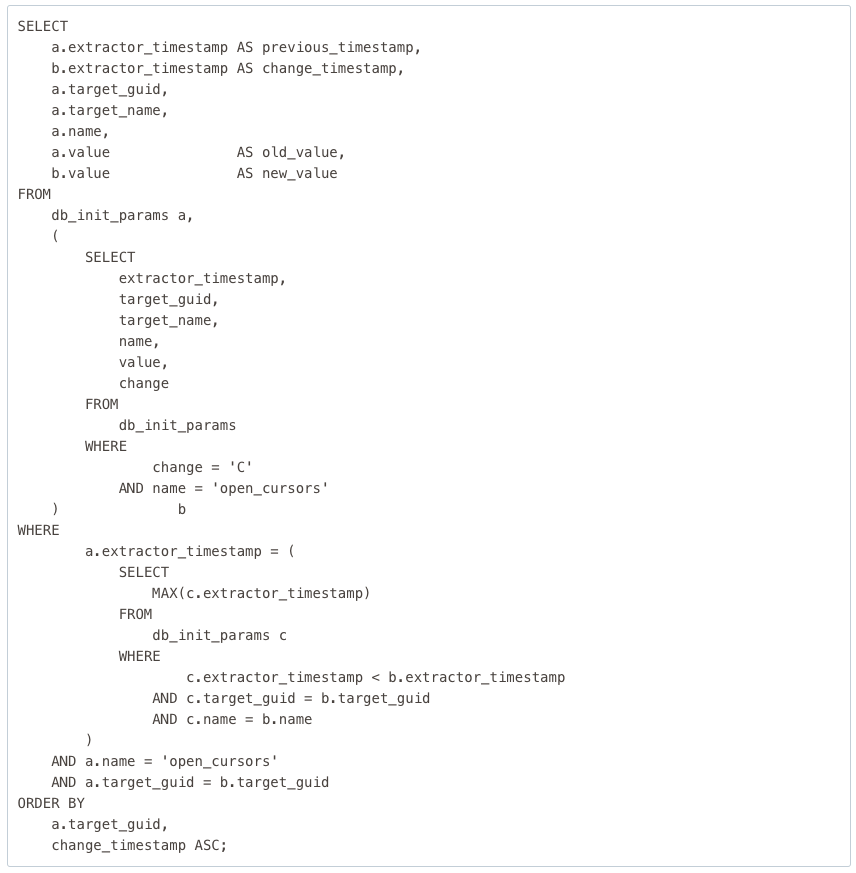
Output

Use Oracle Analytics Cloud and unlock data across any environment on any device
Oracle Analytics Cloud (OAC) is a single and complete platform that empowers an entire organization to ask any question of any data—across any environment, on any device.
Oracle Analytics Cloud provides a variety of options for intelligent analysis of data stored in EM Warehouse without being overwhelming to deploy and manage, making it an effective way to access capitalize on cloud analytics.
In terms of setting of OAC for use with the EM Warehouse ADW, it involves 3 basic steps:
- Step 1: Create a Connection to ADW
- Step 2: Create a Dataset
- Step 3: Create a Workbook
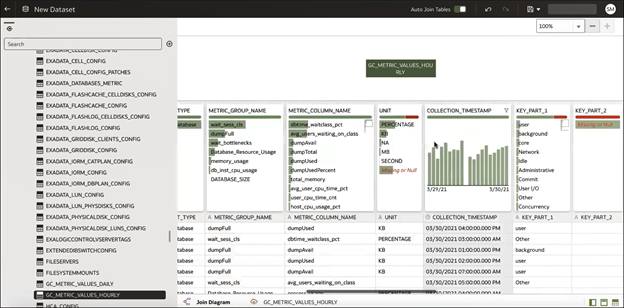
Once the user is done with initial steps, the new workbook is created and depicted in Figure 8. The left navigation pane displays the data tables selected. Drag and drop tables into the work area to create visualization and define filters, if necessary. For more information about using Workbooks, see Visualizing Data and Building Reports in Oracle Analytics Cloud.
For comprehensive information about OAC, see Oracle Analytics Cloud.
Sign up for an Oracle Cloud Infrastructure trial account! For more detail and how to use it, see the documentation.
