The Cost Analysis tool is an interface for viewing your OCI consumption. You can access it in the Console from the Cost Management section under Governance and Administration. This tool lets you build queries to visualize your consumption grouped or filtered by parameters that you want to attribute costs by such as tags or compartments. Cost analysis enables you to visualize your consumption on a time-series.
Now, you can also analyze your data with multiple grouping dimensions and visualize consumption based on these dimensions instead of just time to better understand consumption across different business units or projects in your organization. This can be achieved by leveraging Custom Tabs feature in Cost Analysis.
Creating a Custom Tab
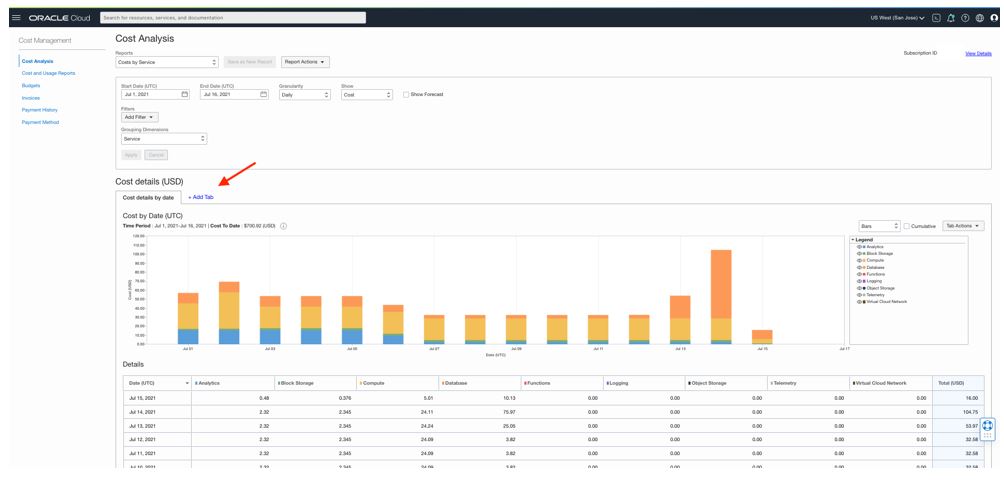
When you access the Cost Analysis page, you are defaulted to the Cost by Service System Report. To create a Custom Tab, click on the Add Tab button.
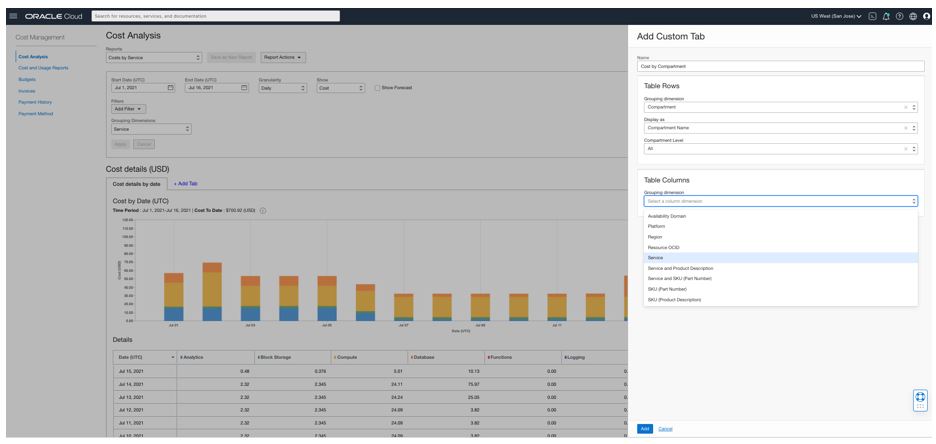
This will launch the Add Custom Tab side-panel. Name your Custom Tab and select the column and row dimensions from the list of drop-down options. Click on the Add button to create the Custom Tab.
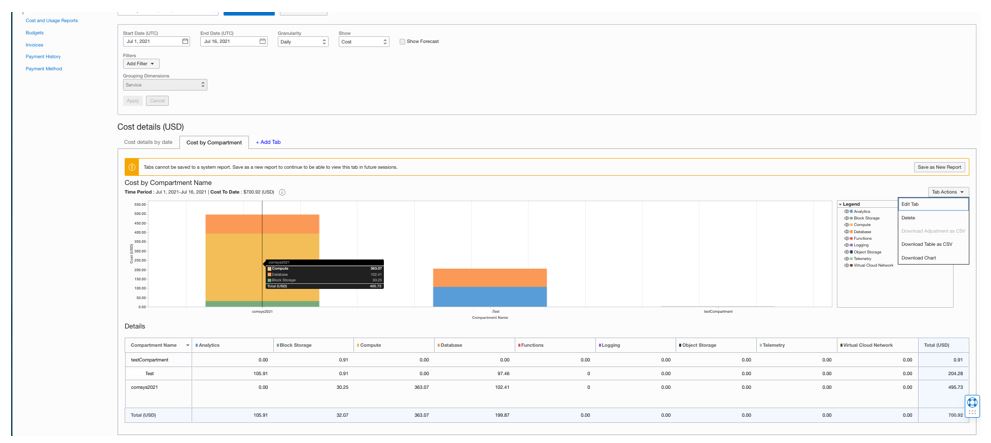
The new tab is created for the same time range as your query. The row dimension is the horizontal axis on the graph and the stacked bars represent the column dimensions. This same data is in tabular format below the graph and can be exported in CSV format if needed from the Tab Actions menu. The Tab Actions menu also gives you the ability to edit or delete a tab. Editing a tab gives you the ability to rename it or change the dimensions used.
Continued Access to a Custom Tab
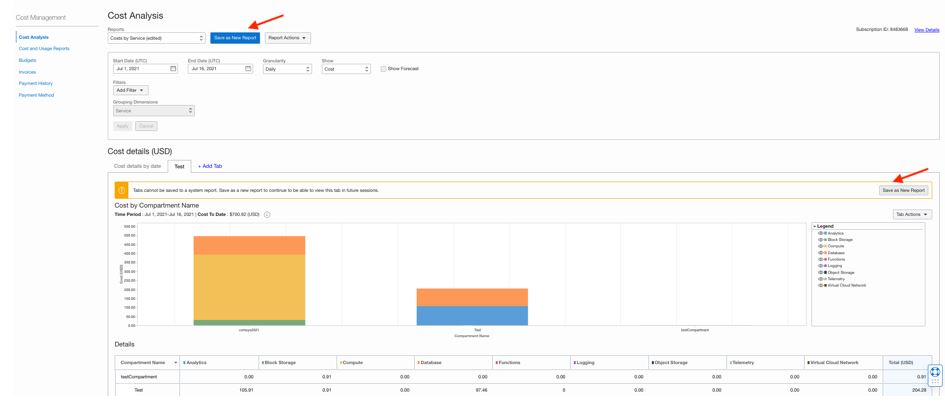
You can create up to five custom tabs in a report. These custom tabs can be accessed for the duration of your session. You can continue to have access to the custom tabs you create beyond your session and share them with other users by saving them as part of a Saved Report. This can be done by clicking on the “Save as New Report” button either within the tab or next to the report selector. All tabs in a given page will be saved as part of the new Saved report created and you do not have to repeat this process individually for each tab.
Any changes to the query parameters such as changes to the date range or addition of a filter will automatically apply to all the Tabs in a given report.
Try it Yourself
Controlling costs on their cloud implementation is one of the top concerns of most organizations. You can use this new feature in Cost Analysis to analyze consumption across your Organization, not just over time but also across multiple dimensions based on your business needs. You can analyze data from multiple angles, easily retain views that matter to you, and share them every easily with your peers. This will help you stay on top of your budgetary targets and cost attribution requirements. Share your feedback in the comments and let us know how we can continue to improve your experience on Oracle Cloud Infrastructure.