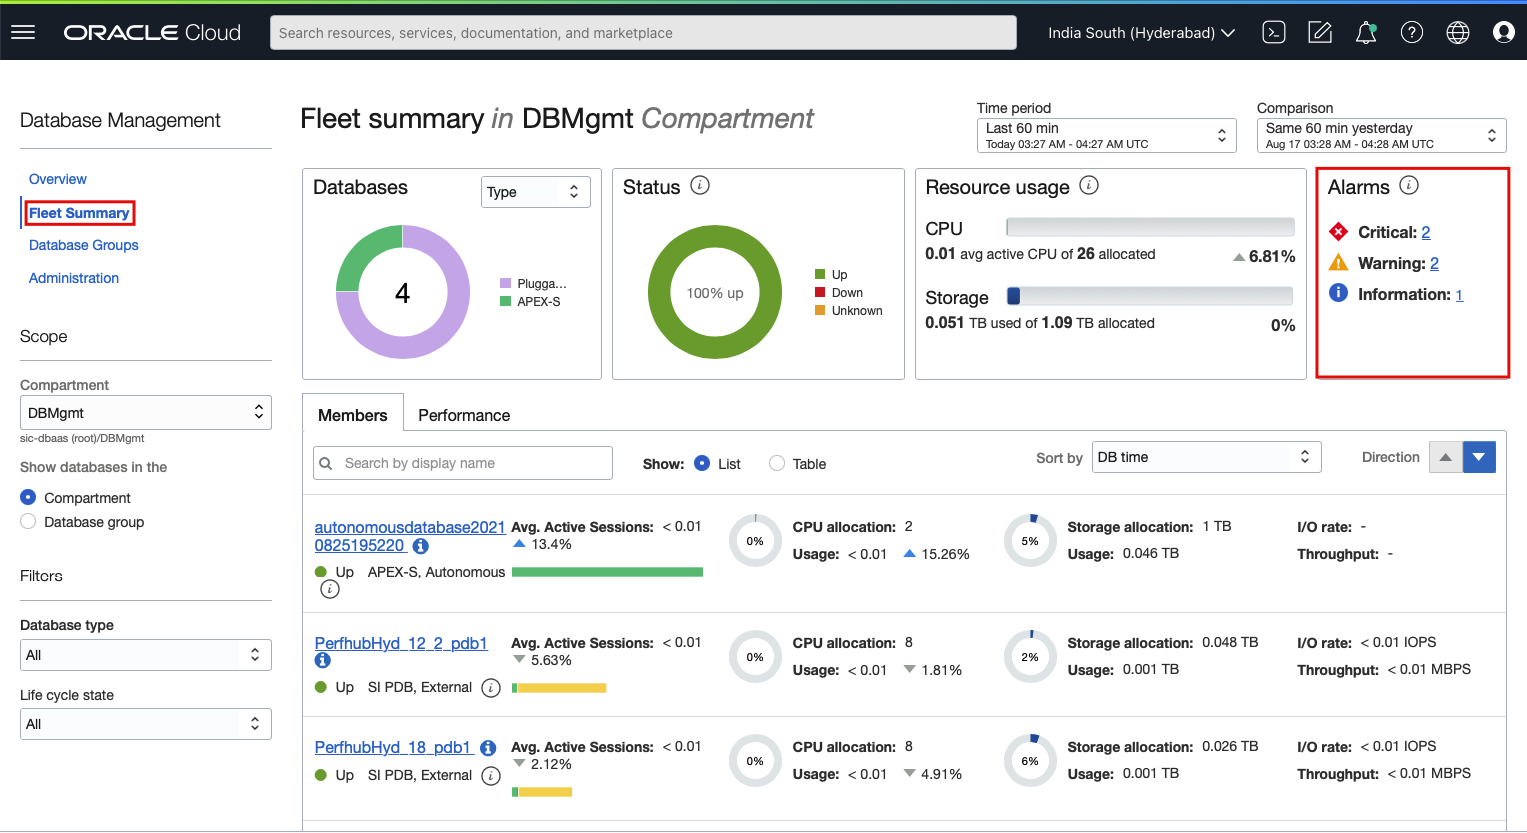
Oracle Cloud Infrastructure (OCI) Database Management Service (Database Management) now enables monitoring of the number of alarms by severity for a fleet of managed databases in a compartment or database group, or a single managed database.
Previously, you could only monitor the alarms on the Fleet summary page but now you can also monitor the alarms for the databases in a database group on the Database group details page and a single managed database on the Managed database details page.
The Alarms feature in the Oracle Cloud Infrastructure Monitoring service monitors cloud resources using metrics and notifies you when these metrics meet alarm-specified triggers.
For the open database alarms to be displayed in Database Management, ensure that:
Database Management is enabled for the Oracle Database. For information, see Enable Database Management.
An alarm is created and either one or both of the following dimensions are specified when creating the alarm:
- resourceId: The OCID of the Oracle Database.
- resourceName: The name of the Oracle Database.
Creating an alarm in the O&M OCI console
Here’s a scenario in which an alarm is created for the CpuUtilization metric of an Oracle Database, which is being monitored by Database Management.
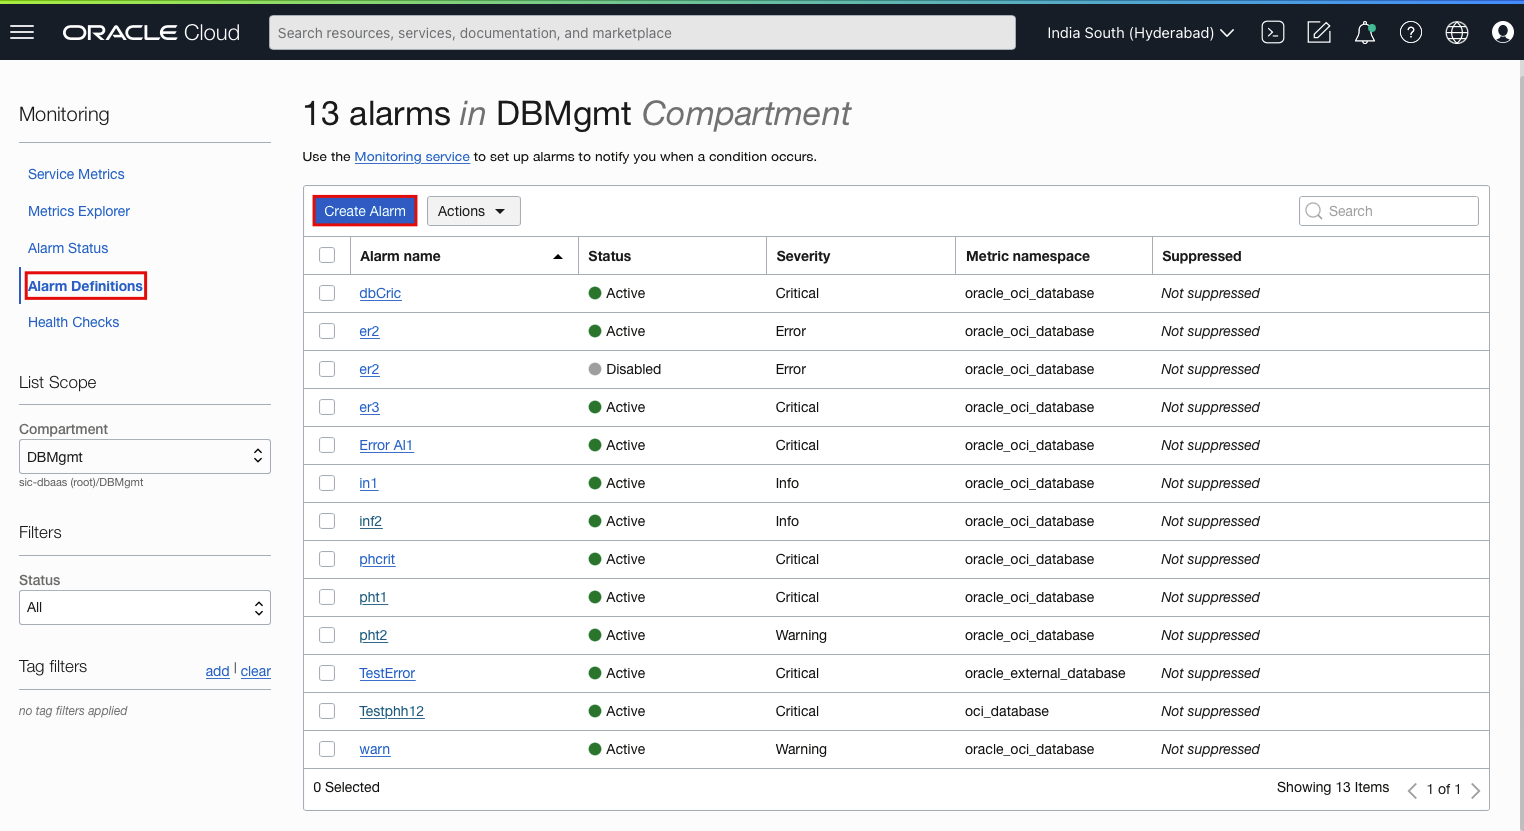
1. In the OCI console, open the navigation menu, and click Observability & Management. Under Monitoring, click Alarm Definitions.
2. On the Alarm Definitions page, click Create Alarm.
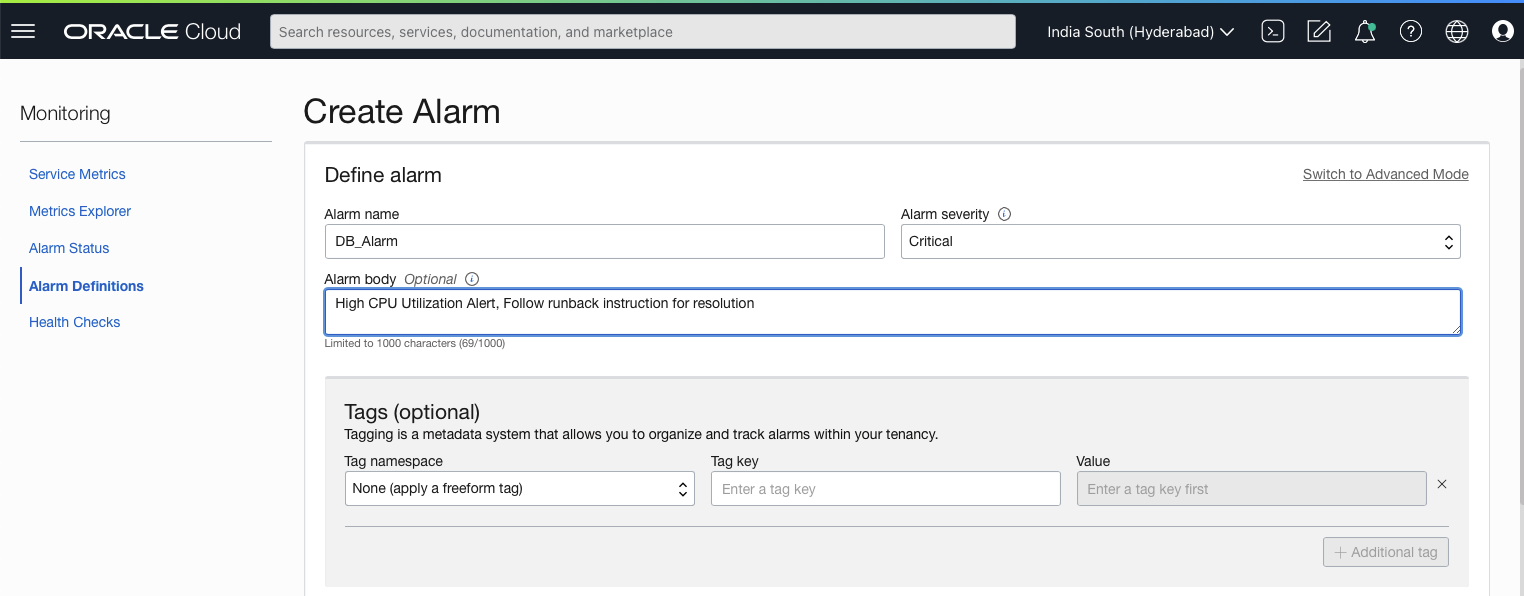
3. On the Create Alarm page, under Define alarm:
- Enter a user-friendly name for the alarm in the Alarm name field.
- Select Critical in the Alarm severity field.
- Specify guidance on how to resolve the alarm in the Alarm body field.
- Enter optional tags in the Tags fields.
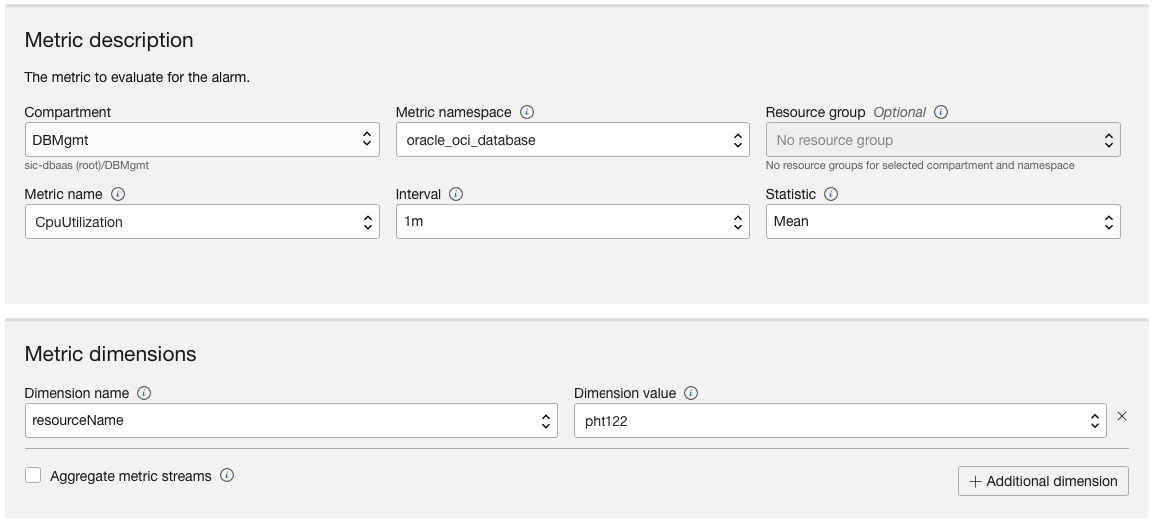
4. In the Metric description section:
- Select the compartment in which Database Management is discovered in the Compartment field.
- Select oracle_oci_database in the Metric namespace field.
- Optionally, select the resource group to which the metric belongs in the Resource group field.
- Select CpuUtilization in the Metric name field.
- Specify 1m as the frequency at which data points are aggregated in the Interval field.
- Select Mean as the aggregation function applied for converting a set of data points, in the Statistic field.
5. In the Metric dimensions section:
- Select resourceId or resourceName in the Dimension name field.
- Depending on the dimension selected in the previous step, select the OCID or name of the Oracle Database.
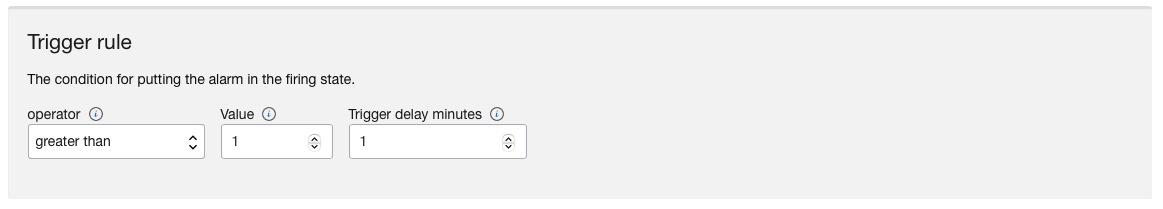
6. In the Trigger rule section, select the trigger value, which is the condition to put the alarm in a firing state.
7. The metric chart for the specified dimensions and the associated query are displayed.
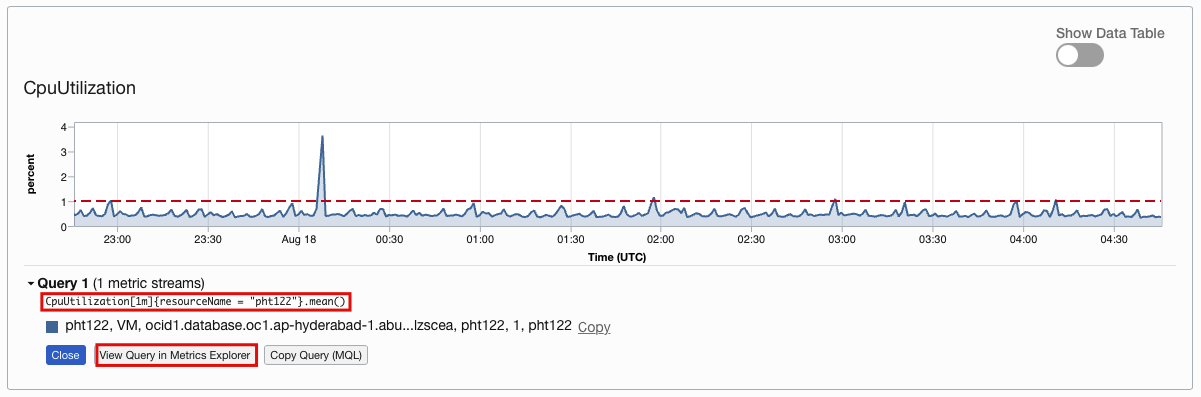
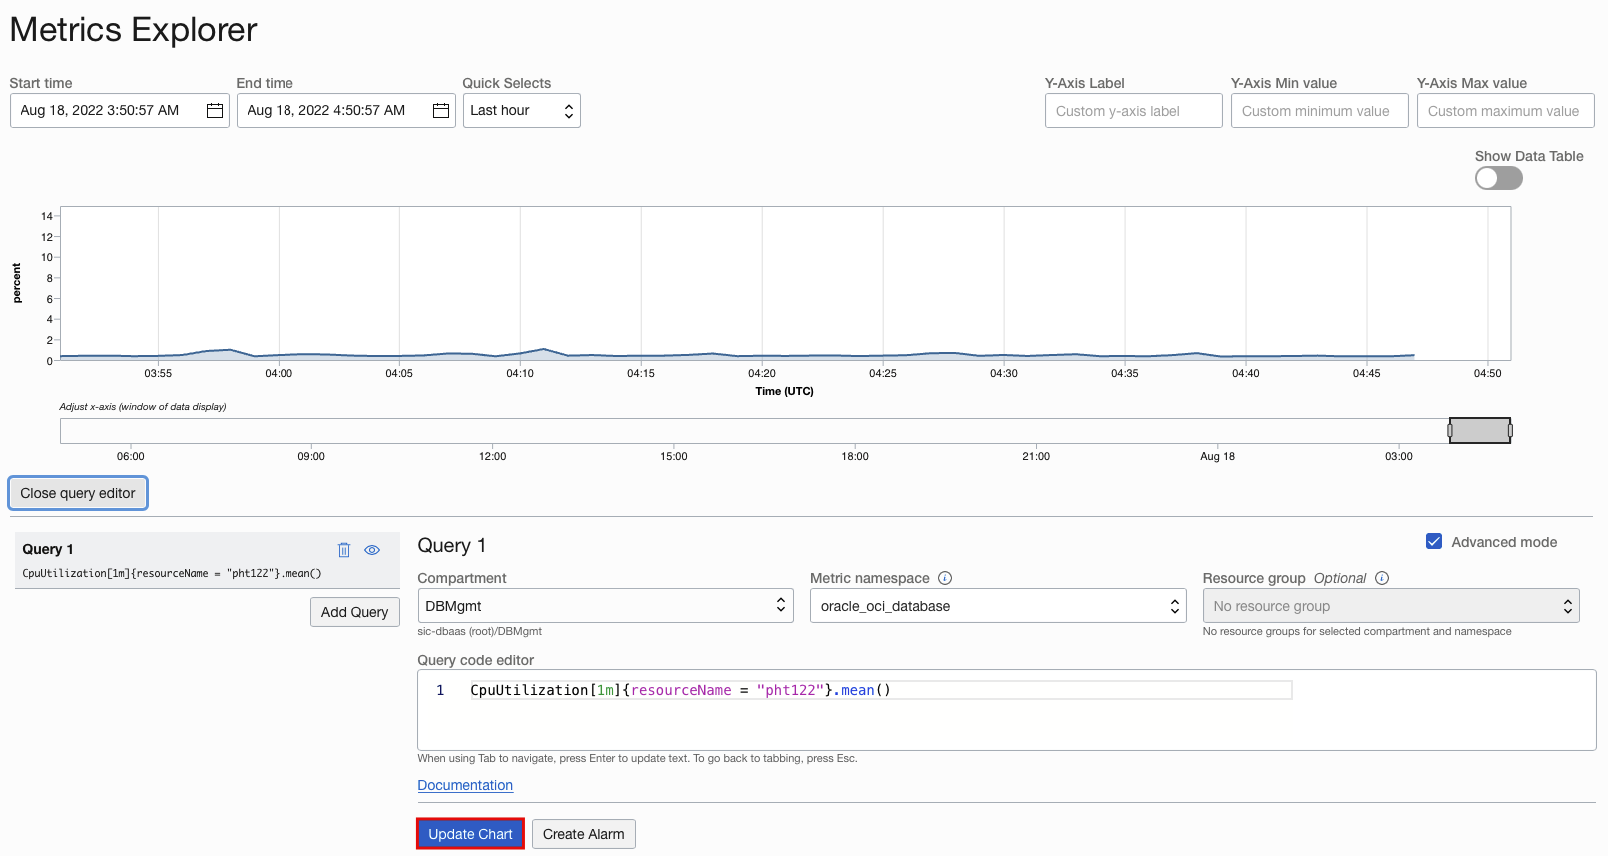
8. Optionally, customize the definition of the alarm using Metric Query Language (MQL) by clicking the view query in Metrics Explorer and clicking Edit query.
9. In the Notifications section, select the notification service to deliver the alarm notification. Create or use an existing “Topic” to send a notification when it reaches the firing state. A few of the endpoints available are email addresses, Slack channels, SMS, and custom URLs enabling users to receive critical messages to act upon quickly.
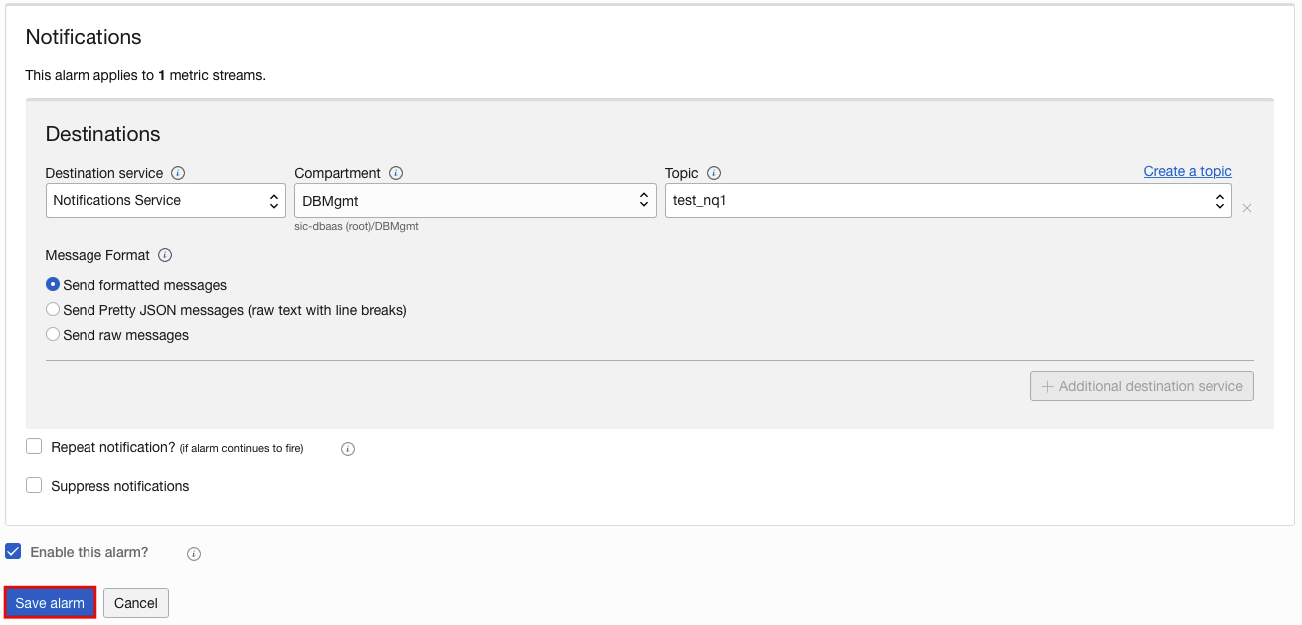
10. Click Save alarm to create the new alarm for the database and this will be displayed on the Database Management pages when it’s in the firing state
Investigate Alarms in Database Management
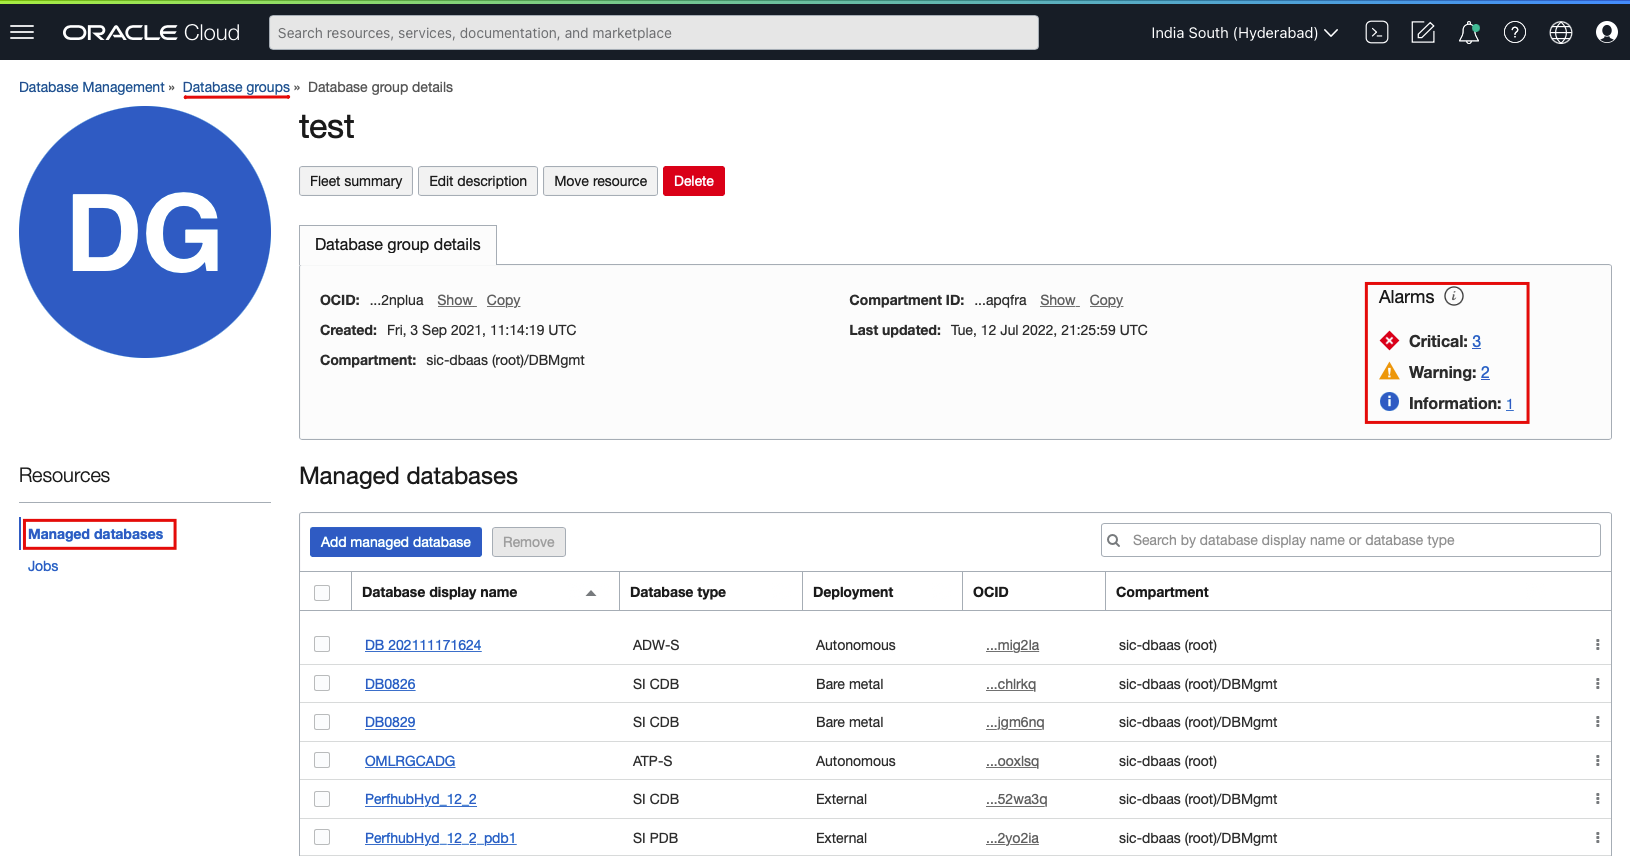
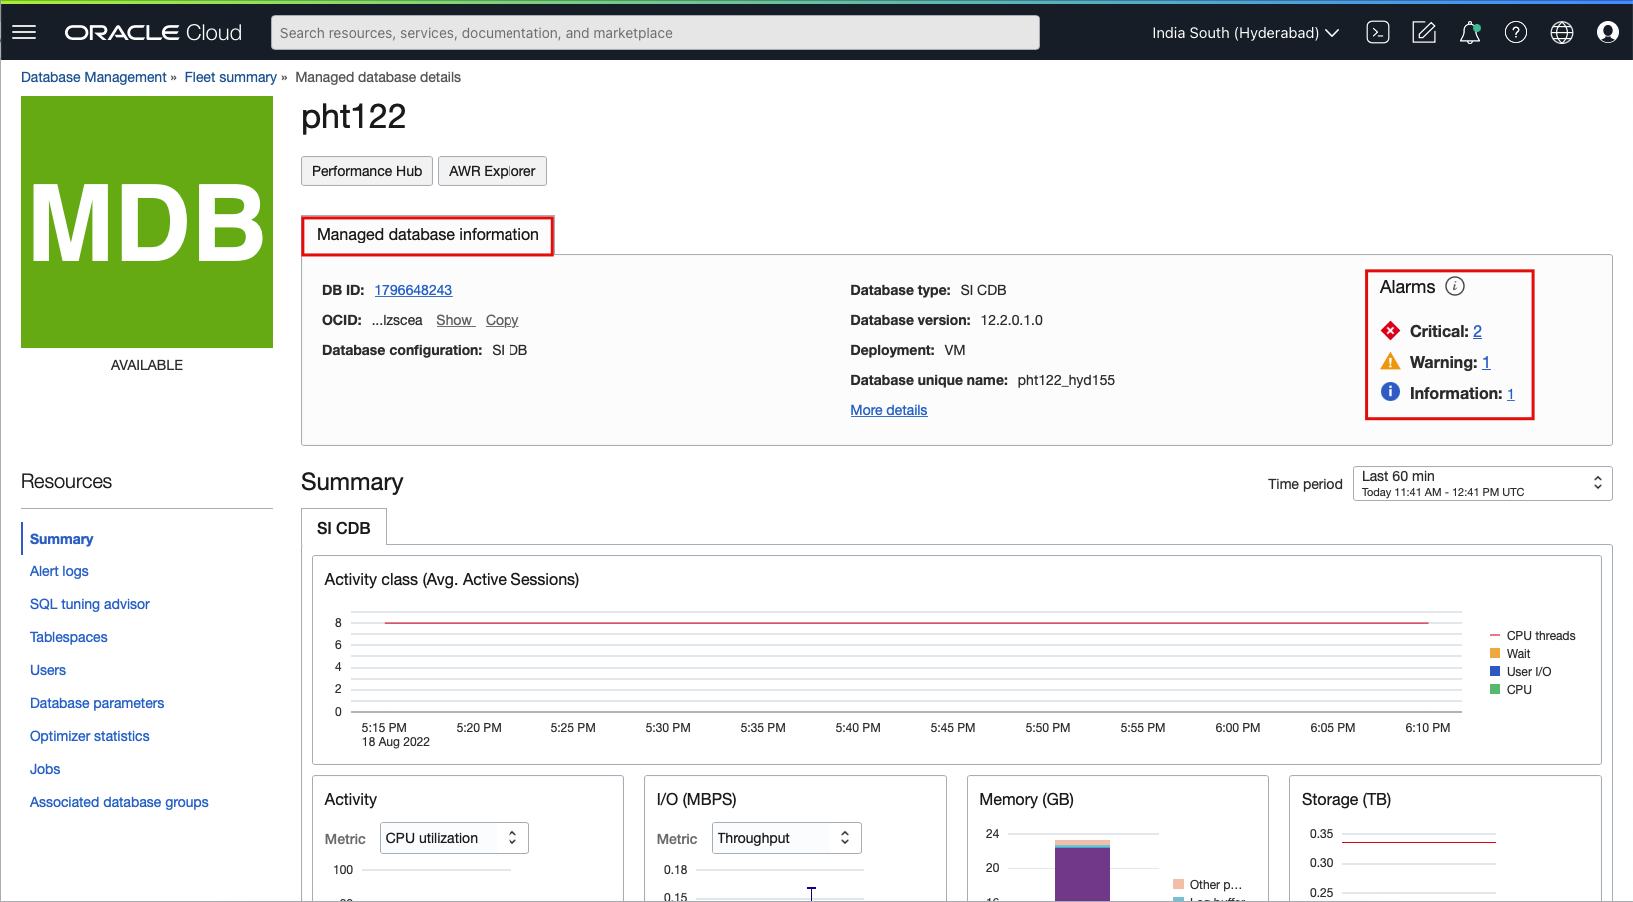
The open database alarms created with the resourceId or resourceName dimensions are listed on the Fleet summary, Database group details, and Managed database details pages. For example, in the screenshot below, the Alarm information for a particular Database Group is displayed.
Click the number of alarms to access detailed information about the alarms in the Alarms slider.
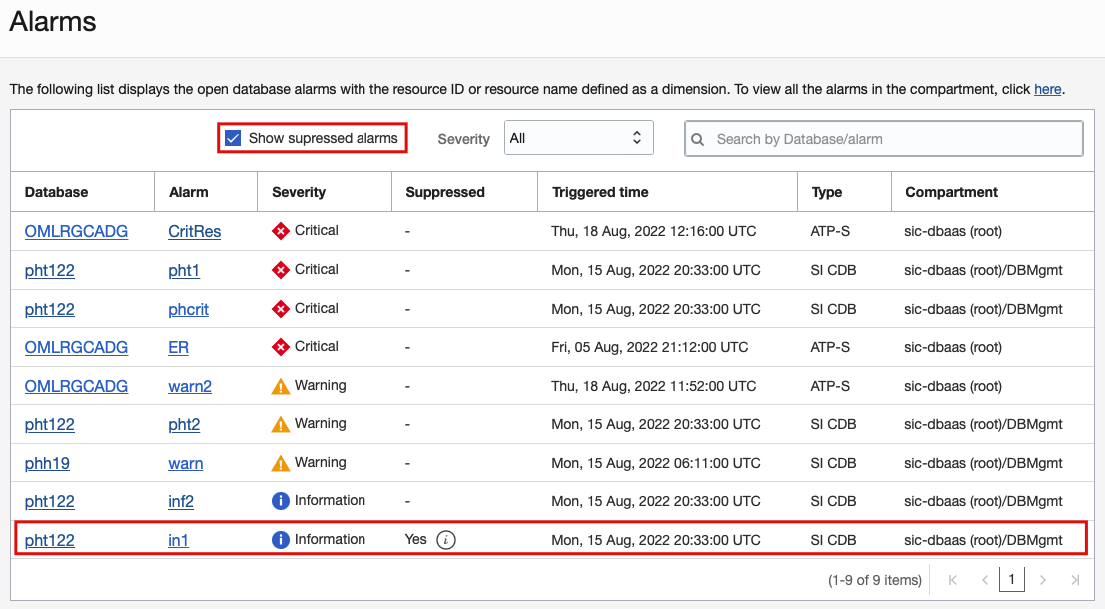
In the Alarms slider:
Select the Show suppressed alarms check box to view suppressed alarms.
Use the options in the Severity drop-down list to filter the list of alarms by severity or search for a specific Oracle Database or alarm by entering the name in the Search by Database/alarm field.
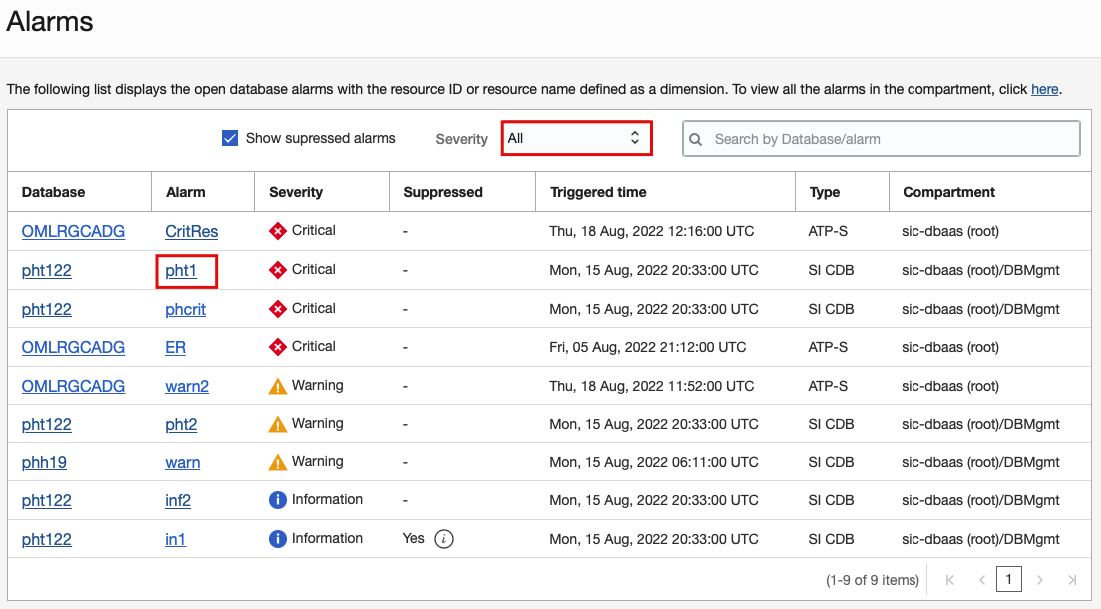
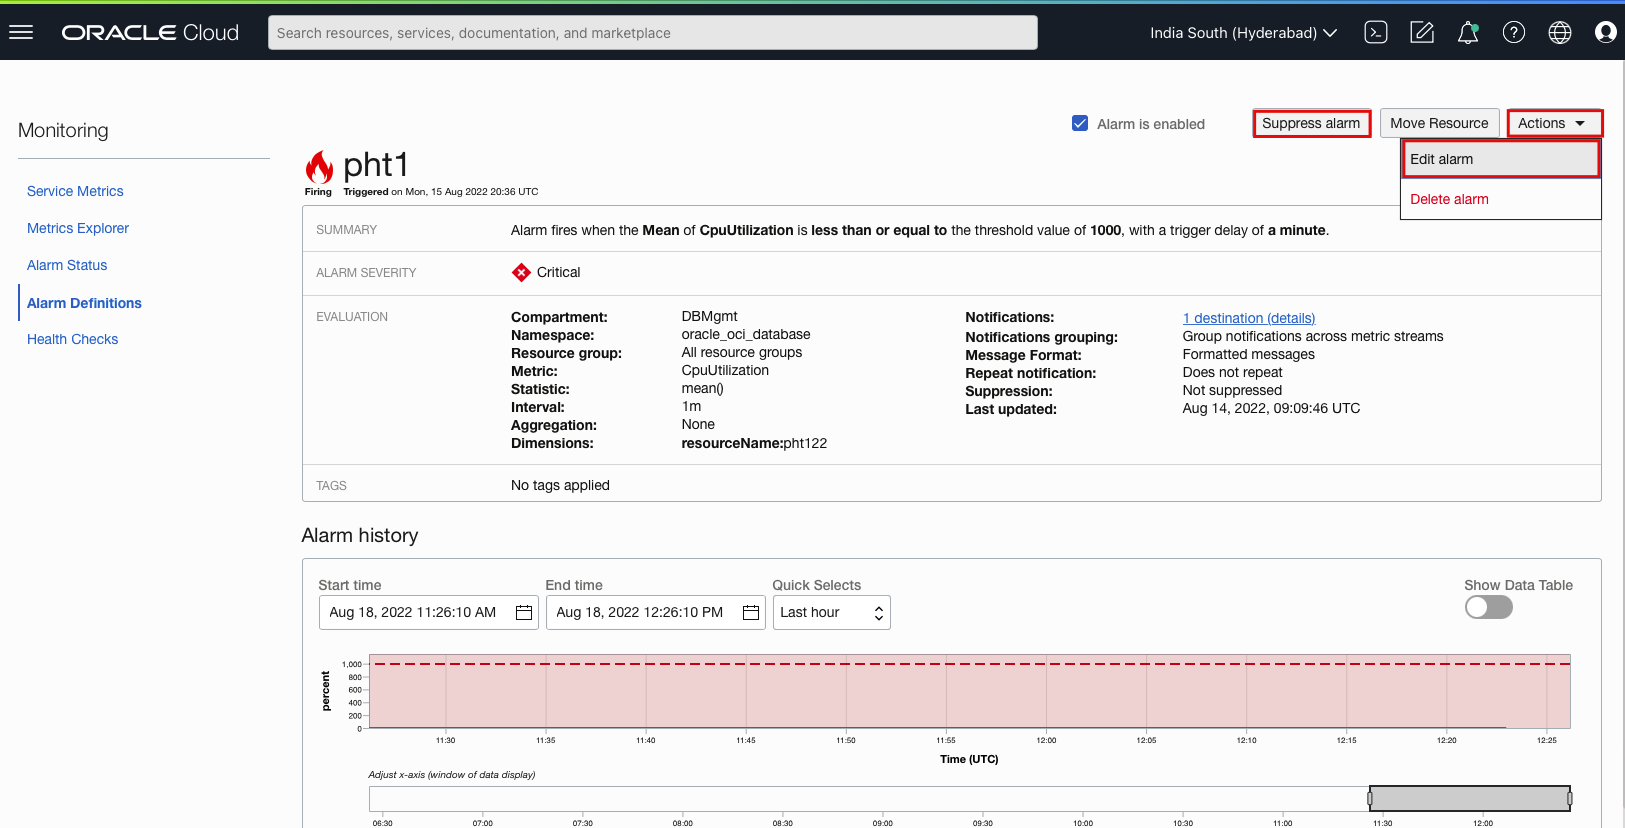
Click the name of the alarm to view or edit the alarm on the Alarm Definitions page. To edit or delete the alarm, click Actions and select the appropriate option. You can also suppress the alarm by clicking Suppress alarm.
Click the name of the database to go to the Managed database details page of the database and only view the open alarms for that database.
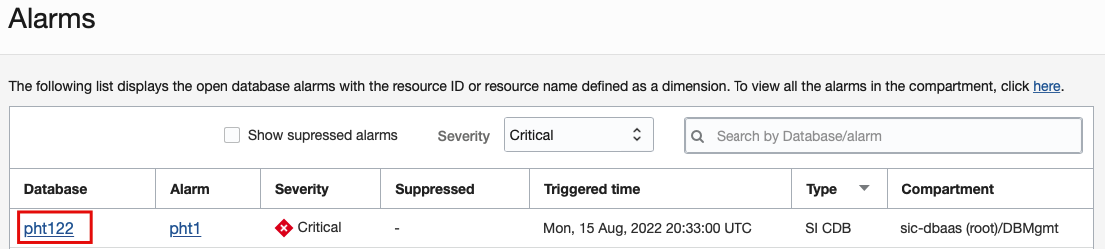
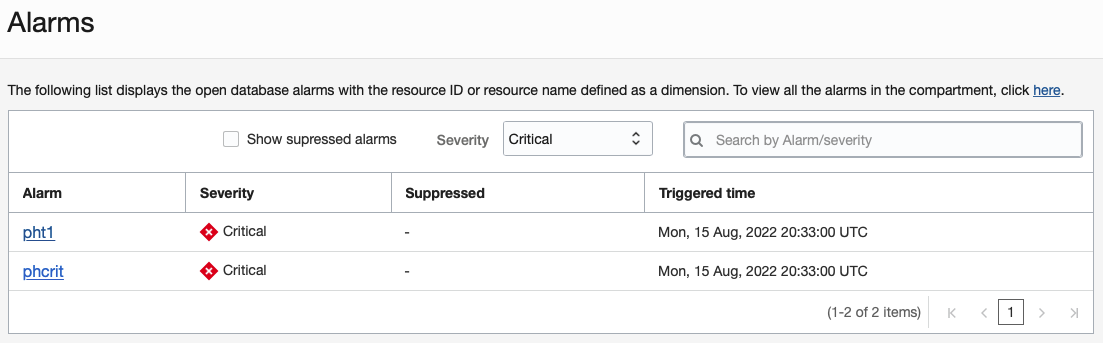
Note that the Database column is not displayed in the Alarms slider if it’s accessed from the Managed database details page.
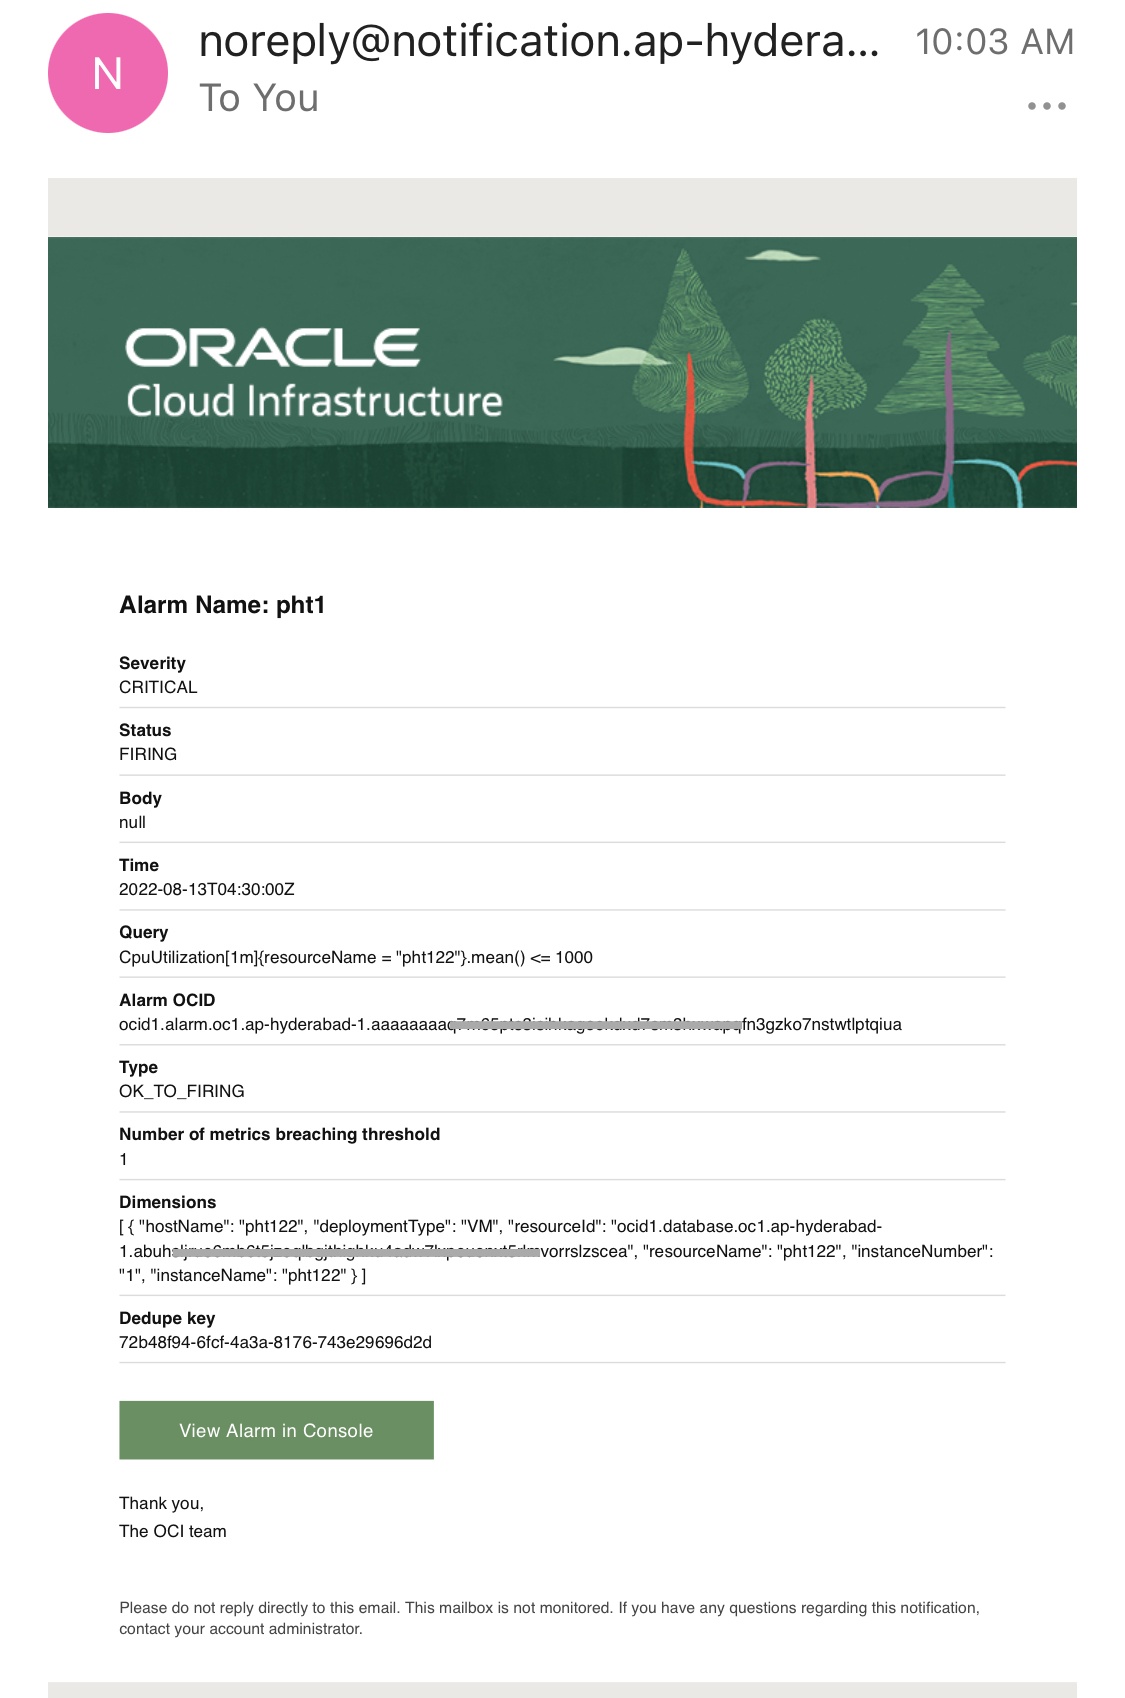
Here is the sample email notification for the configured critical event.
Conclusion
Database Management Service Alarms enables you to quickly view and act upon the issues on your database fleet. It also helps prioritize the metrics that are critical for your infrastructure and monitor them in a single pane.
Additional Resources
Learn more about OCI Database Management Cloud Service
Explore the documentation and get more details on metrics, alarms, and notifications
Read the release notes