Earlier this year, we announced the general availability of Performance Hub in Oracle Cloud Infrastructure (OCI) Database Management service. We’re excited to announce that Performance Hub in Database Management service now supports Exadata monitoring for Oracle databases on Exadata Cloud service in OCI and on-premises Exadata deployments.
This feature allows you to have a single view of all the databases in an Exadata deployment and perform the rapid diagnosis of its problems.
Performance Hub for Exadata Overview
In this blog, we look at how to identify various performance issues using Performance Hub features for Exadata monitoring.
Performance Hub now has a new tab for Exadata. This tab provides a unified view of Oracle Exadata hard disk and flash performance statistics with deep insight into the health and performance of all components, such as the Oracle databases, Oracle Exadata storage cells, and Automatic Storage Management (ASM). You can use the Exadata tab for enhanced performance diagnostics for databases deployed on Exadata systems.
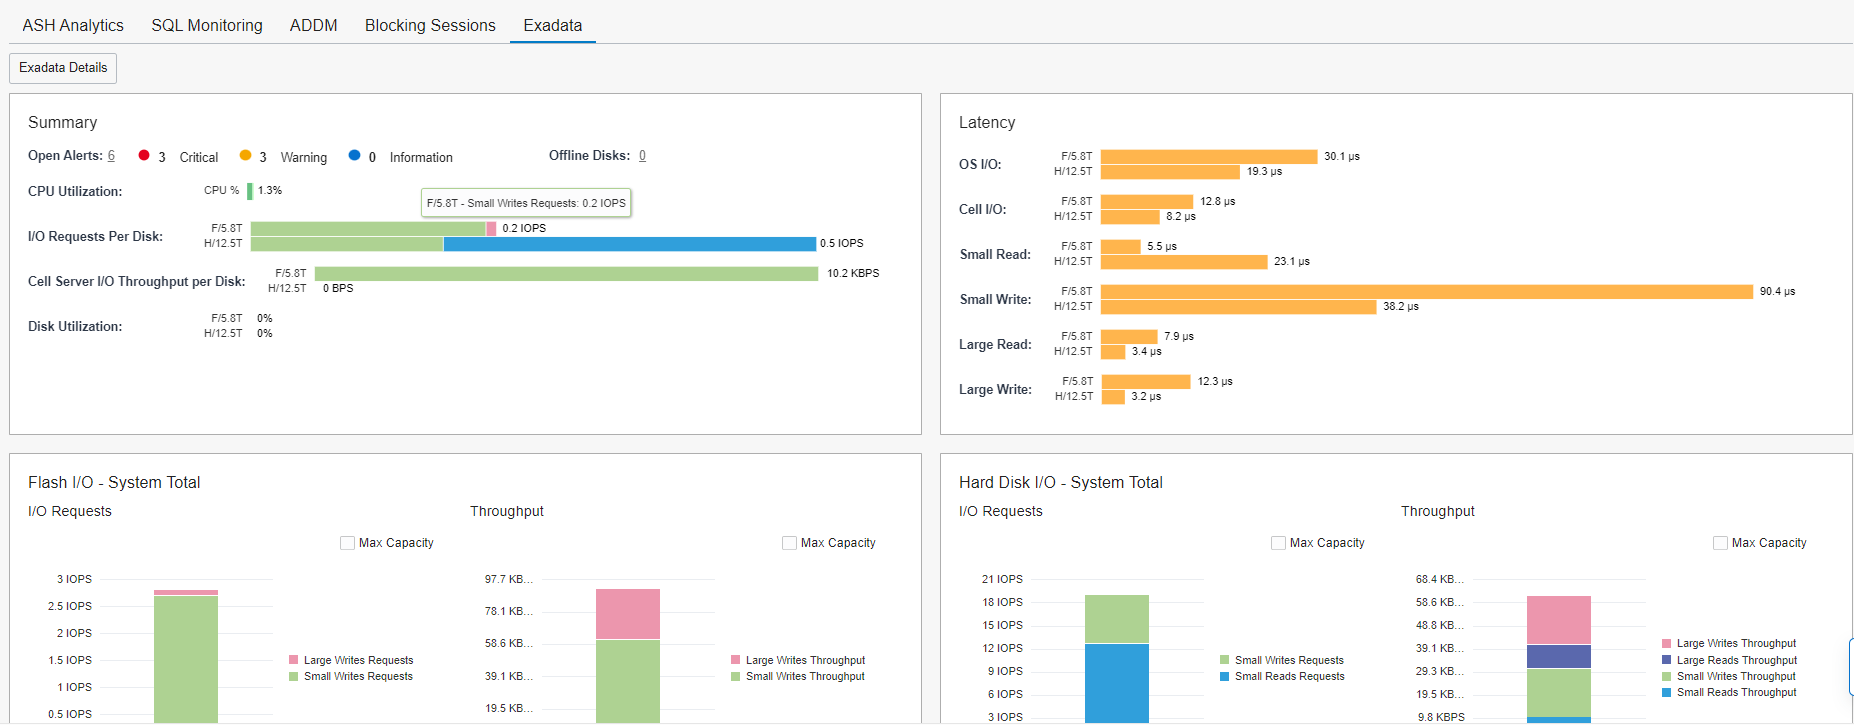
Figure 1: Exadata tab in Performance Hub
I/O bound disk subsystem
The performance section of the Exadata tab Performance shows database performance, including a summary, latency statistics, flash I/O statistics, and Hard Disk I/O statistics. This section provides the following features:
-
OS IO statistics by disk type
-
Aggregated IOPs and IO MB/s
-
Indicator for maximums based on Oracle published datasheet for Exadata
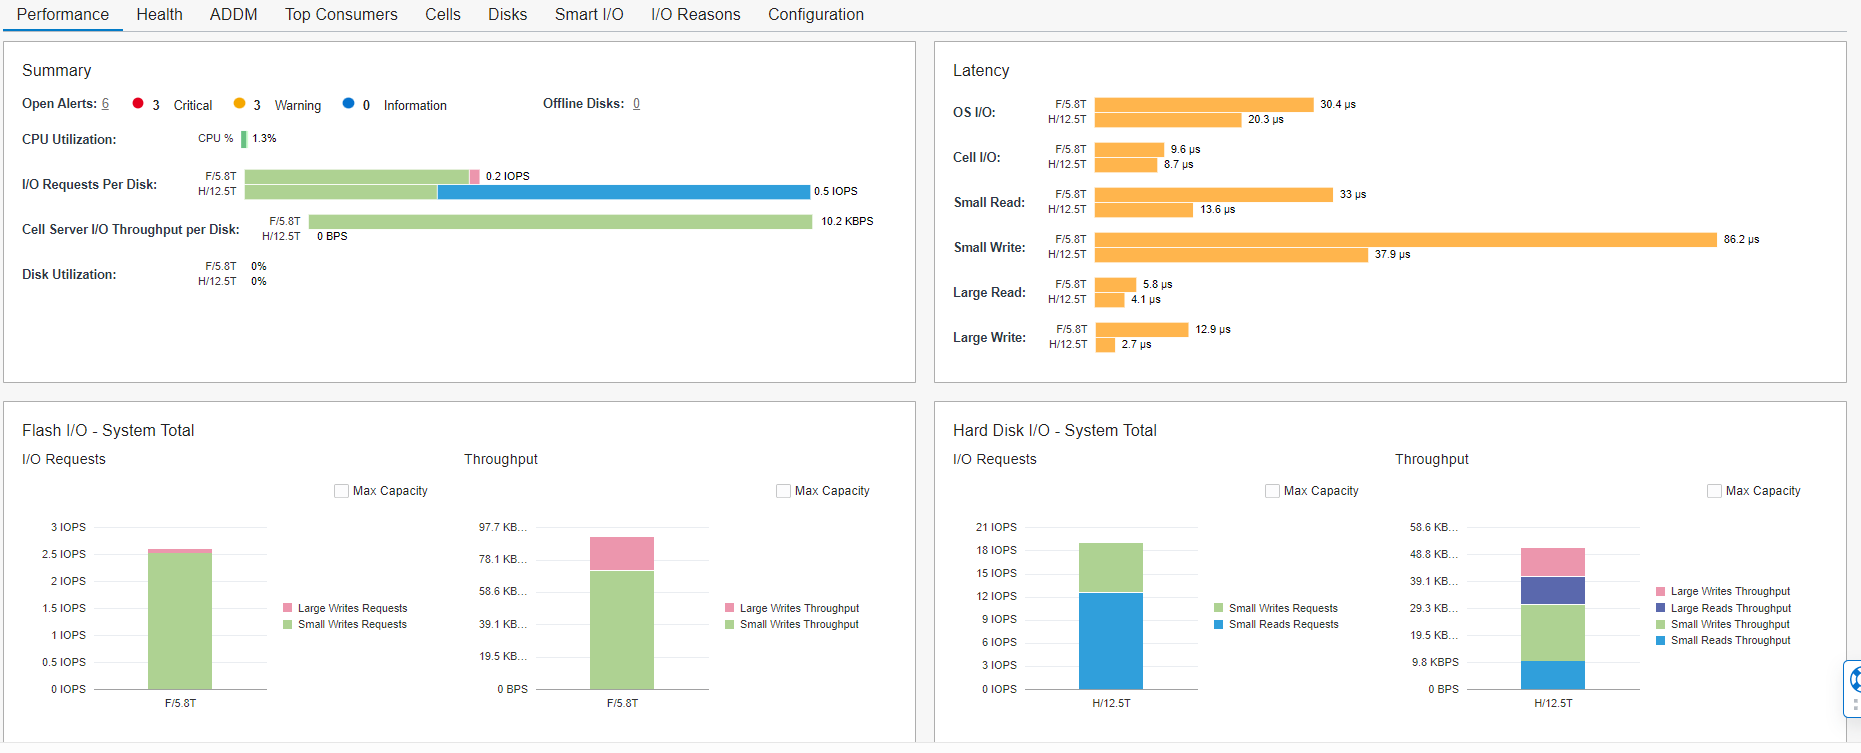
Figure 2: Performance section in the Exadata tab of Performance Hub
How much disk I/O is because of flash cache?
One question that customers typically have is how much flash throughput an OLTP consumes. The Cells and Disks section compares the operational statistics of the flash drives and hard disks in the system. It shows how I/O is distributed between flash drives and hard disks, allowing you to see how much benefit the system is getting from flash cache, how much disk I/O is because of Flash Cache, and how I/O correlates to database single block reads.
The tab displays statistics by cell, including the top cells, outlier cells, OS I/O throughput, cell server I/O requests, cell server I/O throughput, % disk utilization, I/O latency, and cell latency. You can select the default column group by which you want to display the data. Hover the cursor over a statistic to view details about it.
This feature allows you to monitor and track the throughput usage, utilization percentage from a disk or flash throughput perspective, and the latency and Flash IORM waits. This functionality gives us a good visual interpretation of the workload distribution and basis, which we can use to change your IORM strategy.
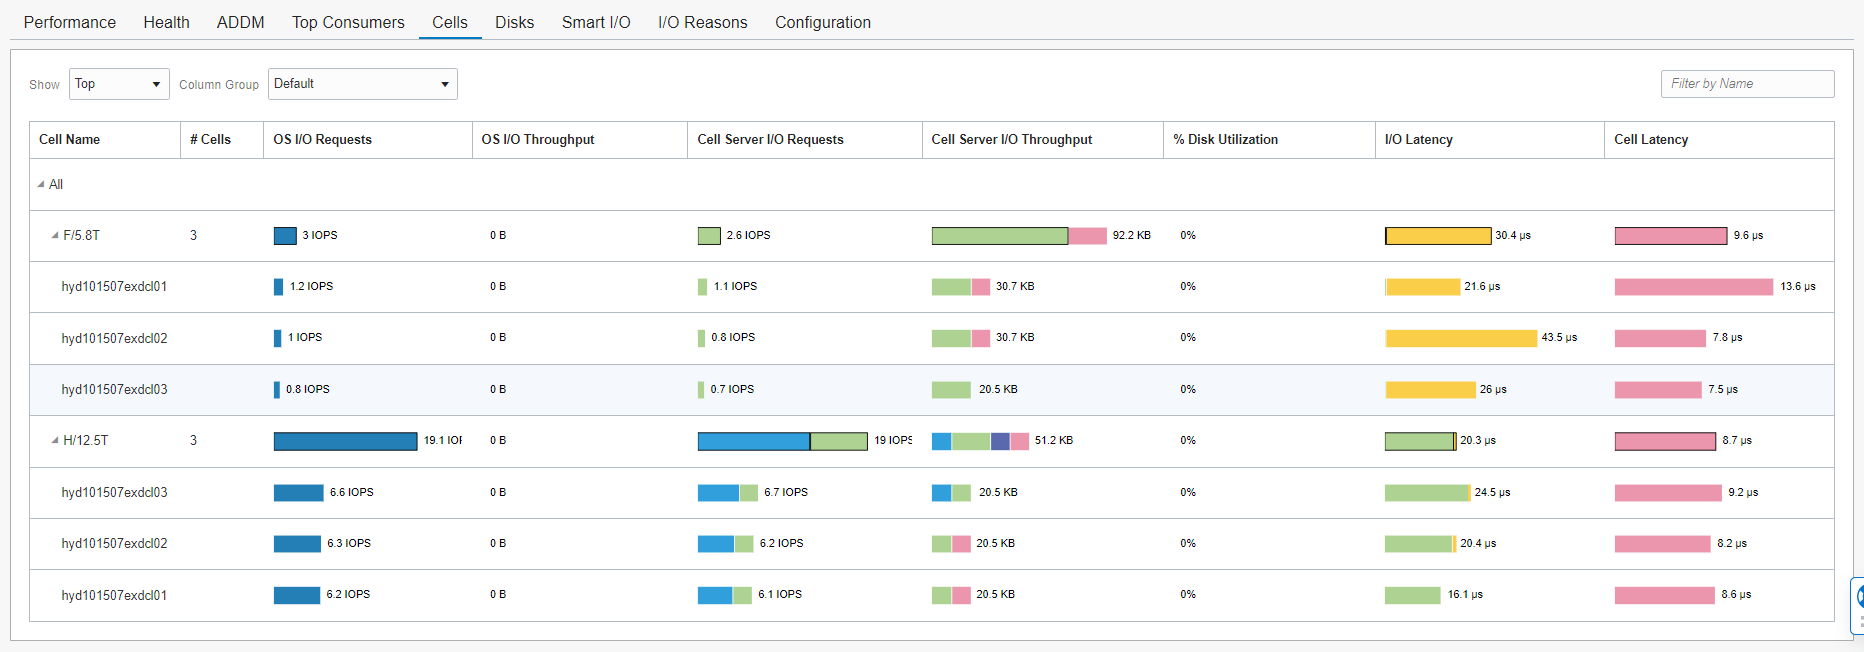
Figure 3: Cells and Disks section in Exadata tab of Performance Hub
Who’s consuming the I/O?
Consolidation of databases relies on a solid foundation of standardized system configurations and operational practices to meet the business goals of cost containment, simplified operations, and improved security, while delivering the required level of application performance. Standardized configurations must also provide sufficient flexibility to meet the needs of the business.
Database performance is closely related to system capacity allocated to the database, but these aspects are ultimately separate in system management. You can often improve performance by allocating more resources to a database, while performance tuning of the database can often reduce resource usage. So, performance and capacity are linked but must be addressed separately. This section addresses the amount of resources and capacity assigned to each database and doesn’t address database and application performance tuning.
The Top Consumers section in the Exadata tab provides detailed data for analysis of capacity usage for Oracle databases and the systems that host Oracle databases. You can identify workload distribution across all the databases and databases consuming a significant amount of the I/O bandwidth. It also displays the IORM queue time, the details of the top databases per cell, and the details of the IORM queue time.
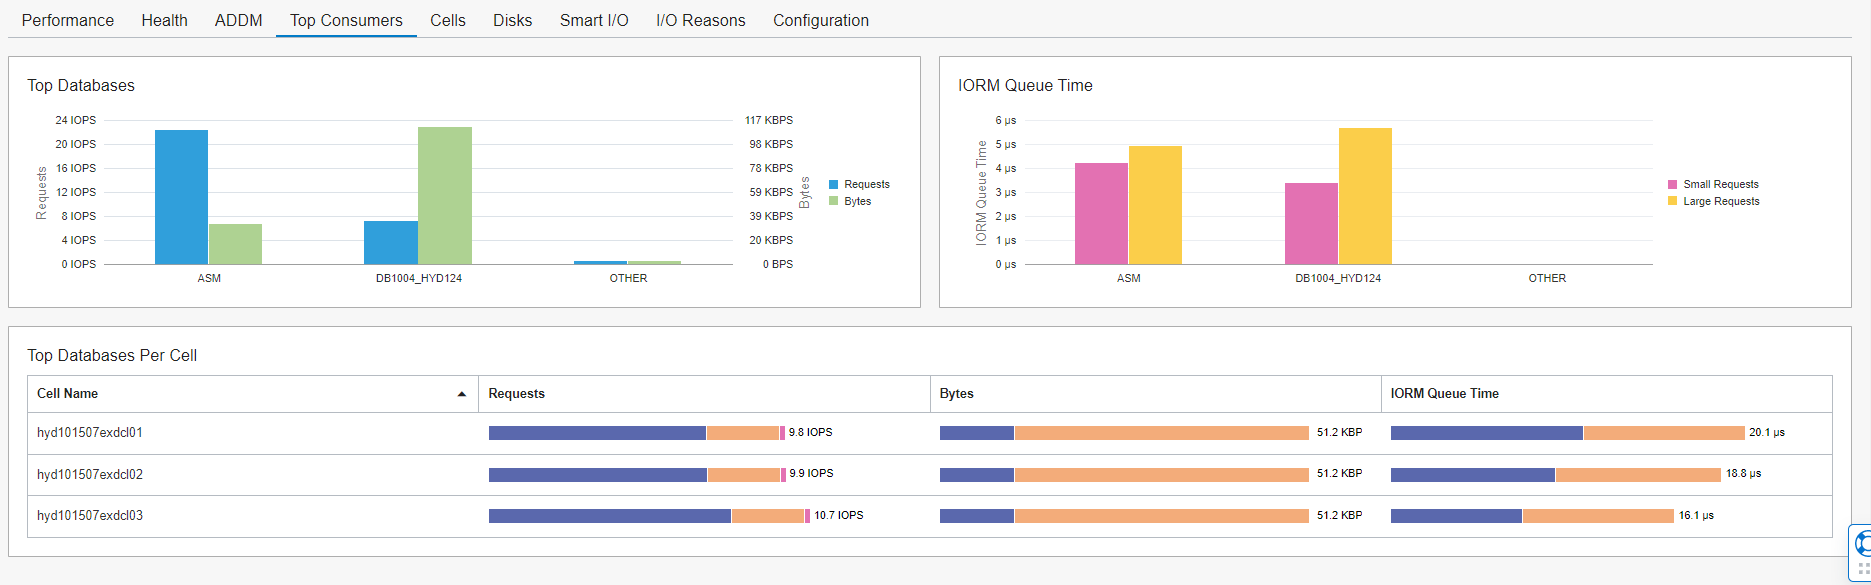
Figure 4:Top Consumers section in Exadata tab of Performance Hub
Automatic database diagnostics monitoring (ADDM)
When problems occur with an application, it is important to perform accurate and timely diagnosis of the problem before making any changes to a system. Often a database administrator simply looks at the symptoms and changes the system to fix those symptoms. However, long-term experience has shown that an initial accurate diagnosis of the problem significantly increases the probability of success in resolving the problem.
ADDM gives you the following capabilities:
-
Identify of root cause of a problem, not symptoms
-
Get Exadata-specific recommendations for treating the root causes of problems
-
Identify of non-problem areas of the Exadata system
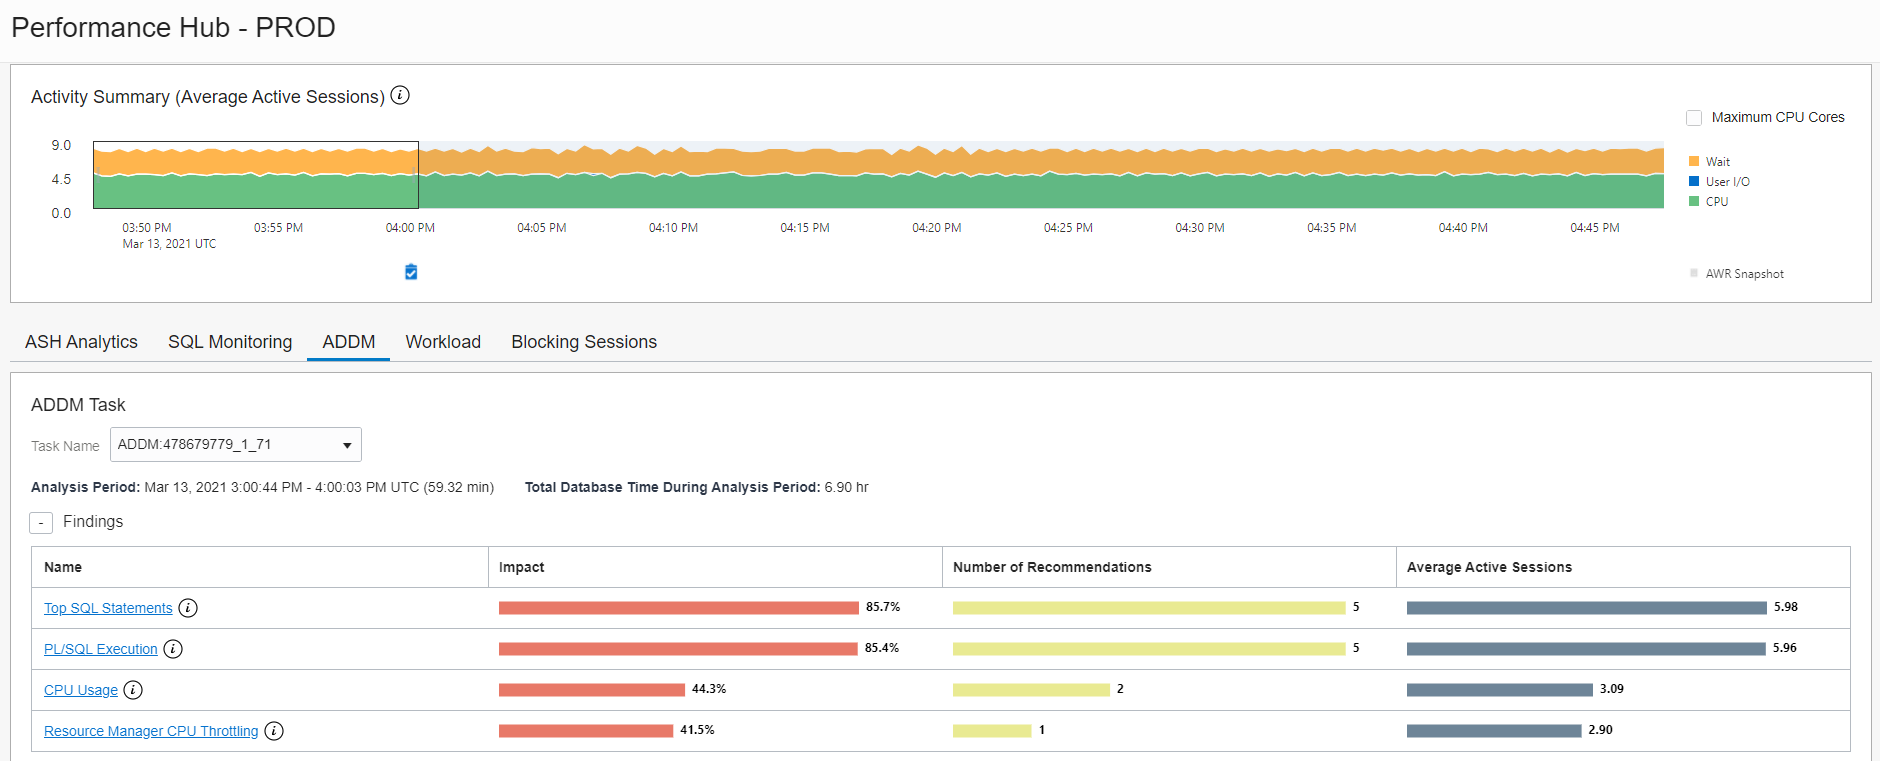
Figure 5: ADDM in the Exadata tab of Performance Hub
ADDM also addressed the following common problems:
-
Identify high I/O Load and categorize them by backup, ASM rebalance, user I/O, and so on
-
CPU bound cell
-
Outlier analysis to identify the one that is different (databases or disks)
-
Smart I/O for summaries of flash log and flash cache statistics by cell
-
Configuration issues like offline disks and versions
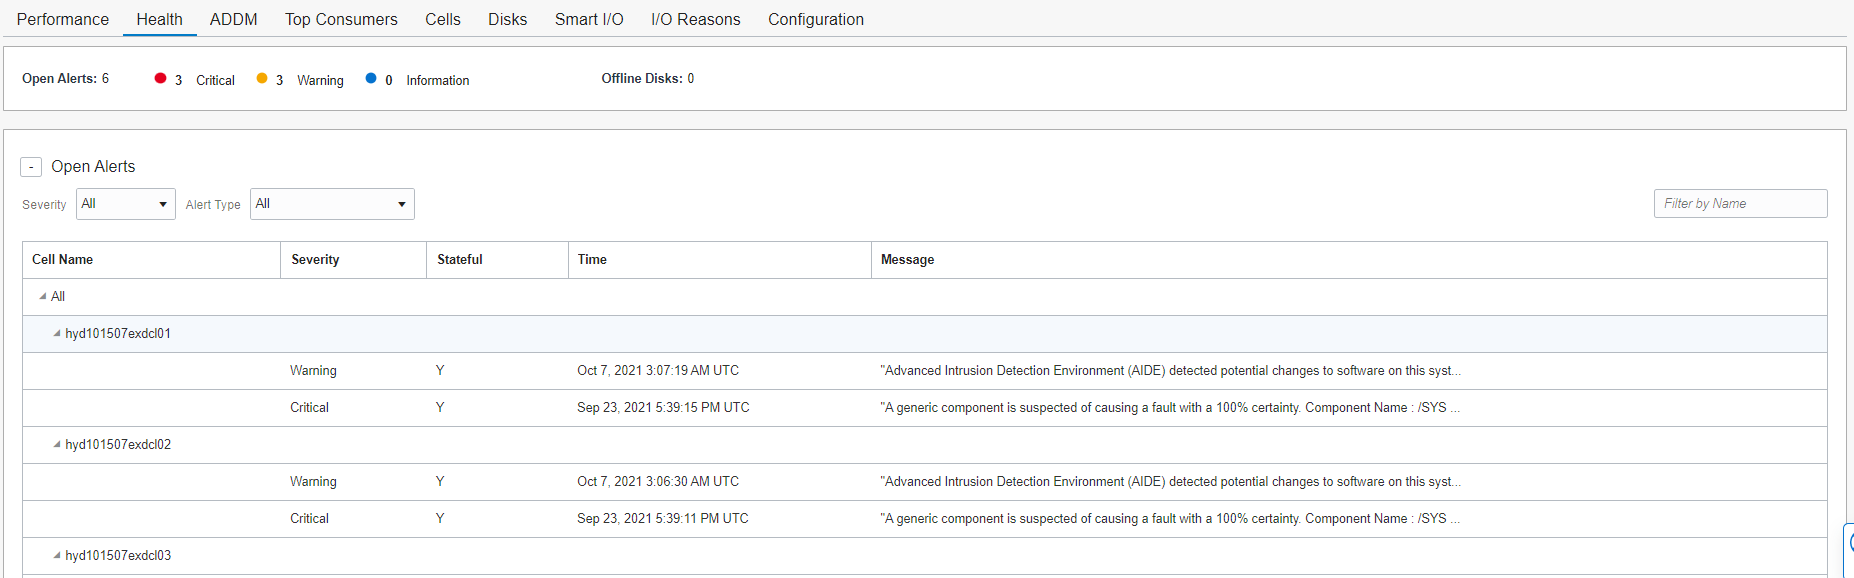
Figure 6: Health section of the Exadata tab of Performance Hub
Conclusion
Performance Hub provides you with a tuning methodology and rich set of features to help pinpoint database performance problems in your application. It takes time and experience to develop the necessary skills to accurately pinpoint critical bottlenecks in a timely manner. Performance Hub implements parts of the performance improvement method and analyzes statistics to provide automatic diagnosis of major performance issues.
The Exadata tab is available to use with Oracle Cloud Infrastructure Database Management service at an extra cost. The feature is accessible through the Console and is already available in all commercial regions, with government regions coming soon.
Sign up for an Oracle Cloud Infrastructure trial account! For more information about this feature and how you can use it, see the documentation.