In this article, we discuss how to instruct a Python application to send traces to Oracle Cloud Infrastructure (OCI) Application Performance Monitoring (APM) as a simple starter example.
OCI APM service provides deep visibility into the performance of applications and enables you to diagnose issues quickly to deliver a consistent level of service. APM supports OpenTracing, an API- and vendor-neutral instrumentation framework, allows application developers to instrument their application code and analyze the trace data in OCI APM.
In this example, we use zipkin tracers to instrument Python Flask-based web application. Various communities support zipkin libraries, and in this example, we use py_zipkin.
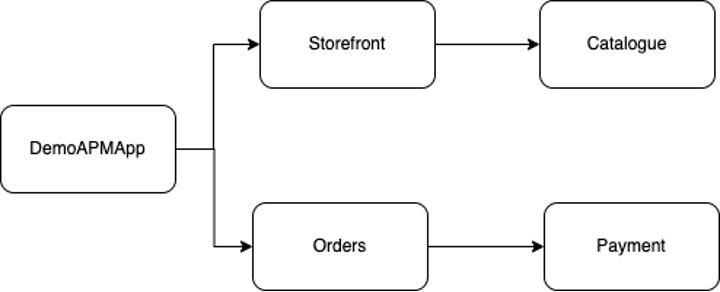
The Python application looks like the following service operations map. DemoAPMApp is the trace for the entire transaction, and the storefront, catalog, orders, and payment are individual spans
Prerequisites and dependencies
Use Python 3.0 and above, installing with the following command:
python3 --versionInstall the following dependencies:
pip3 install flask
pip3 install requests
pip3 install py_zipkin
Instrumenting the application
Before beginning, determine the APM endpoint URL. The documentation shows how to extract the APM data upload endpoint URL with pictures. Use the following steps to determine the endpoint:
-
Log in to Oracle Cloud Console. Under Observability and Management, choose Application Performance Monitoring, and Administration.
-
Create your APM domain.
-
Save the domain values for the data upload endpoint and public key.
Create a file named transport.py with the following code. Read the comments to substitute the values.
import requests

# Change this APM Endpoint url
apm_upload_endpoint_url=https://{APM_ENDPOINT_URL}/20200101/observations/public-span?dataFormat=zipkin&dataFormatVersion=2&dataKey={APM_PUBLIC_KEY};

def http_transport(encoded_span):
    result = requests.post(
      #Construct a URL that communicate with Application Performance Monitoring
      apm_upload_endpoint_url,
      data=encoded_span,
      headers={'Content-Type': 'application/json'},
      )
    return result
Create a file named oci-apm.py with the following code:
from flask import Flask  # include the flask library
app = Flask(__name__)
from py_zipkin import Encoding #import Zipkin package
from py_zipkin.zipkin import zipkin_span #import Zipkin package
from transport import http_transport #import Zipkin transport
import requests, time

@zipkin_span(service_name='storefront', span_name='service1-storefront')
def service1():
    time.sleep(2)
    service2()

@zipkin_span(service_name='catalogue', span_name='service2-catalogue')
def service2():
    time.sleep(5)

@zipkin_span(service_name='orders', span_name='service3-orders')
def service3():
    service4()

@zipkin_span(service_name='payment', span_name='service4-payment')
def service4():
    pass

@app.route("/tracing")
def apm_tracing():

    with zipkin_span(
        service_name="DemoAPMApp", #You can change it as you need
        span_name="Demo OCI APM App Spans", #You can change it as you need
        transport_handler=http_transport, #zipkin transport, will use it to upload trace data to OCI APM
        encoding = Encoding.V2_JSON,
        binary_annotations = {"oci-apm":"This is a Test APM tracing web application"}, #Custom tag
        sample_rate=100 # this is optional and can be used to set custom sample rates
    ):
        service1()
        service3()
    return 'This is a Test APM tracing web application'
if __name__ == '__main__':
   app.run(port=5000, debug=True) # application will start listening for web request on port 5000
This installation is technically one service because everything runs on one webserver. However, it tracks the service operations because we annotated every function.
The code includes the following steps:
-
Import the py_zipkin library.
-
Initialize the zipkin tracer with zipkin_span.
-
Annotated functions with service and span names.
-
The transport handler (http_transport) does the POST calls to APM service.
The following snippet of the encoded data for the storefront function is sent to APM:
{"traceId": "7c9de84a7xxxx", "id": "a32cae6exxxx", "name":
"Service1 storefront", "parentId": "7d11d0ede00de125", "timestamp":
1648082561061494, "duration": 2005185, "localEndpoint": {"serviceName":
"service1", "ipv4": "127.0.0.1"}}
Run and test
To run the code, input the following command:
$ python3 oci-apm.pyThen, test the code with the following command:
$ curl http://127.0.0.1:5000/tracing
Viewing the traces from the Console
Log in to Oracle Cloud Console. Under Observability and Management, choose Application Performance Monitoring and Trace explorer.
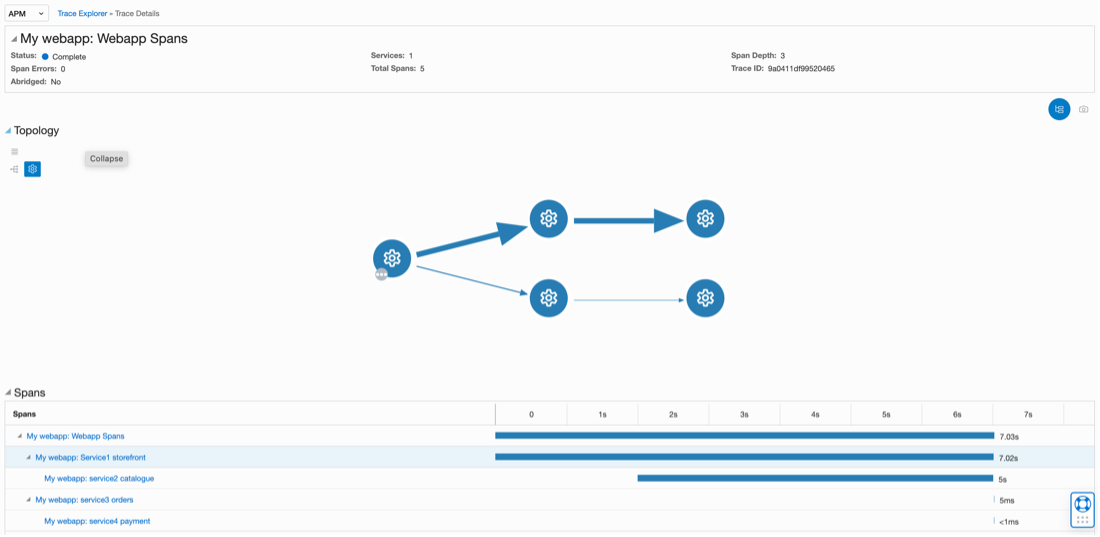
APM shows the service map and the entire trace plus the spans. According to the sleep statements, service1 took seven seconds, service2 took five seconds, and other functions took close to milliseconds.
Conclusion
You can use APM to analyze application performance by instrumenting the application using open source tracers like zipkin. I hope that this simple example helps you get started with your own deployments.
You can find code and instructions on GitHub. For advanced use cases, follow Application Performance Monitoring: Instrumenting Python Applications.