 A broader industry trend is driving IT leaders to consolidate observability data across technology domains, hybrid, and multicloud infrastructures into a centralized repository. We can see this trend today in the Logging service, where our customers are taking logs to third-party tools for consolidation and log analytics. Consolidating all observability data in one location can enable scenarios such as event correlation and contextualization using AIOPs tools, compliance scenarios such as long-term retention beyond 90-days offered by Oracle Cloud Infrastructure (OCI) Monitoring service, and predictive analytics using historical usage data.
To enable these scenarios, customers have been asking us for a way to export metric data out of the OCI Monitoring service. In my previous post, OCI Monitoring makes it easy to export metrics, I introduced an OCI function that made it easier to export metrics. The sample function we published is great for one-time export of metrics for a specific period, but what if you want to continuously export metrics on a near real-time basis?
Enter Service Connector Hub
Today, we’re making it even easier to export metrics! You can now create a service connector and point it to a source (compartment and metric namespace) to export metrics to a destination, such as OCI Object Storage, Streaming, and Functions. If the service connector is active, the metrics flow to your intended destination.
You can also use the OCI Functions service to do lightweight data transformations or operations on the metrics before they reach the destination. Some examples of these data transformations include converting JSON to CSV, filtering the data, or creating a stream of data based on some subset of the original stream data.
How it works
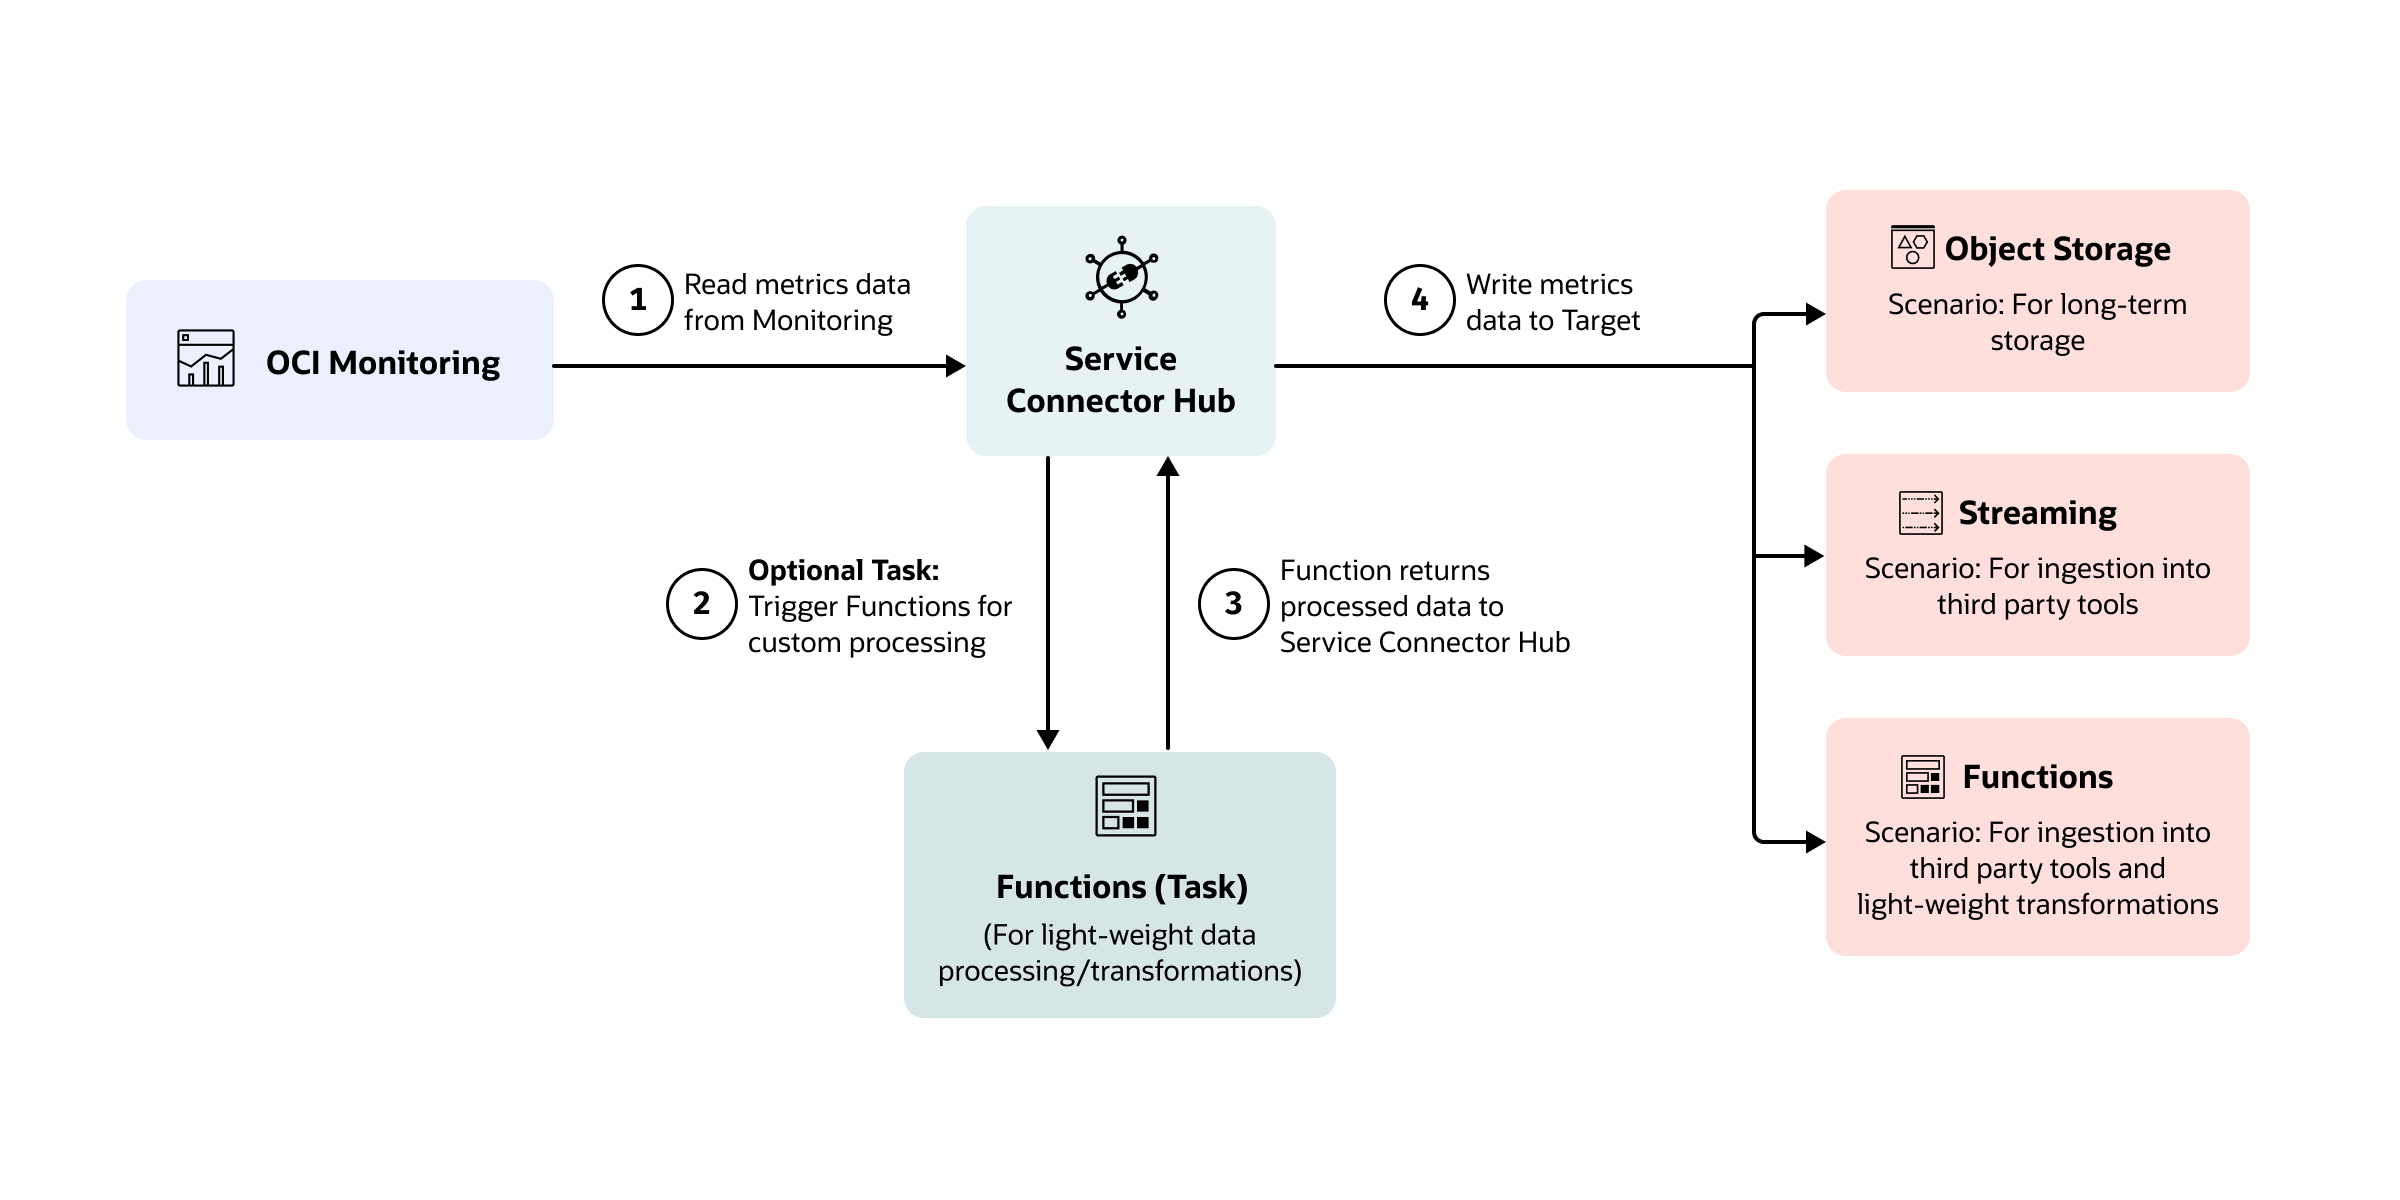
The process involves the following steps:
-
Connector reads metrics data from the OCI Monitoring service.
-
The data can be processed using a Functions task, such as data transformations and format changes.
-
The processed data is returned to the connector.
-
Connector writes the processed metrics data to the selected destination, such as Object Storage, Streaming, or Functions.
Walkthrough
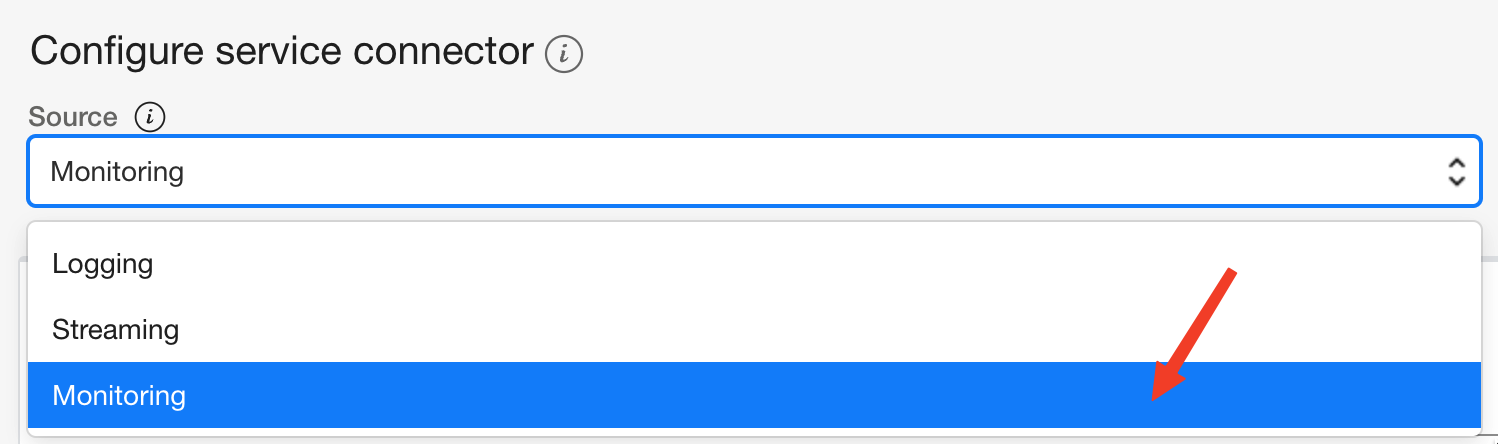
The easiest way to set up the architecture is using the Oracle Cloud Console. Start by creating a connector by selecting the “Monitoring” source.
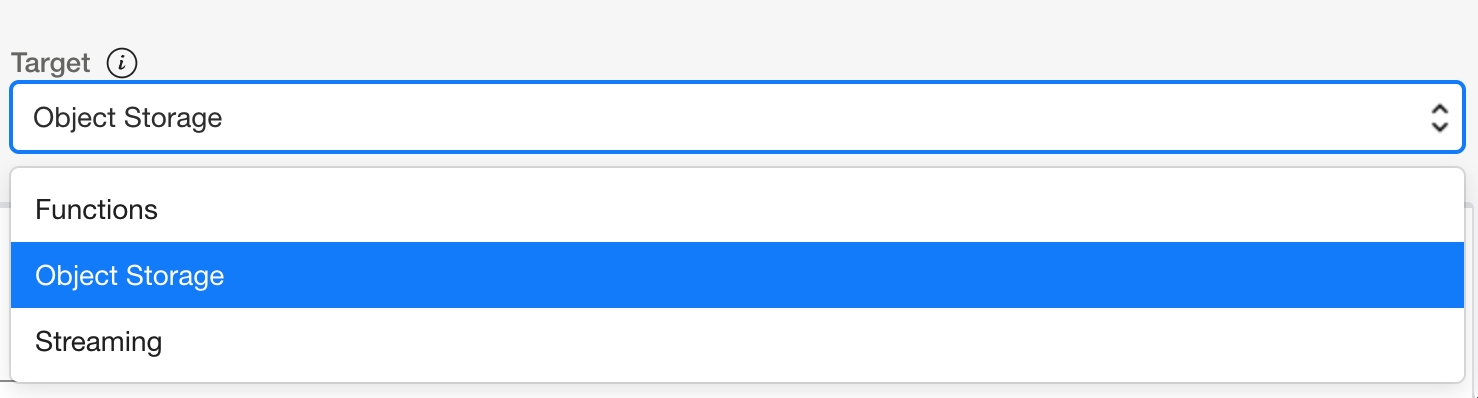
Now, select an appropriate destination for your scenario. In this example, I use Object Storage as the destination.
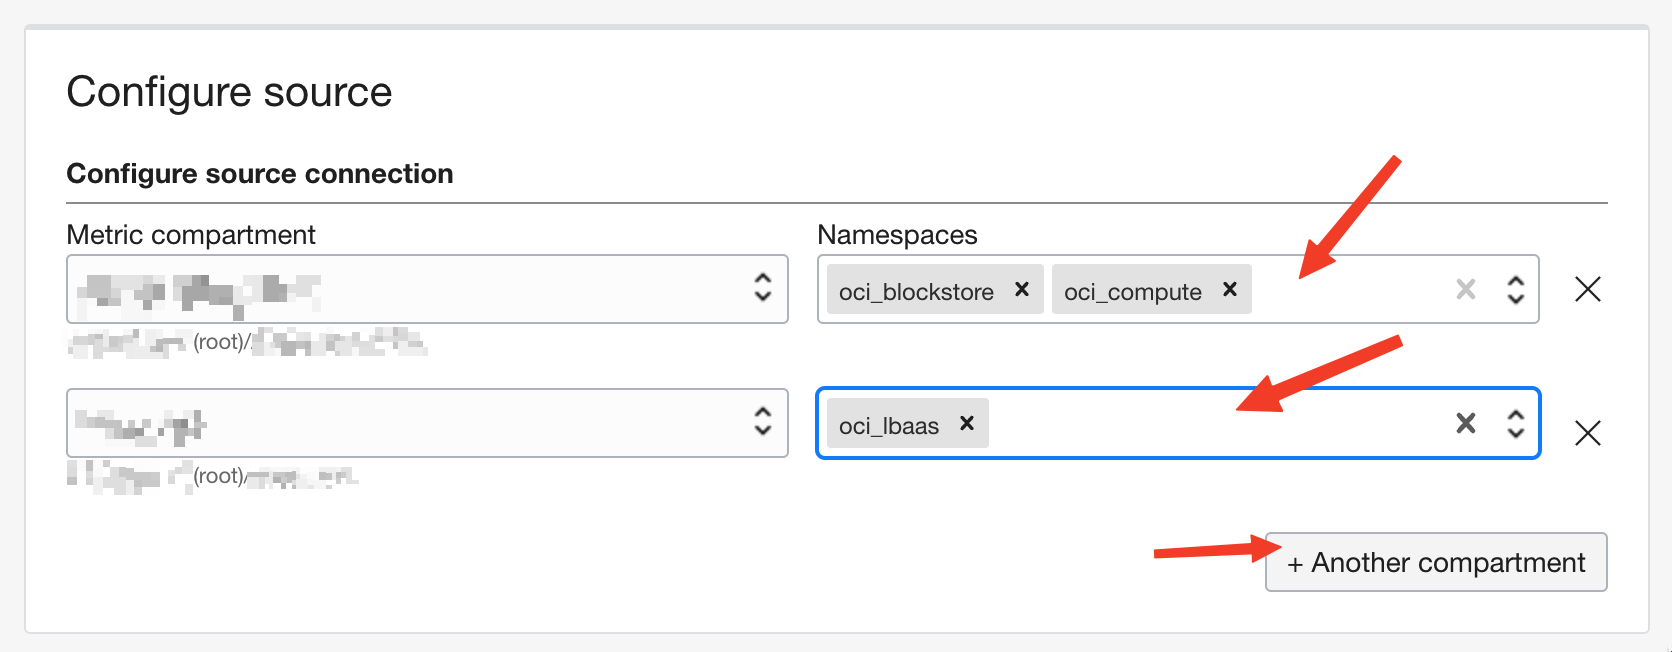
Next, select the compartment for your metrics and then select the metric namespaces. You can select more than one namespace per compartment.
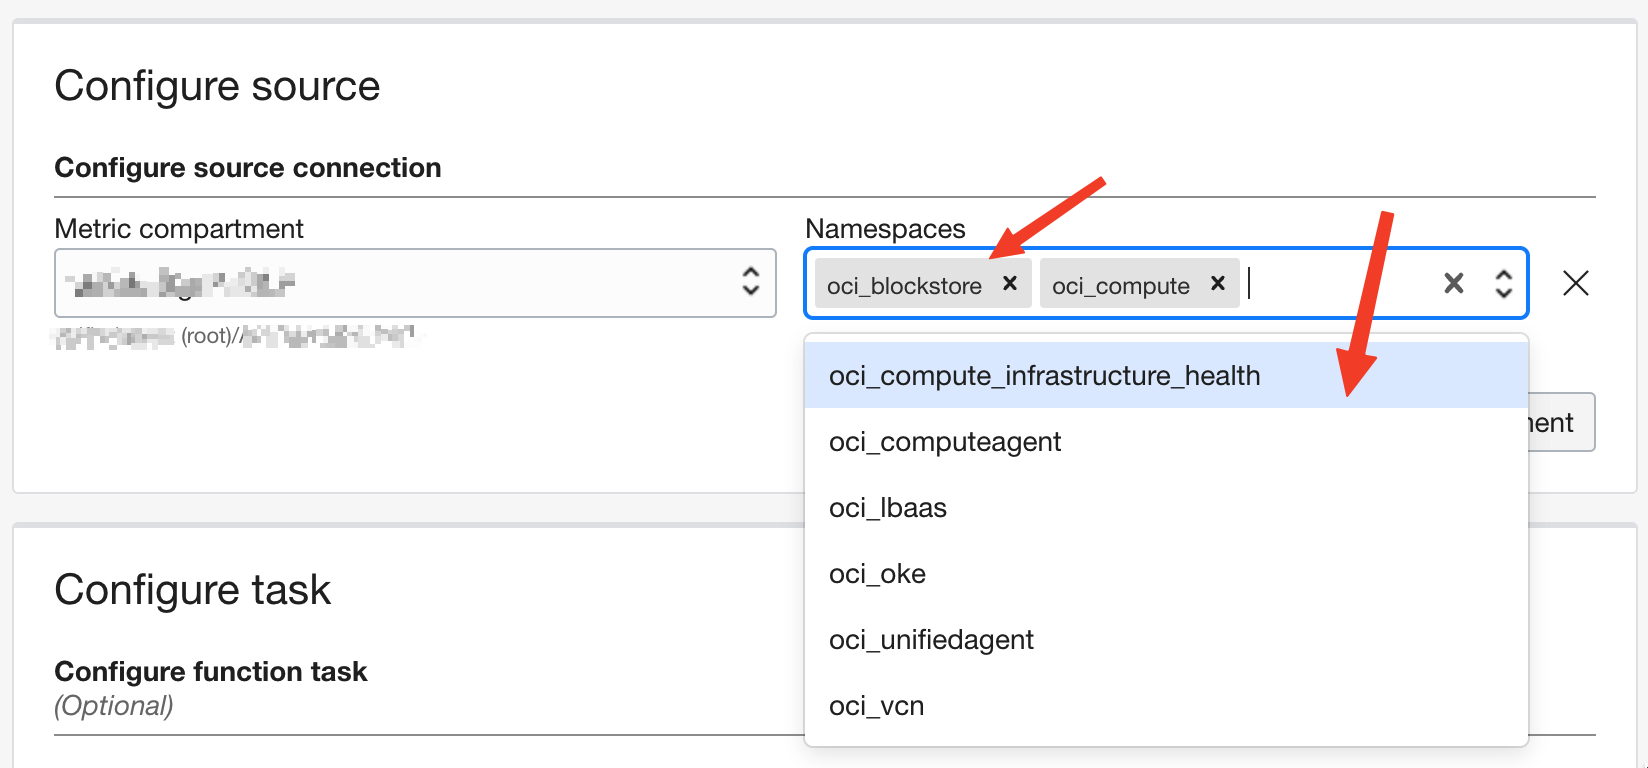
You can also extract metrics from multiple compartments using the same connector.
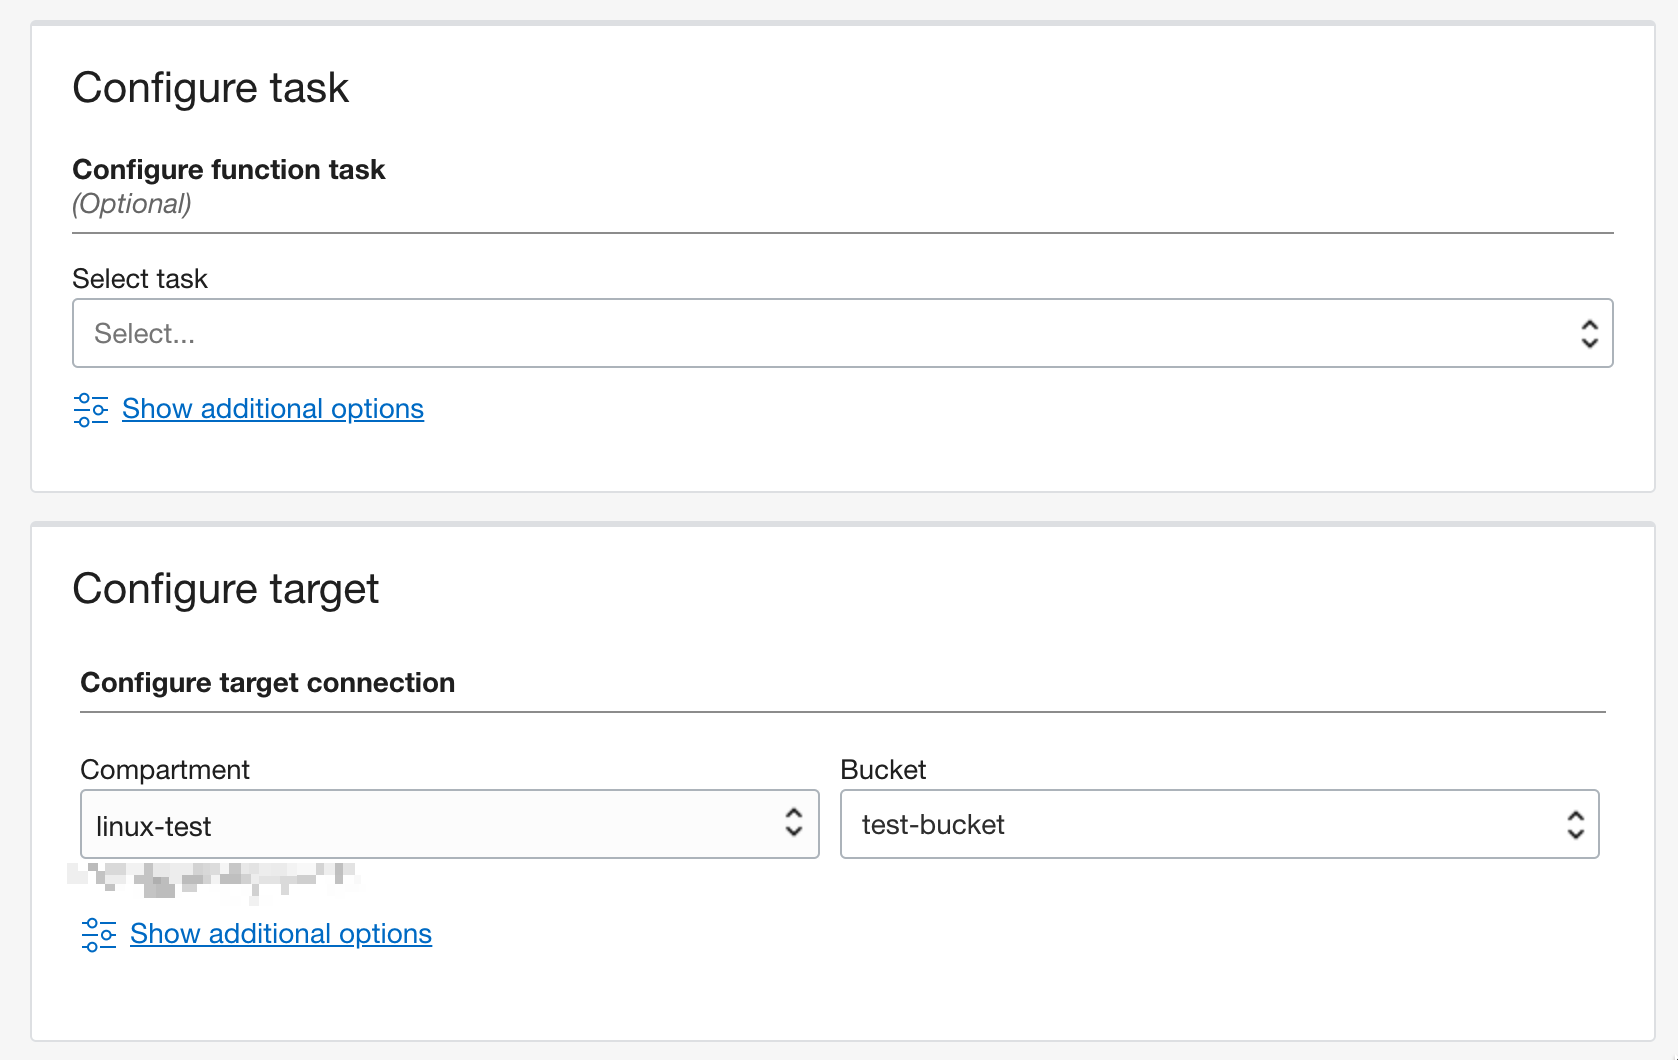
Next, configure the task and target or destination details, and you’re done! When the connector is created, it begins exporting metrics to your chosen destination.
Get started today
This feature is live in Ashburn and Phoenix regions today. All other regions are coming soon!
For more information about Service Connector Hub, see the following resources: