Last year, we announced the general availability of Oracle Cloud Infrastructure (OCI) Database Management service for Oracle Database. The general theme of the release and subsequent features focused on the general management, performance tuning, and lifecycle management of databases. Database Management service now supports enhanced diagnosability through support for database alert and attention logs. With this addition, we have now integrated fault diagnosability into Database Management that simplifies the key task of collecting and managing diagnostic data to triage and quickly resolve database events or incidents.
Diagnosability for databases
Oracle Database service includes an advanced fault diagnosability infrastructure for collecting and managing diagnostic data and resolving database incidents. Diagnostic data includes the trace files, dumps, and core files, plus new types of diagnostic data that enable customers and Oracle Support to identify, investigate, track, and resolve issues quickly and effectively. This feature focuses on Database Management support for database alert and attention logs.
Effective database diagnosability for database administrators
A common task for a database administrator (DBA) is to monitor alert and attention logs generated from a database or fleet of databases, starting from Oracle Database 21c and later. These tasks include reviewing critical and highly visible database events and using them to quickly access detailed information and take appropriate action.
Viewing the alert log for real-time diagnostics use cases
The alert log is an XML- or text-based file that’s a chronological log of messages and errors. Each alert log is specific to its component type, such as database, Oracle Automatic Storage Management (ASM), listener, and Oracle Clusterware.
For the database, the alert log includes messages about the following factors:
- Critical errors (incidents)
- Administrative operations, such as starting up or shutting down the database, recovering the database, creating or dropping a tablespace, and others
- Errors during automatic refresh of a materialized view
- Other database events
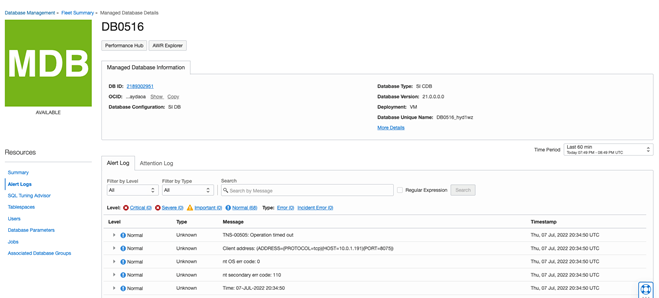
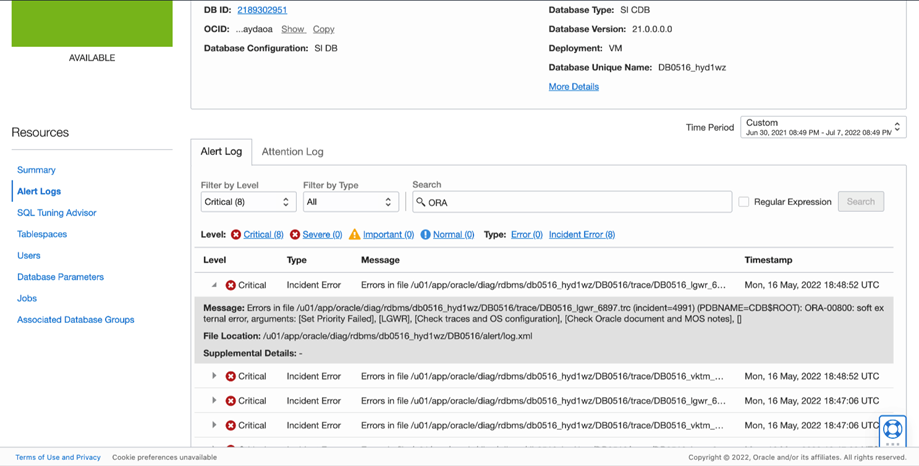
By using the Alert Log tab within the alert logs resource link, you can easily search, including using regular expressions, for various levels of database errors, such as critical, normal, important, and so on. You can also filter by type of error with corresponding messages and the relevant timestamps for real-time issue diagnostic use cases.
Viewing the attention log for critical events that need attention
The attention log is a structured, externally modifiable file that contains information about critical and highly visible database events per database instance. Use the attention log to quickly access information about critical events that need action.
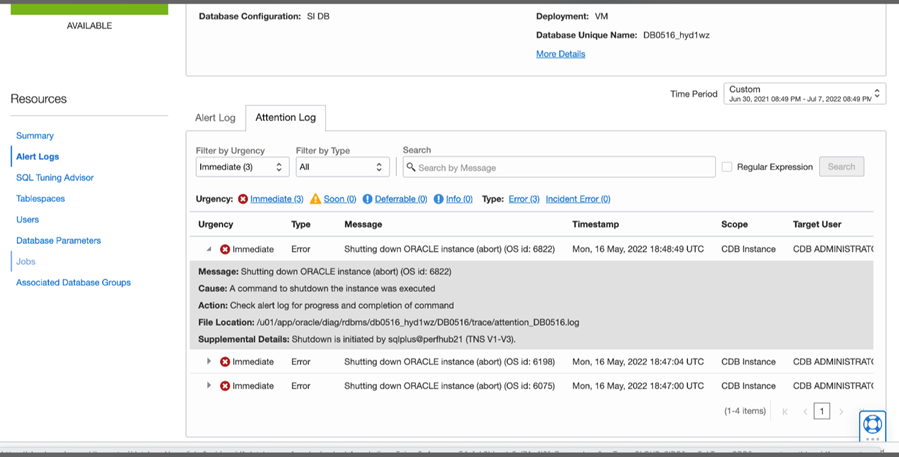
By using the Attention Log tab within the alert logs feature, you can easily search, including using regular expressions, for various urgency levels, such as immediate, soon, deferable, and so on. Moreover, you can filter by type of urgencies with corresponding message and the relevant timestamps, scope, and target user for real-time issue diagnostic use cases.
Conclusion
Having a standardized strategy in your organization or team for diagnosing database errors is important to reduce human errors. Using OCI Database Management service’s database alert logs feature for alert and attention logs support, you can get to the root cause of incidents by easily and quickly searching and filtering for relevant database errors and events, saving valuable time.
Sign up for an Oracle Cloud Infrastructure trial account today! For more information about these features and how you can use them, see the documentation.
