Did you know you can join data from multiple sources, write your own SQL queries, and include files and data from local subject areas into a single dataset? Did you know that you can schedule an automatic reload of your dataset to keep your dashboards up-to-date? Keep reading and I’ll show you the hidden potential of working with datasets in the Dataset Editor of Oracle Analytics Cloud.
Join data from multiple external sources
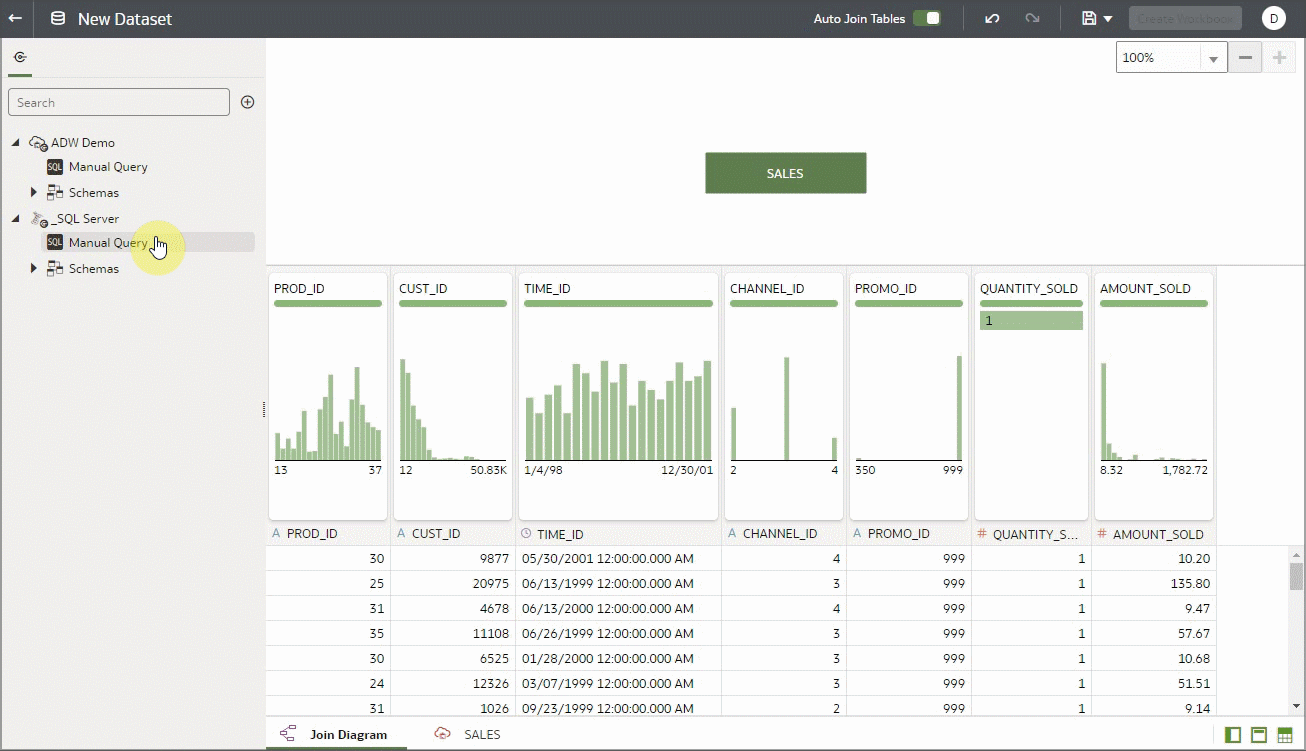
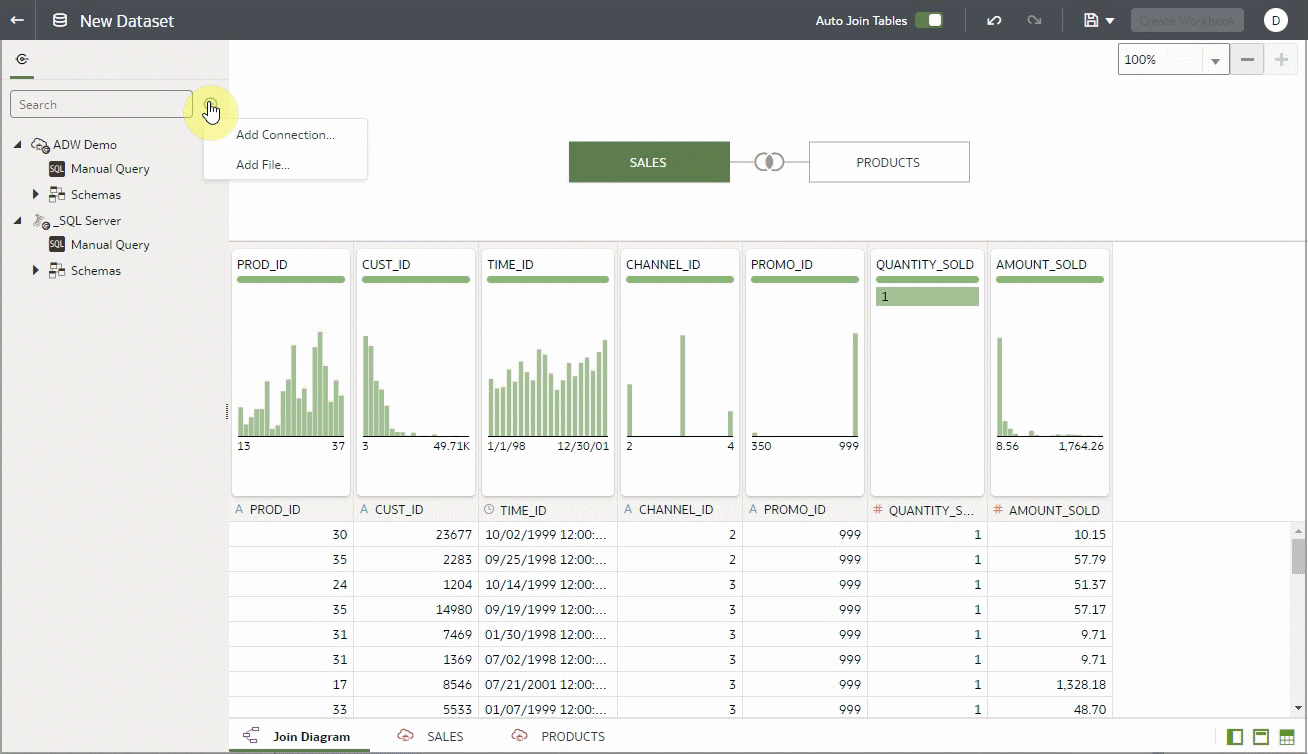
Oracle Analytics Cloud (OAC) allows you to easily create connections to many external data sources and then use them to create single datasets with data joined from those multiple sources. All you need is for you or your administrator to create a connection to an external data source and to use that connection in the Dataset Editor to pull in data using tables from one or more sources. The following example shows joining a Sales table from a connection to Oracle Autonomous Data Warehouse (ADW) with a Product table from a connection to Microsoft SQL Server. After adding both tables from the two sources to the Join Diagram, you can join the two tables by selecting the join keys from the dropdown list in the Join dialog and you now have a multi-table dataset. Keep reading below to make this dataset even more interesting with additional capabilities from the Dataset Editor.

Use a manual SQL query to create a table from a connection to a database
OAC allows you to easily create connections to a large number of external sources. Most of these sources are relational databases, and as the previous example showed, you can create datasets from these sources by dragging and dropping tables from the navigation pane. There are times when dragging and dropping an entire single table isn’t desirable. For example, suppose that you need to add the contents of a table in a database that match only one particular condition based on other tables using a subquery. Or suppose that you need to provide column names with more human-readable names as part of a query. The queries might be simple or complex; as long as they originate from valid SQL code, you can test them to ensure that they return the expected data and columns. The next example uses a very simple Select star query to return all columns from the Product table using the SQL Server connection while adding a condition based on a subquery to pull only rows from the Product table when a particular condition is satisfied in a secondary table, which won’t be part of the dataset. First you drag the “Manual SQL” node to the Join Diagram, double-click the Manual SQL node in the diagram (which displays the Query Builder page for entering the query), and test it by clicking Get Preview Data on the bottom panel.
Join data from a file in the dataset
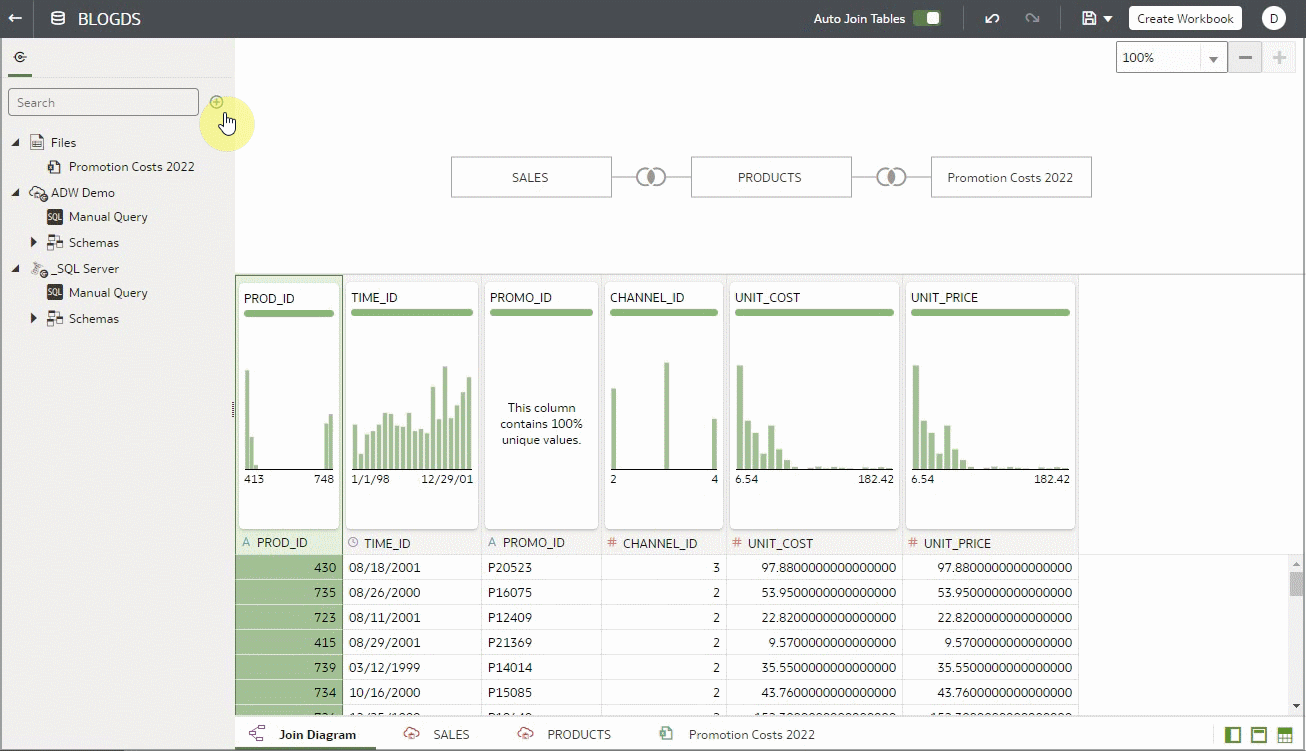
In addition to data from relational sources and from subject areas, you can join tables from external sources with data from files such as CSV or Excel, which continue to be ubiquitous in most organizations. The next example shows how easily in the Dataset Editor you can add a file from the local drive by clicking Add, selecting Add File from the options, and navigating in the file explorer to where the file to add to the dataset resides. After selecting the file, review the sample rows and verify that the data is correct to add, and click OK. The file that’s uploaded becomes a table node in the join diagram, just like the other tables from relational sources that you can join to the appropriate table based on the available join keys. You must be able to join the file to one of the existing tables before saving the dataset.
Join data from a local subject area in your dataset
Another powerful capability of the Dataset Editor is the ability to join local subject areas with data from other sources. Previous examples show joining tables from two relational databases and adding a file to the mix. The next example adds one more table from a local subject area to the dataset. The flow is similar to the Manual SQL flow. Click Add and select Add Connection from the options, then select Local Subject Area from the available connections. A Local Subject Area connection is displayed in the navigation panel. The Local Subject Area connection also has a Manual SQL option, but for this example, you drag and drop “A – Sample Sales” subject area to the canvas and a node is created in the join diagram with the name of the subject area that was just dragged. The next step is to double-click the Local Subject Area node and select which data from the subject area to join with the other tables in the dataset. Double-clicking displays a page for visually navigating and selecting the data from the subject area. You can select data from multiple tables in the subject area, and they’ll all be part of the single table node that was just created. This example selects some additional product information; you must make sure to change the name of the node in the name field so that it reflects the data being selected from the subject area. When you click OK, you see a table that you can join with the rest of the tables in the dataset that contain information from the subject area.
Set a reload schedule for your cached datasets
Did you know that you can create data reload schedules for your datasets? The previous examples assumed that all the tables in the dataset are set to cached mode for performance reasons. To keep cached data up-to-date, you can create schedules to automatically reload the data periodically. The next example shows creating a schedule for reloading data for a dataset by opening the Inspect dialog for the dataset and clicking the Schedule tab. The system offers several useful scheduling options, such as time of day to run the reload, and a frequency such as daily, weekly, or monthly. Select a weekly reload every Monday and click OK to activate it. To check the status of reloads, in the Inspect dialog in the dataset, click the History tab to display the status of all the completed and pending reload runs. If you click the row, you see additional details of the reload. If you click the completed link, the system displays the status for the individual tables in the dataset. The file wasn’t reloaded, because files can’t be automatically reloaded, but all the other tables in the dataset, including the cached table from the local subject area were reloaded per the schedule.
Call to Action
I hope that you found this information useful and that you’ll experiment with these new Dataset Editor features in OAC. Whether you’re working with small spreadsheets or big tables from a data warehouse, or in the examples above trying to join them, there’s nothing better than spending less time wrangling data and spending more time where the value is — analyzing your data! And make sure to stay tuned for additional blogs with more tips and tricks!
See also Work with Dataset Reload Schedules.