A step-by-step guide to accessing, exploring, and exporting AI Assistant reaction logs.
Oracle Analytics Cloud generates diagnostic information that helps you understand what’s happening behind the scenes—whether you’re troubleshooting an issue, checking performance, or looking at how the Oracle Analytics AI Assistant behaved. With Oracle Cloud Infrastructure logging, you can easily collect all these details in one place, search through them, and send them wherever they need to go for long-term storage or deeper analysis.
This article walks you through the end-to-end flow:
Enable diagnostic logging in Oracle Cloud Infrastructure, explore the logs in Log Explorer (including AI Assistant reaction details), and optionally automate log delivery to Object Storage using connectors.
Why logging matters for Oracle Analytics Cloud
Diagnostic logs from Oracle Analytics Cloud help administrators, developers, and support teams to monitor:
✓ System behavior
✓ Errors and warnings
✓ User request traces
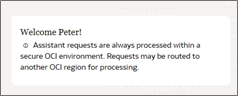
✓ AI Assistant reaction details
✓ Data model context
✓ Performance and execution metadata
✓ Additional JSON metadata for deep analysis
With just a few clicks in Oracle Cloud Infrastructure, you can turn these diagnostics into a powerful operational asset.
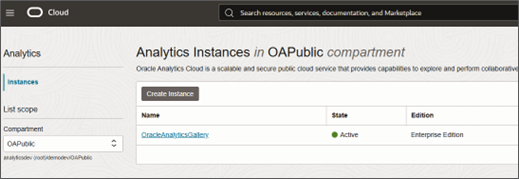
I. Identify the Oracle Analytics Cloud instance
Start by confirming which Analytics instance you want to collect logs from—for example, a production Oracle Analytics Cloud environment where AI Assistant is heavily used, or a test or gallery instance where you’re experimenting with prompts and reactions.
Having the right instance and compartment in mind will simplify configuration in the later steps.
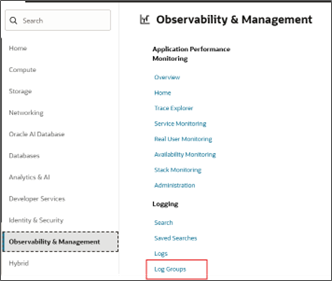
II. Navigate to Oracle Cloud Infrastructure logging
From the Oracle Cloud Infrastructure console:
- Open the Navigation Menu.
- Navigate to Observability & Management, and under Logging, select Log Groups.
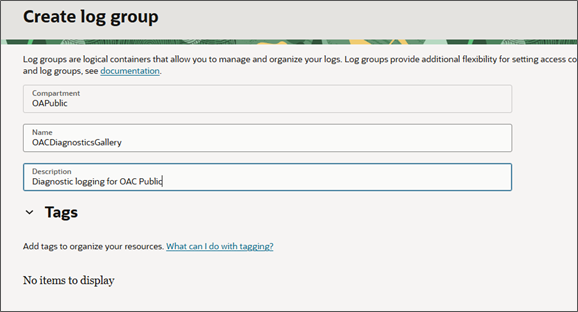
III. Create a log group
A log group is a logical container for one or more logs tied to resources like your Oracle Analytics Cloud instance.
- Click Create log group.
- Enter a Name and Description that clearly identify the purpose—for example:
- Name: OACDiagnosticsGallery
- Description: Diagnostic logging for OAC Public
- (Optional) Add tags to align with your organization’s tagging strategy.
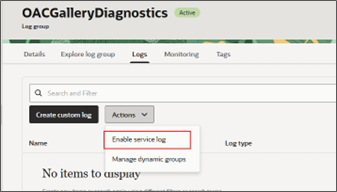
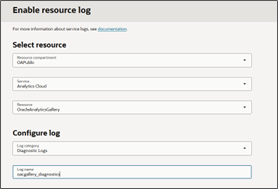
IV. Enable the Oracle Analytics Cloud diagnostic service log
Next, enable the actual diagnostic log stream for your Oracle Analytics Cloud instance:
- Open your newly created Log Group.
- Go to the Logs tab.
- Under Actions, select Enable service log.
- Configure the log:
- Service: Analytics Cloud
- Resource: Oracle Analytics Cloud instance
- Log category: Diagnostics
- (Optional) Customize the log retention under advanced options, depending on your compliance and storage needs.
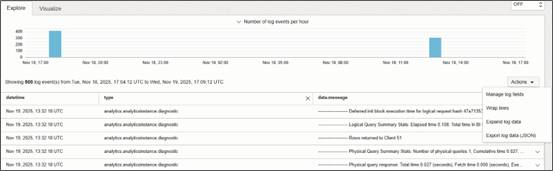
V. Explore logs with Oracle Cloud Infrastructure log explorer
The recommended method of analyzing Oracle Analytics Cloud logs is to use the automated Object Storage method discussed in step IV.
Once diagnostics are flowing, Log Explorer becomes your primary workspace for investigation and analysis.
From the log group details page:
- Click Explore log and then Explore with log search.
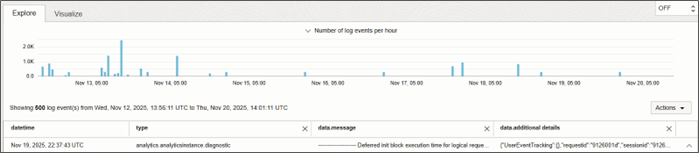
- Set time range filters to narrow down to specific windows.
- Set additional log fields under Actions, Manage log fields, including AI Assistant–specific details.
- Search and filter log entries based on text, structured fields, or both.
- Export logs as JSON, which zips and downloads the selected time range into a single text file.
View AI Assistant reaction details
AI Assistant reactions expose rich metadata through the additionalDetails section of each log entry. When you enable the relevant fields, you’ll see attributes such as:
- parentEid – correlation to the parent event or conversation
- feedback – user feedback (e.g., positive/negative)
- datamodelName –subject area or dataset was involved
- feedbackDetails – qualitative notes, for example, “Too much text in ambiguity”
- feedbackCategory – e.g., OTHER
- utterance –user’s natural-language question, such as “how well is the store utilizing its area”
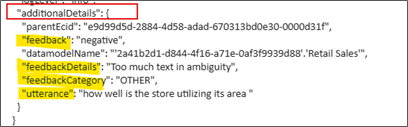
The highlighted JSON block showcases an example AI reaction entry, which you can use for quality review, tuning, or audit.
VI. (Optional) Automate log delivery with Oracle Cloud Infrastructure connectors
If you want to share diagnostic logs with a broader audience or integrate them into other platforms (like SIEM tools), you can automatically push them to Object Storage using Oracle Cloud Infrastructure logging connectors.
From the Logging section:
- Click Connectors and then Create connector.
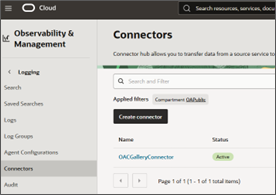
- Provide a Connector name, Description, and Compartment.
- Set Source to Logging and Target to Object Storage. Make sure the target Object Storage bucket is created ahead of time.
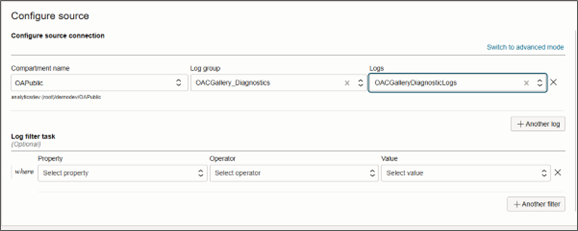
The Create connector image shows a typical setup where diagnostic logs for an Oracle Analytics Cloud gallery instance are continuously streamed into a dedicated bucket.
Configure the source and target
Within the connector configuration:
- Configure the source:
- Choose the compartment.
- Select the log group (e.g., OACGallery_Diagnostics).
- Select the specific logs you want to collect, such as your Diagnostics log.
- Configure the target:
- Choose the target compartment and bucket.
- Optionally set an object name prefix (e.g., SampleLogs/).
- Define batching options for how frequently log files are written.
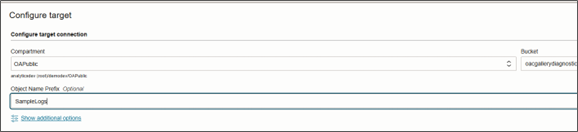
- Allow Oracle Cloud Infrastructure to automatically create the required IAM policy so the connector can write to Object Storage.

- Click Create to provision the connector. It will transition from Provisioning to Active, at which point log delivery begins.
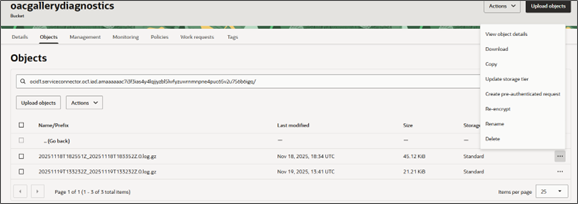
VII. Consume logs from Object Storage
As soon as the connector is active:
- Diagnostic logs start appearing in the target bucket as GZIP files.
- You can download, copy, retier, rename, or delete individual objects.
- For users who don’t have console access, you can generate a pre-authenticated request (PAR) that grants bucket or object-level access to the logs.
This pattern is ideal for sharing AI Assistant reaction logs with data science teams, auditors, or centralized logging and monitoring systems.
Recommendations and tips
- Align retention with policy: Use the log retention settings and Object Storage lifecycle rules to match your organization’s compliance requirements.
- Standardize naming: Apply consistent log group, log, and bucket naming conventions across environments (DEV/TEST/PROD).
- Leverage AI details: Regularly review additionalDetails for AI Assistant reactions to improve prompt design, training content, and user experience.
- Automate exports: Use connectors and Object Storage prefixes per environment or application to keep log archives organized and easy to query.
Oracle Cloud Infrastructure logging gives Oracle Analytics Cloud customers a powerful diagnostics backbone—spanning real-time search in Log Explorer, deep visibility into AI Assistant reactions, and automated archiving to Object Storage. By following the steps in this article, you can:
- Turn on Oracle Analytics Cloud diagnostic logging in minutes
- Explore detailed AI Assistant reaction metadata
- Automate long-term log delivery and access for broader teams
With these foundations in place, Oracle Analytics Cloud becomes not just an analytics platform, but a fully observable, auditable, and AI-transparent environment.
For the next step, see the blog article, Analyze Oracle Analytics AI Assistant Usage and Feedback using OCI Logs for a walk through of how to transform these logs into a structured view and analyze them using an Oracle Analytics Cloud dashboard.
Call to action
Visit us at the Oracle AI Data Platform and Analytics Oracle Community or Oracle Help Center for additional details.