This blog is part of a series of “best practice” blogs for Oracle Analytics.
When you tune queries for Oracle Analytics, you look at the data model, report design, dashboard design, network configuration, and sometimes you need to investigate the database. For database investigations, you need to know the SQL_ID of the SQL statement so you can track the specific query through Active Session History (ASH), Automatic Workload Repository (AWR) and Oracle SQLTXPLAIN (SQLT).
This blog shows you how to find the SQL_ID by mining the Oracle Analytics Usage Tracking tables and the Oracle database system table V$SQL (or GV$SQL for a RAC database).
V$SQL Table
V$SQL is an Oracle database system table that tracks statistics for individual SQL queries. There’s one row in the table for each SQL statement that you run and each row is uniquely identified by the SQL_ID column. You can use this SQL_ID to track a given SQL statement throughout the Oracle database.
You’ll find lots of useful information about your queries in the V$SQL table (or GV$SQL for a RAC database).
Usage Tracking Tables
The Usage Tracking tables don’t directly track the SQL_ID but you can easily trace SQL_ID back to the V$SQL table (or GV$SQL for a RAC database).
When you enable Usage Tracking in Oracle Analytics, all the queries are tracked in two tables:
- S_NQ_ACCT – contains logical queries
- S_NQ_DB_ACCT – contains physical queries
The logical query is logged in the logical table and the physical query (or queries spawned by the logical query) are logged in the physical query table.
You can join the logical and physical tables on the logical query ID column. The logical query ID column in the logical table is ID and in the physical table it’s LOGICAL_QUERY_ID.
The key to finding the SQL_ID is the PHYSICAL_HASH_ID column in the physical table. The PHYSICAL_HASH_ID value is also written to V$SQL (or GV$SQL) in the ACTION column. From the Managing Metadata Repositories Guide: “The Oracle BI Server calculates a hash code from the text of the Logical SQL query and the text of the physical SQL queries. The physical SQL hash code, of any SQL queries run from the Oracle BI Server, is recorded in the ACTION column in V$SQL.”
For more details see https://docs.oracle.com/en/middleware/bi/analytics-server/metadata-oas/associate-s_nq_acct-record-bi-query-log.html.
For more information about the various usage tracking columns, see:
- Configuring Oracle Analytics Cloud Guide https://docs.oracle.com/en/cloud/paas/analytics-cloud/acabi/track-usage.html#GUID-F54AC40D-E375-4AB7-B1B7-B401283E0D19 or
- Administering Oracle Analytics Server Guide https://docs.oracle.com/en/middleware/bi/analytics-server/administer-oas/understand-usage-tracking-tables.html
Set Up
Now you know where to find PHYSICAL_HASH_ID, it’s a relatively minor task to write a SQL statement that correlates the SQL running in the database with a specific analysis running in Oracle Analytics.
When the Usage Tracking tables are in the same database instance as the data warehouse, you can write a single query to find the SQL_ID.
If the Usage Tracking tables and your data warehouse are in different Oracle database instances, you need to run two queries. First, you run a query to pull the PHYSICAL_HASH_ID of the query you want to investigate from the Usage Tracking tables. Second, you pull the SQL_ID from V$SQL using the value of the PHYSICAL_HASH_ID to filter the ACTION column.
Examples
In this example, we assume that the Usage Tracking tables and the data warehouse are co-located. Any or all of the columns from the Usage Tracking and V$SQL tables can be used in the query but in this example, we select the following subset:
select
o.sql_id,
to_char(l.start_ts, ‘YYYY-MM-DD HH24:MI:SS’),
l.id as l_id,
p.logical_query_id,
l.hash_id,
l.saw_src_path,
l.query_src_cd,
l.success_flg,
l.num_db_query,
l.query_text,
p.query_text,
o.sql_text,
p.physical_hash_id,
o.action
from
usage_tracking.s_nq_acct l,
usage_tracking.s_nq_db_acct p,
v$sql o
where
l.id = p.logical_query_id and o.action = p.physical_hash_id and l.start_dt > trunc(sysdate – 1) and l.end_dt < trunc(sysdate)
order by l.start_ts, l.id, l.hash_id, p.physical_hash_id, o.sql_id;
In the second example, we assume that the Usage Tracking tables and the data warehouse are located in different Oracle databases.
First, we write a query against the Usage Tracking tables to get the PHYSICAL_HASH_ID.
select
to_char(l.start_ts, ‘YYYY-MM-DD HH24:MI:SS’),
l.id as l_id,
p.logical_query_id,
l.hash_id,
l.saw_src_path,
l.query_src_cd,
l.success_flg,
l.num_db_query,
l.query_text,
p.query_text,
p.physical_hash_id
from
usage_tracking.s_nq_acct l,
usage_tracking.s_nq_db_acct p
where
l.id = p.logical_query_id and l.start_dt > trunc(sysdate – 1) and l.end_dt < trunc(sysdate)
order by l.start_ts, l.id,l.hash_id, p.physical_hash_id;
Second, we write a query against V$SQL to get the SQL_ID, using the values of PHYSICAL_HASH_ID as a filter.
select
o.action,
o.sql_id,
o.sql_text
from
v$sql o
where
o.action = ‘<physical_hash_id>’
order by o.sql_id;
If you have a RAC database, instead of V$SQL, you use the GV$SQL table to get the SQL_ID.
select
o.action,
o.sql_id,
o.sql_text
from
gv$sql o
where
o.action = ‘<physical_hash_id>’
order by o.sql_id;
This method doesn’t work if you’re troubleshooting initialization blocks as the initialization block usage tracking table (S_NQ_INITBLOCK) doesn’t contain a physical hash ID.
In our next example, we use the ‘A – Sample Sales’ subject area and select only a few columns from the Usage Tracking tables.
From ‘A – Sample Sales’, we run the following query:
[2022-02-04T15:11:17.629+00:00] [OBIS] [TRACE:2] [USER-0] [] [ecid: e49b96a8-33c4-4ba7-a877-e564d207eca1-00242531,0:1:38:3] [sik: bootstrap] [tid: dd1bc700] [messageId: USER-0] [requestid: 33e30020] [sessionid: 33e30000] [username: oacadmin] ############################################## [[
——————– SQL Request, logical request hash:
cee7ec94
SET VARIABLE QUERY_SRC_CD=’Report’;SELECT
0 s_0,
“A – Sample Sales”.”Offices”.”D1 Office” s_1,
“A – Sample Sales”.”Base Facts”.”10- Variable Costs” s_2,
“A – Sample Sales”.”Base Facts”.”11- Fixed Costs” s_3
FROM “A – Sample Sales”
ORDER BY 2 ASC NULLS LAST
FETCH FIRST 125001 ROWS ONLY
]]
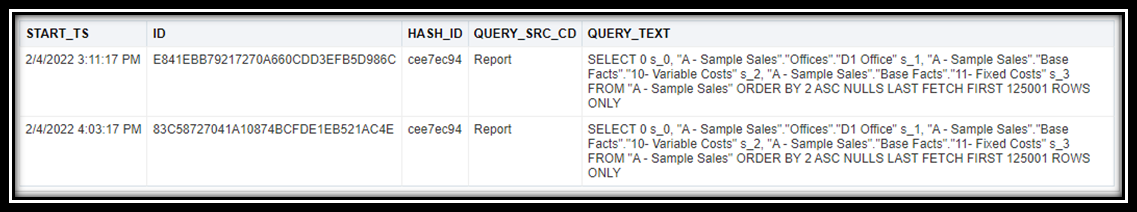
When we select start_ts, id, hash_id, query_src_cd and query_text from the usage tracking logical table we get the ID value E841EBB79217270A660CDD3EFB5D986C:


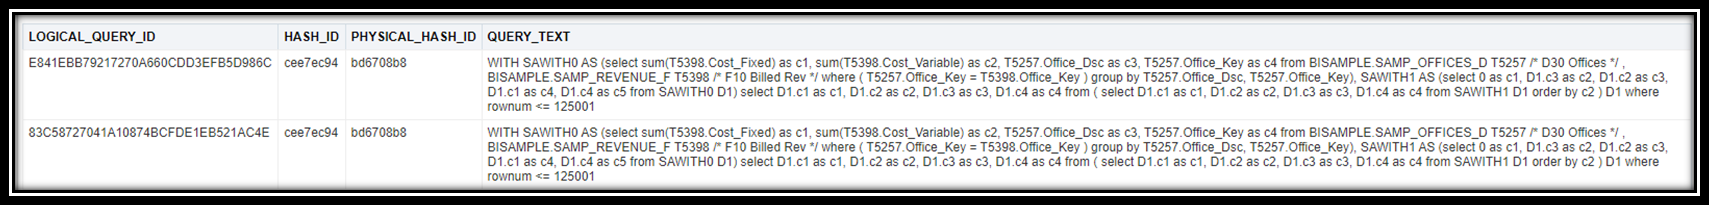
Next, we select logical_query_id, hash_id, physical_hash_id, and query_text from the usage tracking physical table where logical_query_id = ‘E841EBB79217270A660CDD3EFB5D986C’:

When we look at the manage sessions log, we see that the logical query spawns the SQL that’s in the QUERY_TEXT column:
[2022-02-04T15:11:17.637+00:00] [OBIS] [TRACE:2] [USER-18] [] [ecid: e49b96a8-33c4-4ba7-a877-e564d207eca1-00242531,0:1:38:5] [sik: bootstrap] [tid: dd1bc700] [messageId: USER-18] [requestid: 33e30020] [sessionid: 33e30000] [username: oacadmin] ——————– Sending query to database named 01 – Sample App Data (ORCL) (id: <<62275>>), client type Oracle Call Interface (OCI), connection pool named Sample Relational Connection, logical request hash cee7ec94, physical request hash bd6708b8: [[
WITH
SAWITH0 AS (select sum(T5398.Cost_Fixed) as c1,
sum(T5398.Cost_Variable) as c2,
T5257.Office_Dsc as c3,
T5257.Office_Key as c4
from
BISAMPLE.SAMP_OFFICES_D T5257 /* D30 Offices */ ,
BISAMPLE.SAMP_REVENUE_F T5398 /* F10 Billed Rev */
where ( T5257.Office_Key = T5398.Office_Key )
group by T5257.Office_Dsc, T5257.Office_Key),
SAWITH1 AS (select 0 as c1,
D1.c3 as c2,
D1.c2 as c3,
D1.c1 as c4,
D1.c4 as c5
from
SAWITH0 D1)
select D1.c1 as c1, D1.c2 as c2, D1.c3 as c3, D1.c4 as c4 from ( select D1.c1 as c1,
D1.c2 as c2,
D1.c3 as c3,
D1.c4 as c4
from
SAWITH1 D1
order by c2 ) D1 where rownum <= 125001
]]
Finally, we select action, sql_id, and sql_text from V$SQL where action = ‘bd6708b8’:

The query in the sql_text column is the same SQL seen in the usage tracking physical table. From this, we see that the sql_id for the query in question is ‘1gxhc0acmztwk’.
If we run the same query again, another row is added to the usage tracking logical table with a new ID but the hash_id is the same:
Similarly, another row is added to the usage tracking physical table with a new logical_query_id, but both the hash_id and physical_hash_id remain the same:
The physical_hash_id is also reused if you run a similar logical query against a subject area that’s based on the same logical and physical models. For example, here we run a similar query against ‘C – Sample Costs’:
[2022-02-04T16:10:17.862+00:00] [OBIS] [TRACE:2] [USER-0] [] [ecid: e49b96a8-33c4-4ba7-a877-e564d207eca1-00242ce7,0:1:15:3] [sik: bootstrap] [tid: 58504700] [messageId: USER-0] [requestid: 13c9003c] [sessionid: 13c90000] [username: oacadmin] ############################################## [[
——————– SQL Request, logical request hash:
7b5ea9b1
SET VARIABLE QUERY_SRC_CD=’Report’;SELECT
0 s_0,
“C – Sample Costs”.”Offices”.”D1 Office” s_1,
“C – Sample Costs”.”Base Facts”.”10- Variable Costs” s_2,
“C – Sample Costs”.”Base Facts”.”11- Fixed Costs” s_3
FROM “C – Sample Costs”
ORDER BY 2 ASC NULLS LAST
FETCH FIRST 125001 ROWS ONLY
]]
This logical query spawns the same SQL seen in the query we ran run against ‘A – Sample Sales’:
[2022-02-04T16:10:17.866+00:00] [OBIS] [TRACE:2] [USER-18] [] [ecid: e49b96a8-33c4-4ba7-a877-e564d207eca1-00242ce7,0:1:15:5] [sik: bootstrap] [tid: 58504700] [messageId: USER-18] [requestid: 13c9003c] [sessionid: 13c90000] [username: oacadmin] ——————– Sending query to database named 01 – Sample App Data (ORCL) (id: <<52912>>), client type Oracle Call Interface (OCI), connection pool named Sample Relational Connection, logical request hash 7b5ea9b1, physical request hash bd6708b8: [[
WITH
SAWITH0 AS (select sum(T5398.Cost_Fixed) as c1,
sum(T5398.Cost_Variable) as c2,
T5257.Office_Dsc as c3,
T5257.Office_Key as c4
from
BISAMPLE.SAMP_OFFICES_D T5257 /* D30 Offices */ ,
BISAMPLE.SAMP_REVENUE_F T5398 /* F10 Billed Rev */
where ( T5257.Office_Key = T5398.Office_Key )
group by T5257.Office_Dsc, T5257.Office_Key),
SAWITH1 AS (select 0 as c1,
D1.c3 as c2,
D1.c2 as c3,
D1.c1 as c4,
D1.c4 as c5
from
SAWITH0 D1)
select D1.c1 as c1, D1.c2 as c2, D1.c3 as c3, D1.c4 as c4 from ( select D1.c1 as c1,
D1.c2 as c2,
D1.c3 as c3,
D1.c4 as c4
from
SAWITH1 D1
order by c2 ) D1 where rownum <= 125001
]]
First, we use the usage tracking logical table we find the id. Notice that the logical hash_id is different than the query run against ‘A – Sample Sales’: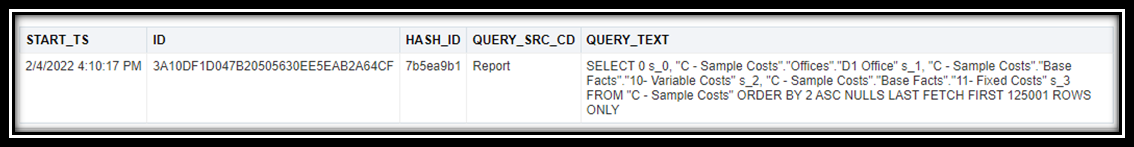
In the usage tracking physical table, we see that even though the logical hash_id is different, the physical_hash_id is the same: 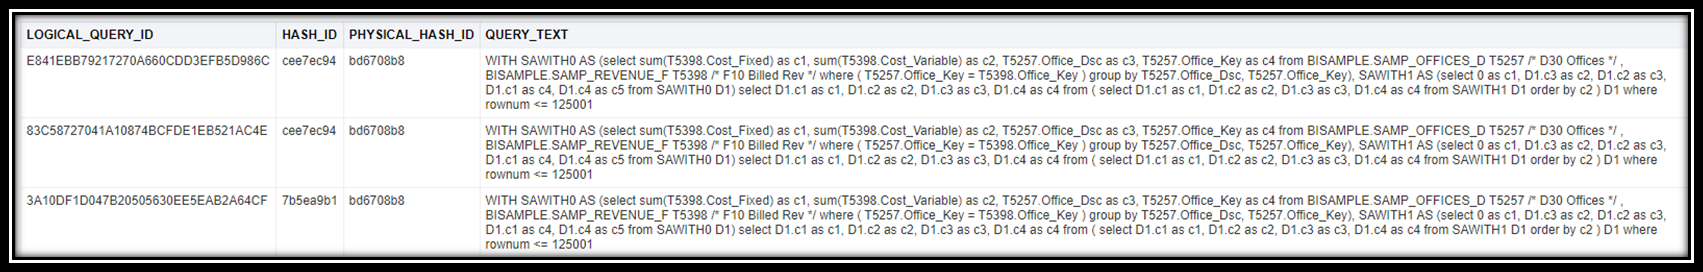
In another example, we run the same queries (as above) but this time we select the Refresh button. Notice the variable OBIS_REFRESH_CACHE=1 to denote the refresh. As expected, another row is inserted into the usage tracking logical table but it has a different logical hash_id.
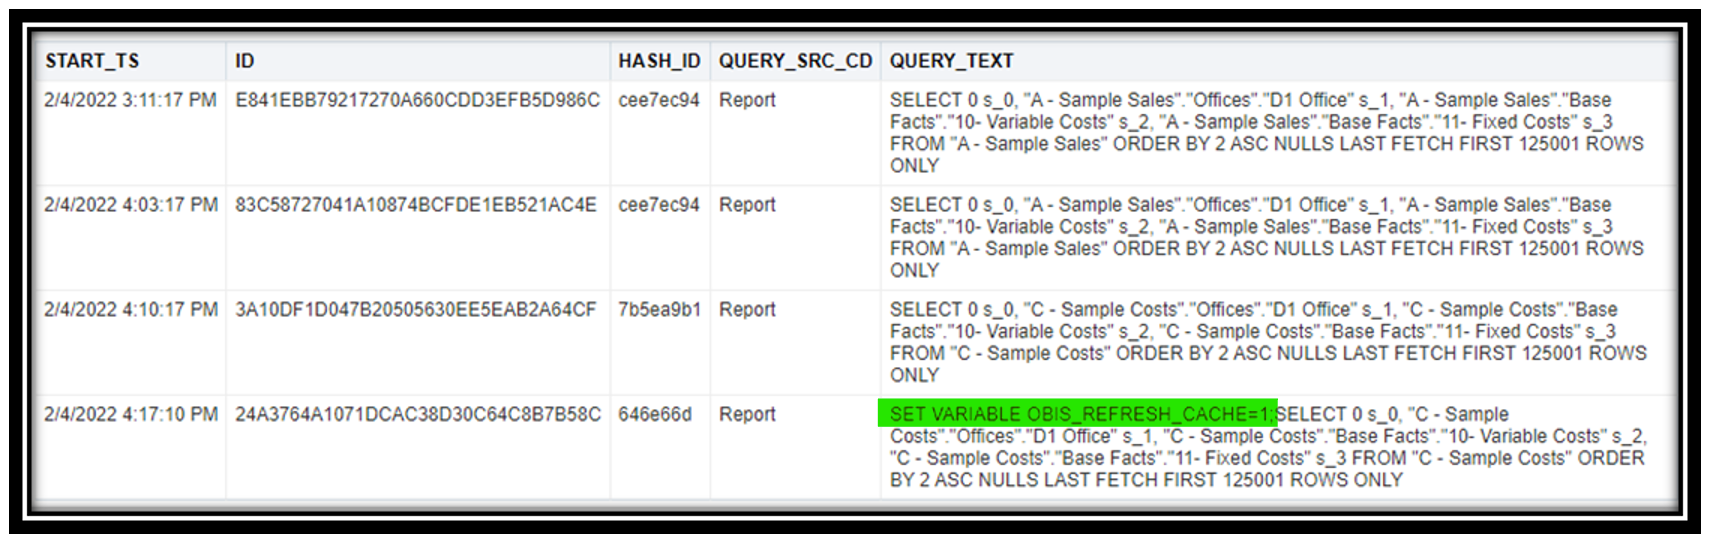
However, when we query the usage tracking physical table, you can see that all the queries have the same physical_hash_id.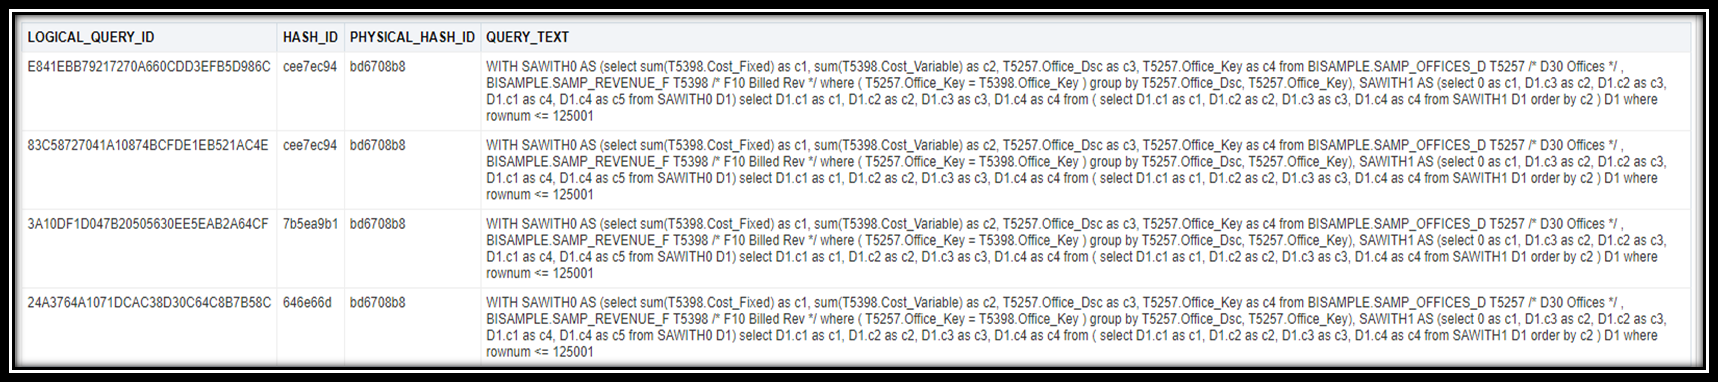
Since these four logical queries all have the same physical_hash_id, you only see a single record in V$SQL for this query:
You can the same method to troubleshoot data visualization queries based on a subject area (RPD) or a database connection. For database connections, this includes both data visualizations and queries used to populate datasets.
You can determine the query type, that is, data visualization, dataset, analysis, ODBC, and so on, from the value of the QUERY_SRC_CD column. For example, data visualization queries have a value ‘Visual Analyzer’, a query used to populate a dataset has the value of ‘data-prep, analyses have the value ‘Report’, and queries for some internal ODBC procedure calls have the value ‘Soap’.
To generate a SQL statement for a data visualization, you must change Data Access to ‘Live’ for the underlying dataset.
In this example, we create a data visualization query (similar to the above queries) against a dataset based on a connection to an Oracle database.
[2022-02-03T19:42:06.564+00:00] [OBIS] [TRACE:2] [USER-0] [] [ecid: f95b5f1b-1e5c-4604-b82a-3eb3717f3aa6-002aa26e,0:1:1:3] [sik: bootstrap] [tid: 58b0a700] [messageId: USER-0] [requestid: ed830023] [sessionid: ed830000] [username: oacadmin] ############################################## [[
——————– SQL Request, logical request hash:
3158b05
SET VARIABLE QUERY_SRC_CD=’Visual Analyzer’,SAW_SRC_PATH='{“viewID”:”view!1″,”currentCanvas”:”canvas!1″}’,ENABLE_DIMENSIONALITY = 1; SELECT
0 s_0,
XSA(‘oacadmin’.’BISAMPLE_OfficeRevenue’).”SAMP_OFFICES_D”.”OFFICE_DSC” s_1,
XSA(‘oacadmin’.’BISAMPLE_OfficeRevenue’).”SAMP_REVENUE_F”.”COST_FIXED” s_2,
XSA(‘oacadmin’.’BISAMPLE_OfficeRevenue’).”SAMP_REVENUE_F”.”COST_VARIABLE” s_3
FROM XSA(‘oacadmin’.’BISAMPLE_OfficeRevenue’)
ORDER BY 2 ASC NULLS LAST
FETCH FIRST 125001 ROWS ONLY
/* AdditionalDetail=’VisualAnalyzer’ */
Which spawns the following SQL:
[2022-02-03T19:42:06.960+00:00] [OBIS] [TRACE:2] [USER-18] [] [ecid: f95b5f1b-1e5c-4604-b82a-3eb3717f3aa6-002aa26e,0:1:1:5] [sik: bootstrap] [tid: 58b0a700] [messageId: USER-18] [requestid: ed830023] [sessionid: ed830000] [username: oacadmin] ——————– Sending query to database named ‘oacadmin’.’BISAMPLE’ (id: <<147945>>), client type OCI 10g/11g, connection pool named ‘oacadmin’.’BISAMPLE’, logical request hash 3158b05, physical request hash c48e8741: [[
WITH
SAWITH0 AS (select T1000005.OFFICE_KEY as c1,
T1000005.OFFICE_DSC as c2
from
BISAMPLE.SAMP_OFFICES_D T1000005),
SAWITH1 AS (select T1000008.OFFICE_KEY as c1,
T1000008.COST_FIXED as c2,
T1000008.COST_VARIABLE as c3
from
BISAMPLE.SAMP_REVENUE_F T1000008),
SAWITH2 AS (select D1.c2 as c1,
D2.c2 as c2,
D2.c3 as c3
from
SAWITH0 D1 inner join SAWITH1 D2 On D1.c1 = D2.c1),
SAWITH3 AS (select D102.c1 as c1,
sum(D102.c2) as c2,
sum(D102.c3) as c3
from
SAWITH2 D102
group by D102.c1)
select D1.c1 as c1, D1.c2 as c2, D1.c3 as c3, D1.c4 as c4 from ( select 0 as c1,
D110.c1 as c2,
D110.c2 as c3,
D110.c3 as c4
from
SAWITH3 D110
order by c2 ) D1 where rownum <= 125001
From the usage tracking logical table, we can find the hash_id that’s used as a filter against the usage tracking physical table: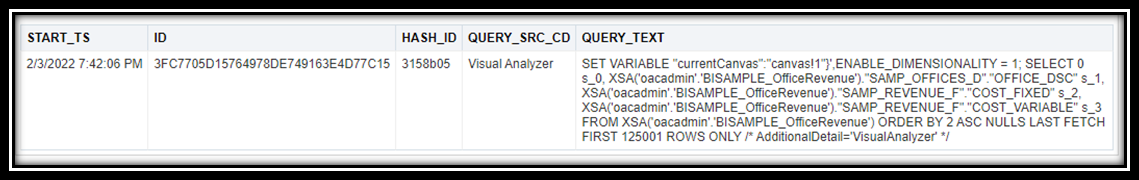
From the usage tracking physical table, we can find the physical_hash_id:
When we query V$SQL, we again find the SQL_ID:
You can also find the logical hash_id and physical_hash_id in the Manage Sessions log (see the highlighted sections in the log snippets above). This means you can find the SQL_ID from the log itself. The benefit of using the usage tracking tables is that log entries in Manage Sessions are ephemeral so unless you’re collecting hash ids at the same time as running the query, they’re lost.
However, data is only written to the usage tracking tables when a query completes. So, if you’re troubleshooting a long-running query that hasn’t completed yet and you want to determine the sql_id, you can get the logical hash_id and physical_hash_id from the Manage Sessions log.
Conclusion
If you’re troubleshooting a SQL statement and you need to investigate the database, you can join information in the usage tracking tables and the V$SQL system table (or GV$SQL) to quickly find the SQL_ID for the SQL statement you’re investigating.
We hope this information helps you troubleshoot and improve queries in Oracle Analytics. For more tips, see Oracle Analytics Best Practices Series: Optimal Performance and Usage.