Oracle Analytics Cloud (OAC) has taken a major step forward by integrating with Oracle Cloud Infrastructure (OCI) Vision Video Analysis. This powerful new capability allows businesses to extract meaningful insights from video content frame by frame, by detecting faces, reading text, identifying labels, and recognizing objects with precision.
In this article, you’ll explore how to transform raw output from OCI Vision Video Analysis into a powerful, insight-driven dashboard—making it easier to visualize and understand key patterns and trends captured from video data.
The goal is to identify trends and extract insights from OCI Vision Video Analysis output and visualize them effectively in OAC.
Understand the Input Dataset
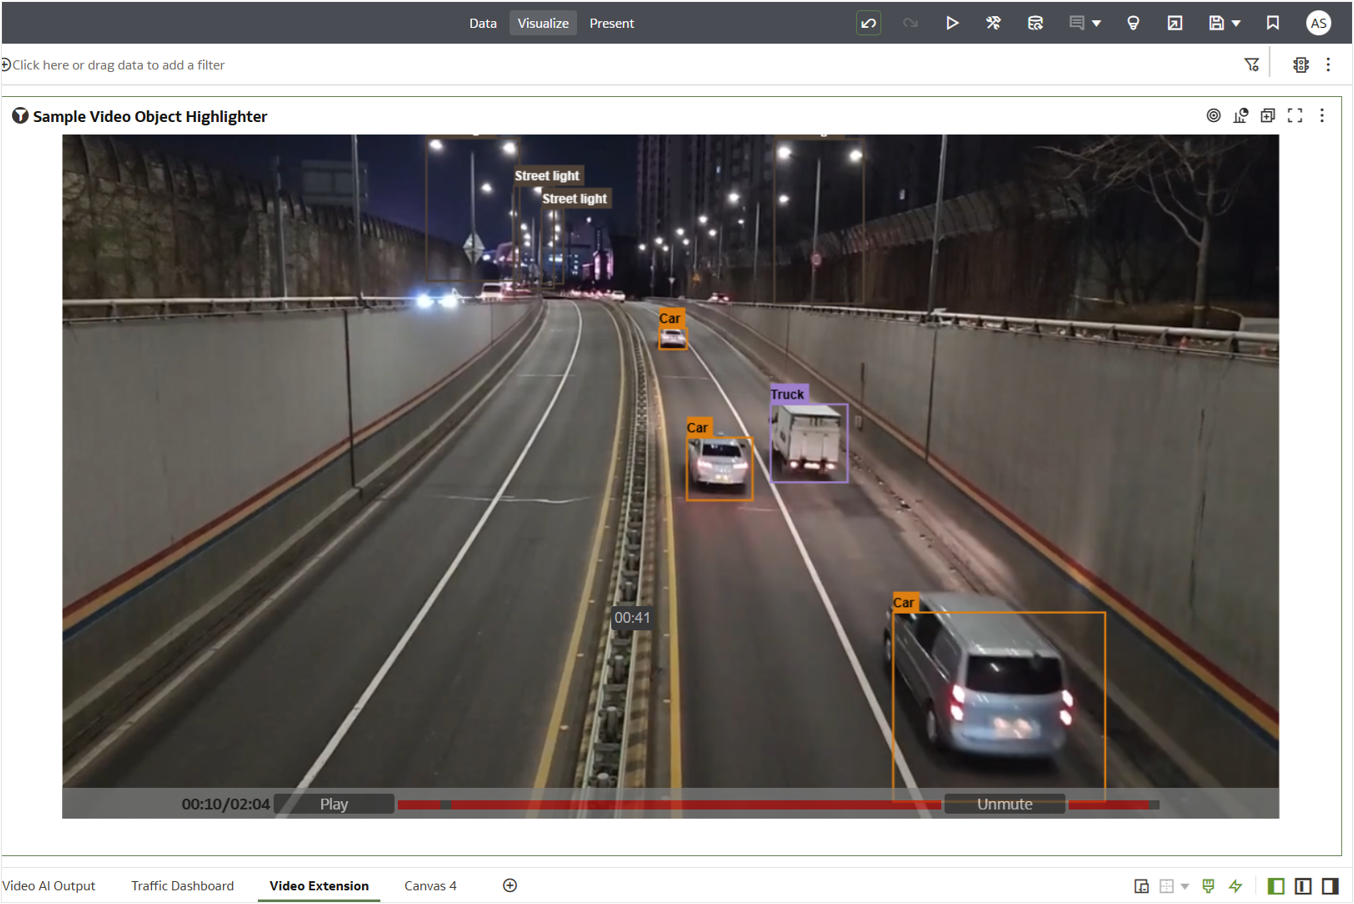
The input video captures the vehicle movement on a highway.
As a prerequisite, invoke the OCI Pretrained Video Object Detection model on the input video in OAC to generate the output dataset Video-Output. The dataset has the following columns as shown: Video Objects, Segment Start Time Offset ms, Segment End Time Offset ms, Segment Confidence, Frame Time Offset ms, Frame Confidence, Frame Vertex 1, Frame Vertex 2, Frame Vertex 3, Frame Vertex 4, Status Summary, and the video file’s URL. For more details, see the Register and Invoke Pretrained Video Models in OAC blog article.
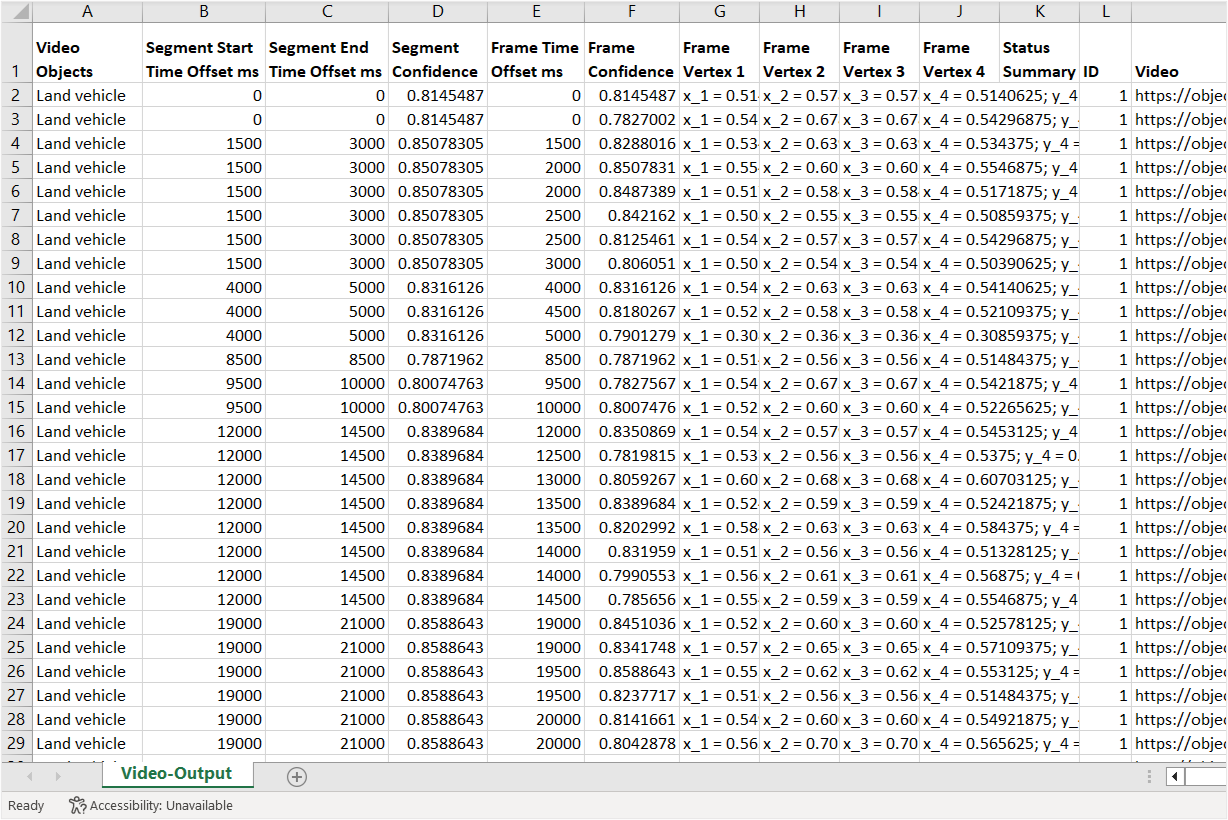
The Video-Output dataset will be used as the input dataset for further analysis. It includes detected video objects for each frame, sampled at 500-millisecond intervals. To make the Frame Time Offset ms more human-readable, convert these values into a standard mm:ss format. With a few simple calculations in your OAC workbook, you can unlock valuable insights from the dataset.
Create the Required Calculations
To get started, create a new workbook by clicking Create on the Oracle Analytics Home page, add the dataset Video-Output as the input source. and then define the following calculations:
- # of Objects: Use the COUNT function to determine the total number of detected objects.
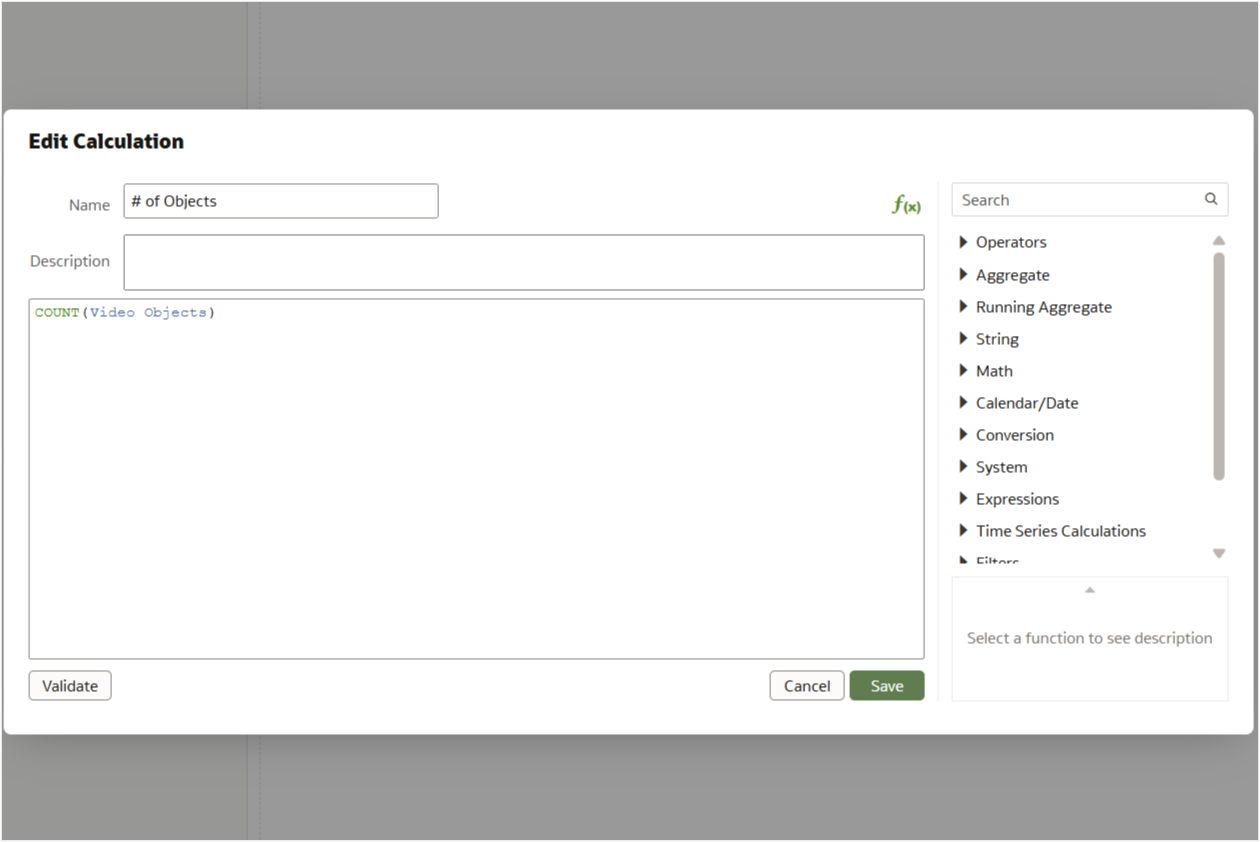
Image 3: Calculation to find the number of objects - Category: Create a simple CASE expression to group Video Objects such as Car, Truck, Land Vehicle, and Bus under a common label such as “Vehicle”.
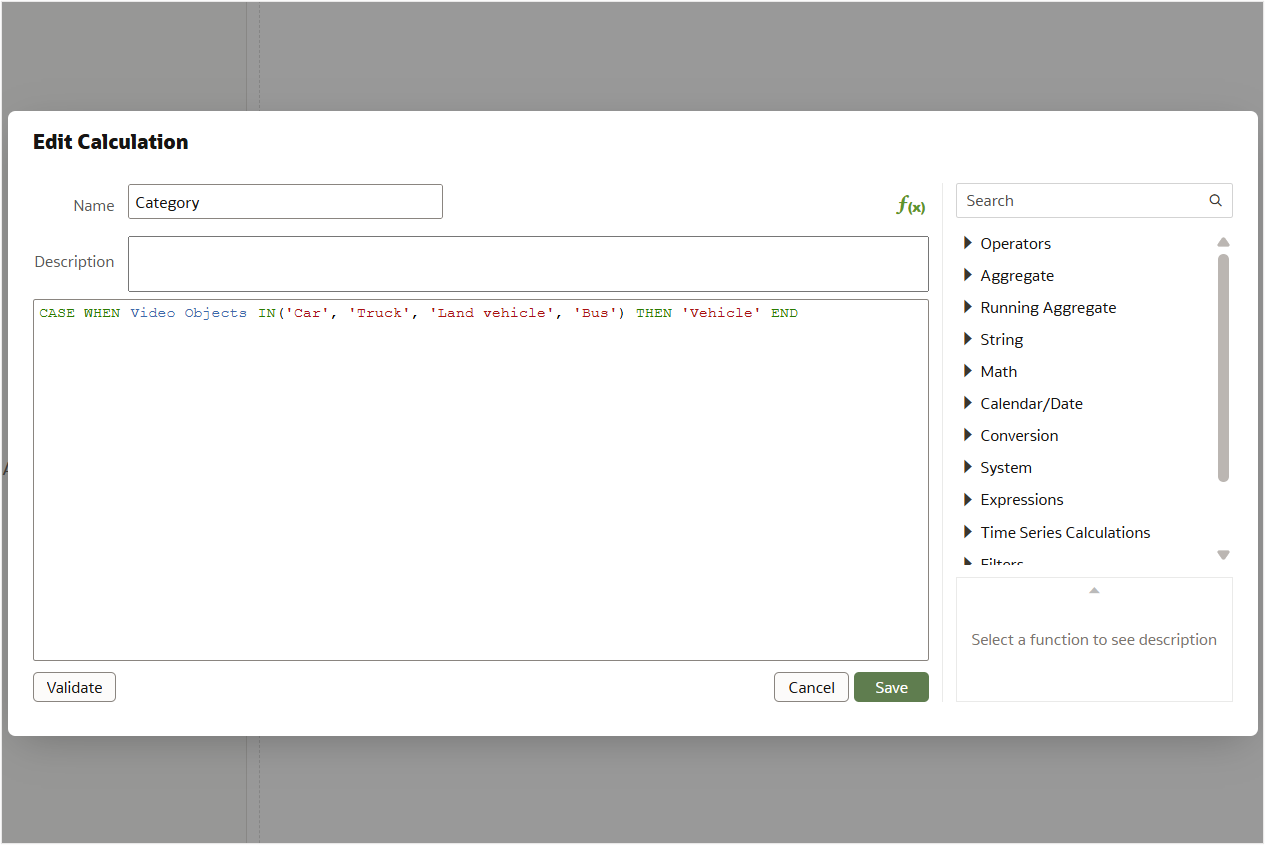
Image 4: Calculation to find Category - # of Vehicles: Apply the COUNT function to the previously created category calculation to count the number of vehicles.
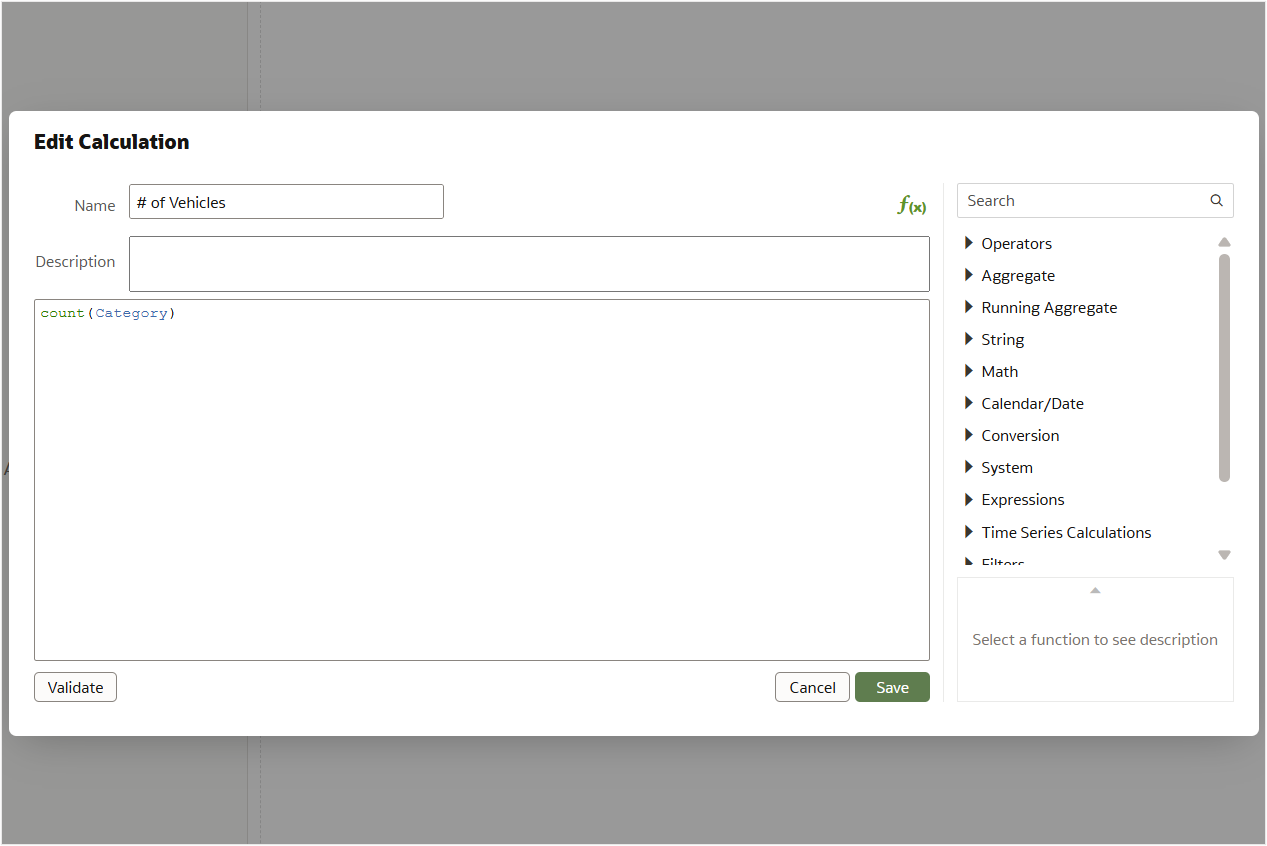
Image 5: Calculation to find the number of vehicles - minutes: Convert milliseconds into minutes. Since 1 minute equals 60,000 milliseconds (60 seconds × 1,000 milliseconds), divide the frame time offset by 60,000.
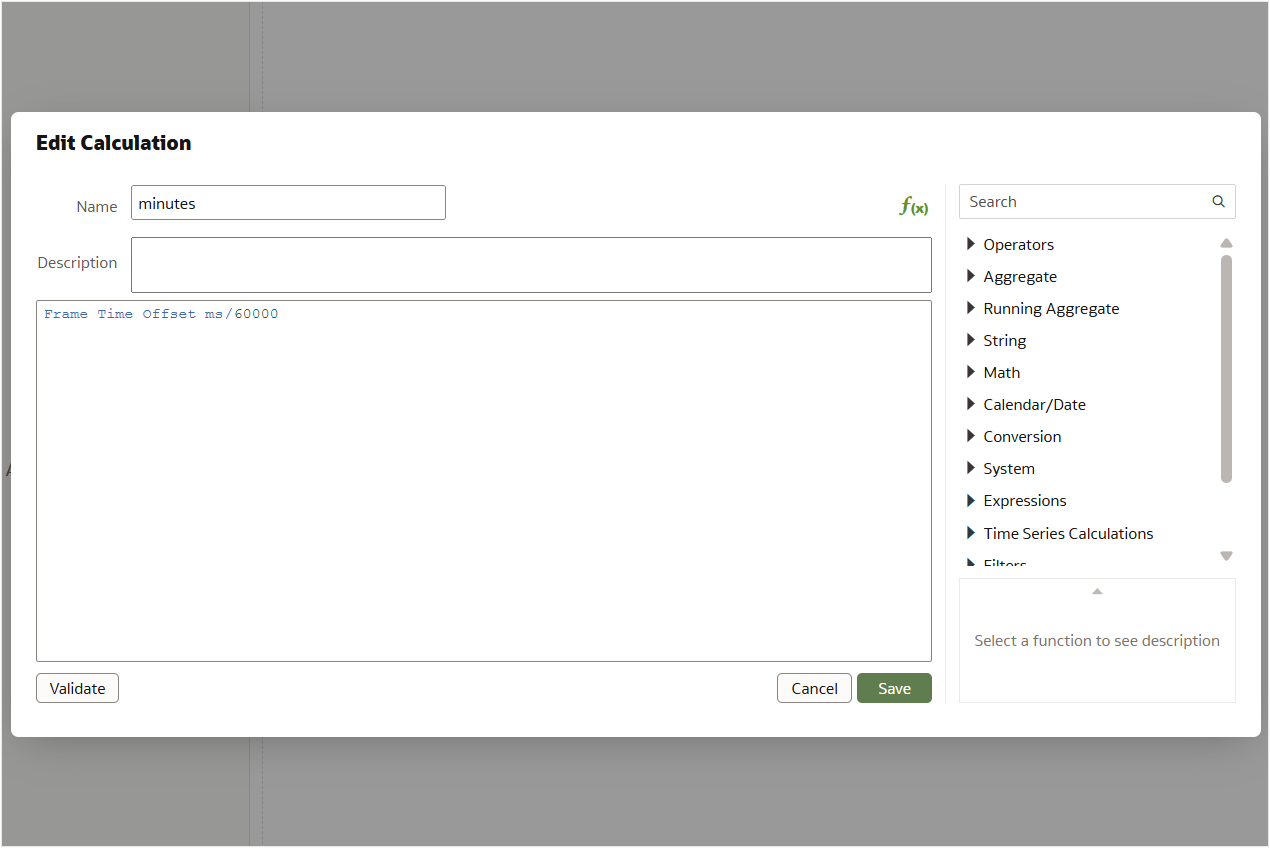
Image 6: Calculation to find minutes - minutes mm: Format the minutes value to always display two digits by adding a leading zero when necessary. This ensures consistency in the mm:ss format.
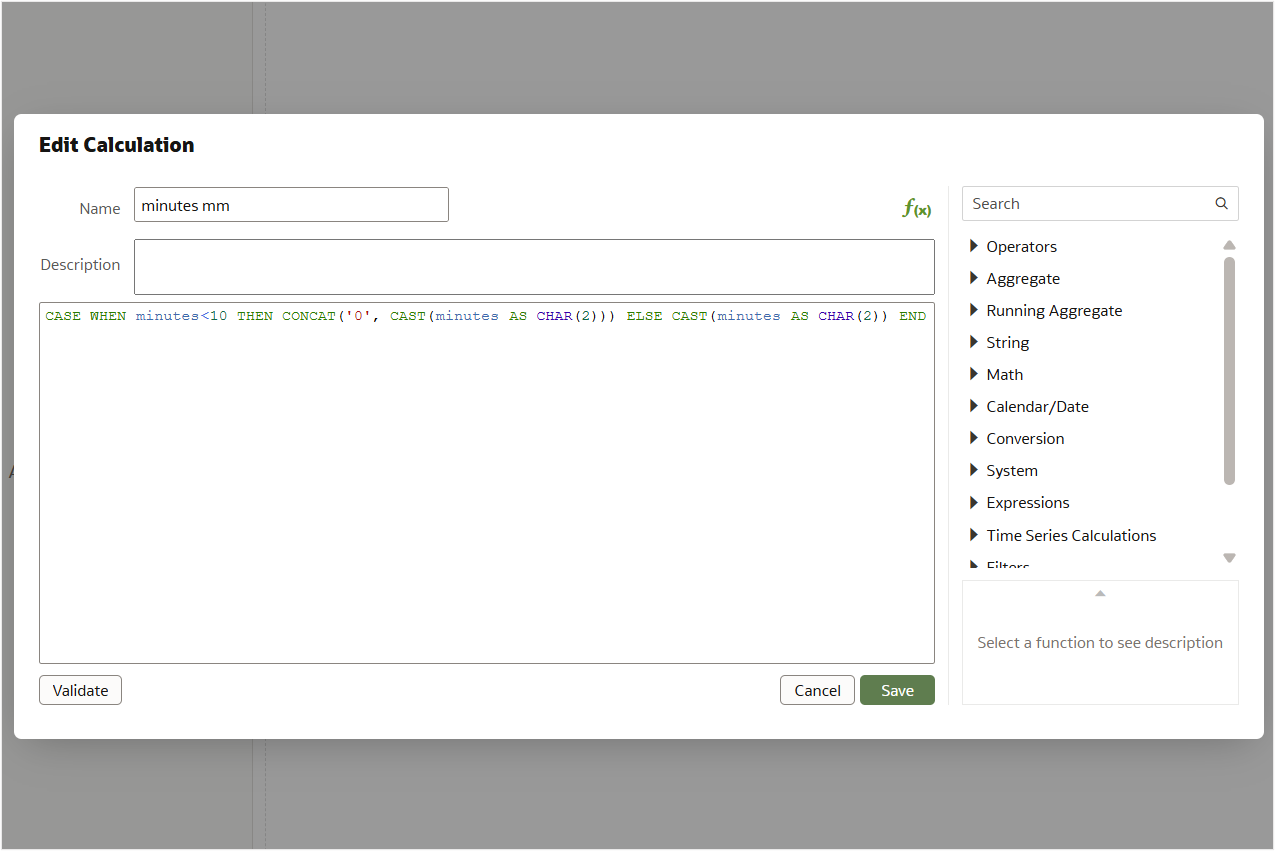
Image 7: Calculation to find minutes in mm format - seconds: Subtract the full-minute portion from the total milliseconds to get the leftover milliseconds, then divide by 1,000 to convert them into seconds.
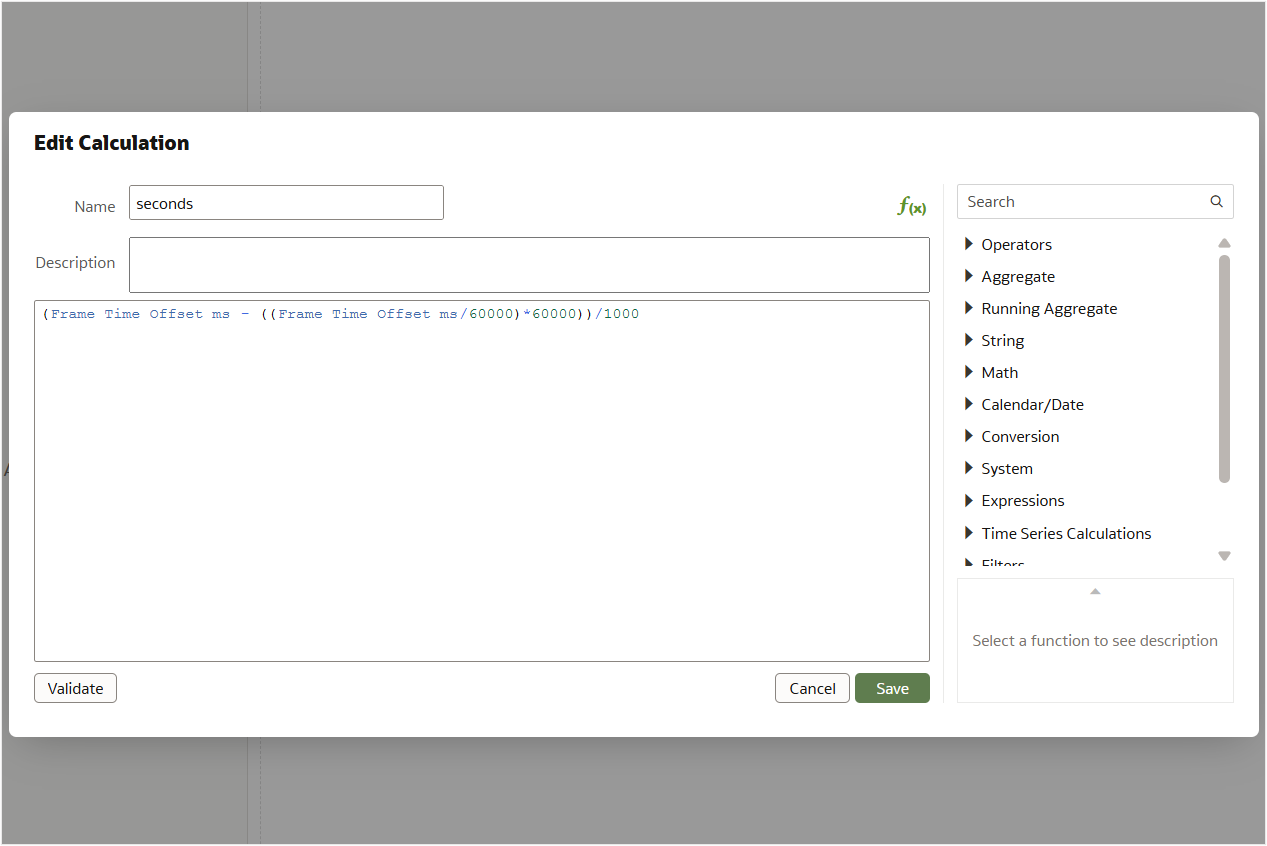
Image 8: Calculation to find seconds - seconds ss: Format the seconds value in two-digit format by adding a leading zero if it’s less than 10.

Image 9: Calculation to find seconds in ss format - Time Offset: Concatenate minutes mm and seconds ss with a colon (:) separator to create a readable time format (mm:ss).
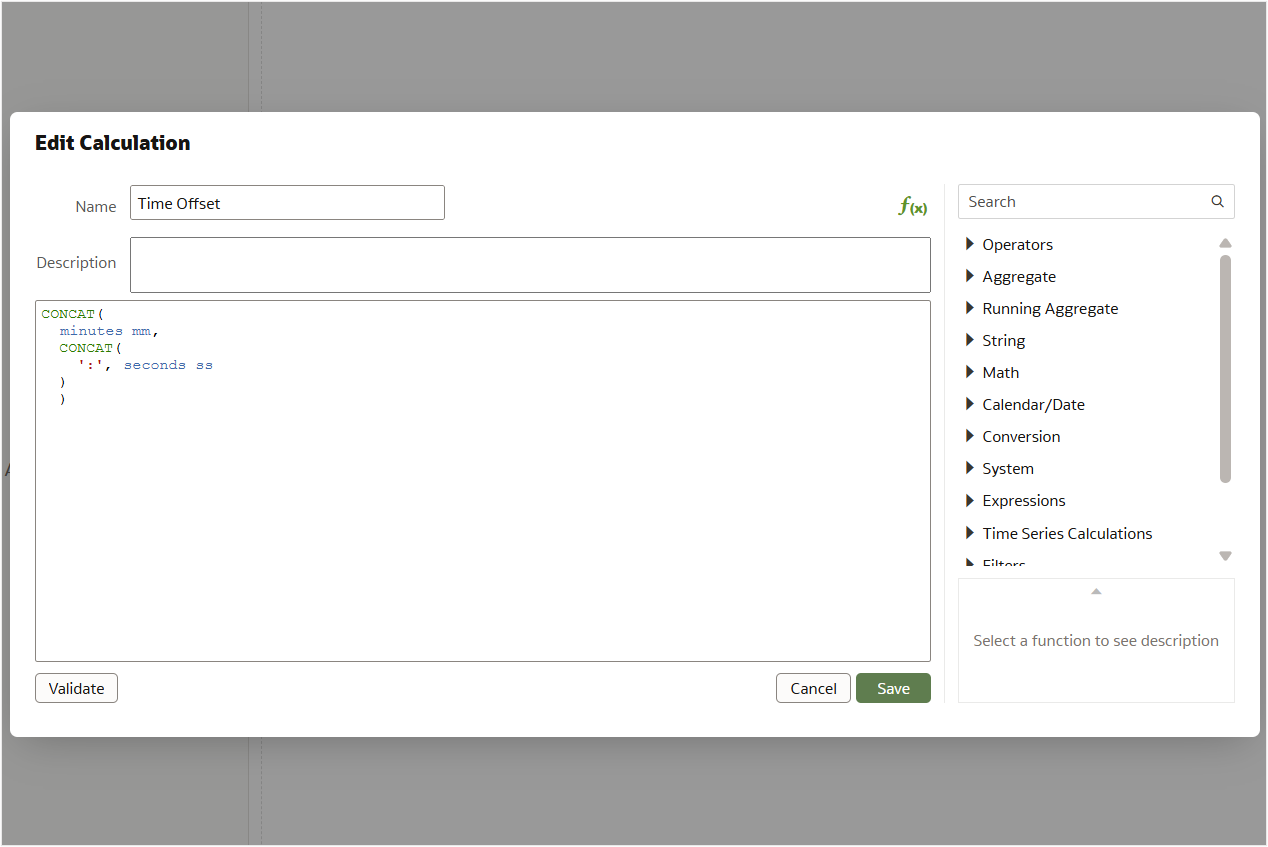
Image 10: Calculation to concatenate minutes and seconds in mm:ss format.
Visualize Traffic Insights
Once the calculated fields are set up, you can build a dashboard that uses the calculations and other columns from the Video-Output dataset. This dashboard provides a comprehensive view of the detected objects and their behavior over time.
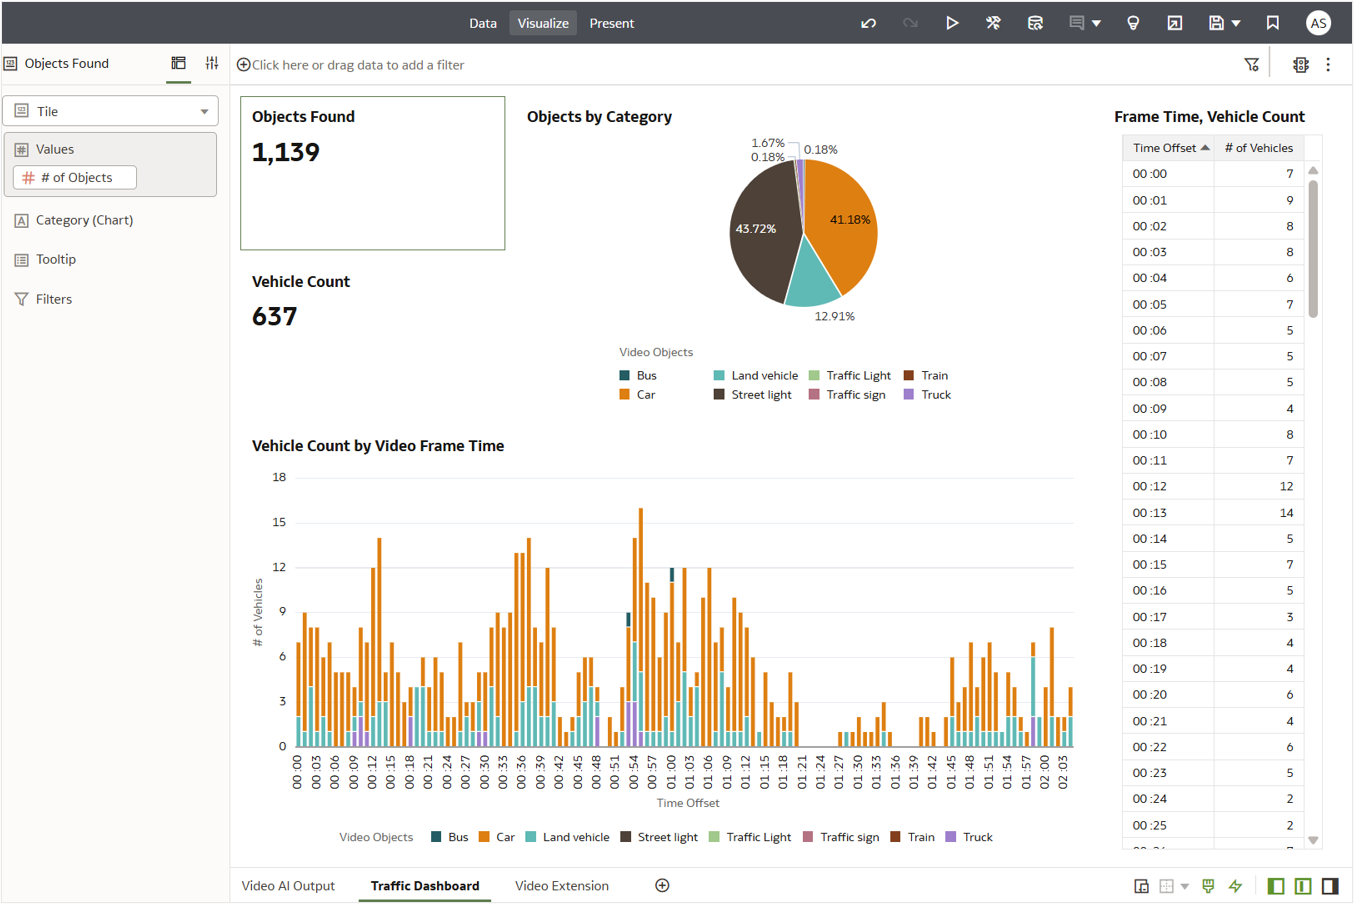
On the left, Tile visualizations display the total # of Objects and # of Vehicles detected in the video. On the right, a Table presents a time-based breakdown, showing the # of Vehicles detected at each Time Offset in the video. To enhance readability, a Stacked Bar Chart in the bottom visualizes this same data, making it easier to identify patterns and anomalies.
Key Insights
Traffic Violations: The video was recorded on a highway where buses aren’t permitted. The Stacked Bar chart makes it easy to identify violations—such as the presence of buses—at specific time points. For example, buses are detected around 00:53 and 01:00, which could indicate non-compliance.
Idle Time Detection: The absence of bars between 01:21 to 01:27 and 01:36 to 01:40 indicates no vehicular movement during those time intervals. This could suggest a temporary halt in traffic or a lull in vehicle flow.
Summary
By combining OCI Vision Video Analysis output with Oracle Analytics dashboards, it’s possible to extract meaningful traffic insights—ranging from identifying unauthorized vehicle types to analyzing movement patterns and idle times. With just a few calculated fields and visualizations, complex video data is transformed into actionable intelligence. This approach is a powerful example of how AI-driven video analytics can support smarter, data-informed decisions in real-world scenarios.
Call to Action
Now that you’ve read this post, try it yourself and let us know your results in the Oracle Analytics Community, where you can also ask questions and post ideas.