Introduction
The Oracle Analytics Platform empowers users to develop custom extensions categorized broadly into three types:
- basic: Enables the creation of visualizations that do not rely on data from Oracle Analytics or any data model mapping. This is similar to the Image and Text visualization types provided within Oracle Analytics.
- dataviz: Allows the rendering of data from registered Oracle Analytics data sources into charts, tables, or other visual representations.
- workbook: Establishes the foundational structure for developing a workbook-scoped extension. These plugins operate independently of the input data source.
In this article, you will explore the Governance plugin, a custom workbook extension available for download from the Oracle Analytics Library. After downloading the Governance plugin, upload it to the Extensions page in Oracle Analytics to begin using it. The Governance plugin retrieves artifacts and objects that you have access to—such as workbooks, data flows, datasets, and their relationships—within the Oracle Analytics Platform, based on selected criteria and user permissions. For more information, see the Using the Governance Custom Extension in Oracle Analytics video.
How to invoke the Governance plugin
You can access a workbook plugin from a new or existing workbook. This article uses an example of a new workbook without a selected input data source.
- Click the Custom Workbook Extension icon located in the top-right panel and select Governance Plugin to open the dialog.
Key features of the Governance plugin
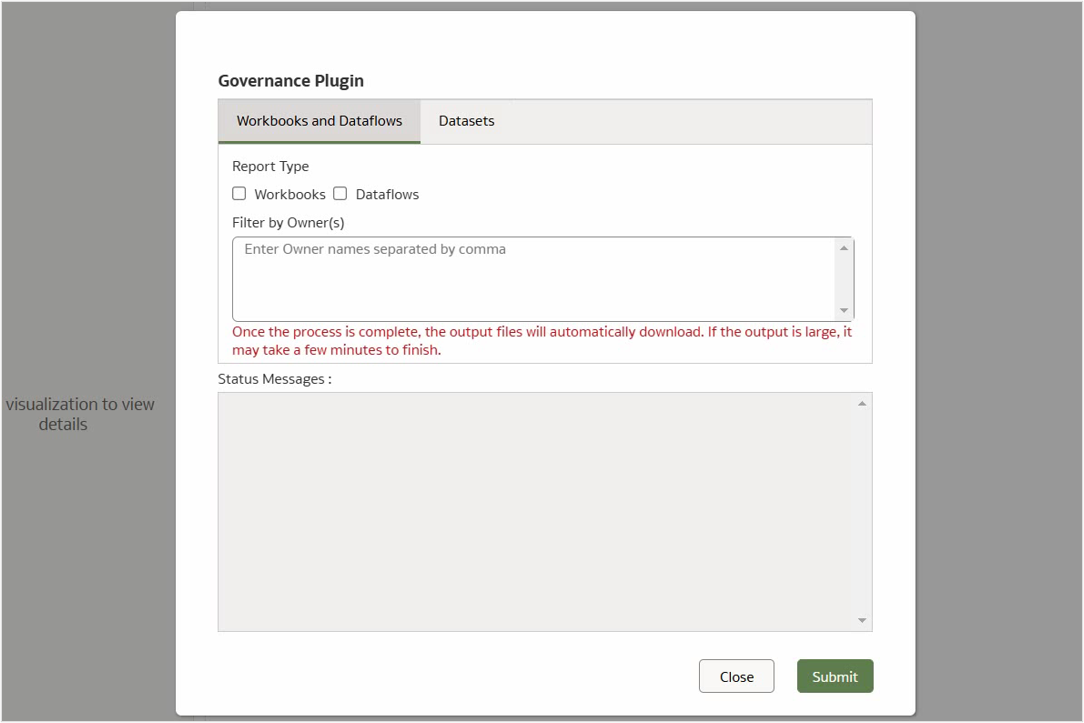
The Governance Plugin dialog consists of two tabs: Workbooks and Dataflows and Datasets.
- On the Workbooks and Dataflows tab, users can select the report type and apply filters based on the owner.
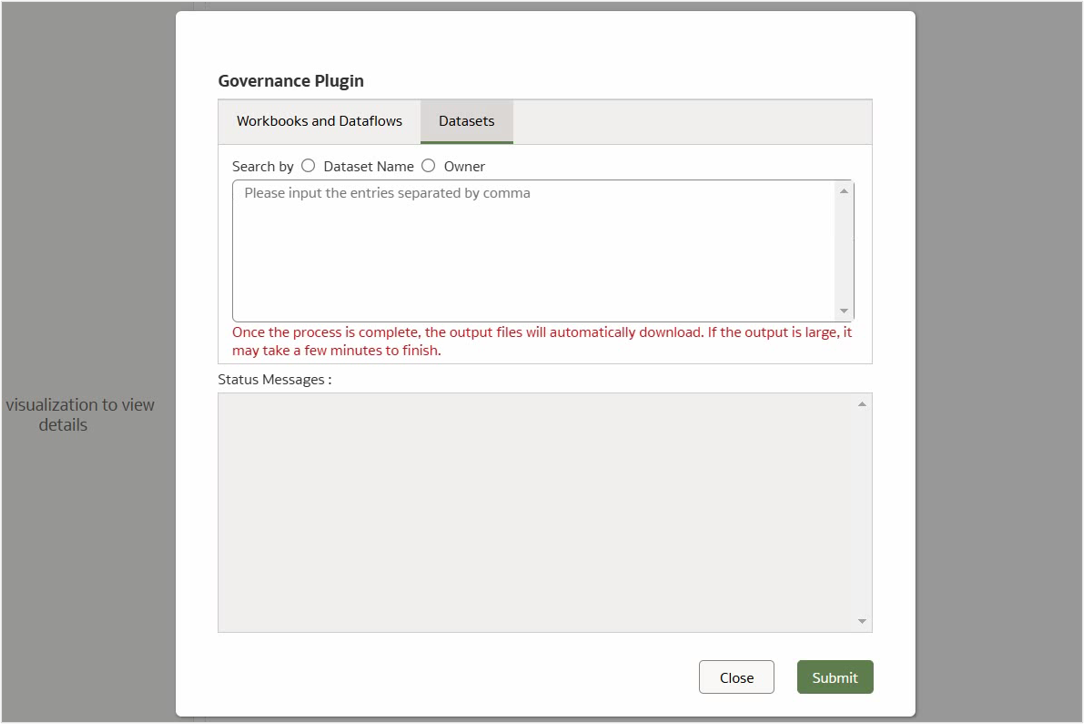
- On the Datasets tab, users can search for datasets by name or filter them by owner.
How to generate reports
Workbooks and data flows
- On the Workbooks and Dataflows tab, select both report types, Workbooks and Dataflows.
- Specify the owner names in Filter by Owner(s). These names are typically email IDs but can also be non-email identifiers. Separate multiple owner names by commas. You can leave this field blank to retrieve a report on all artifacts within the Oracle Analytics instance.
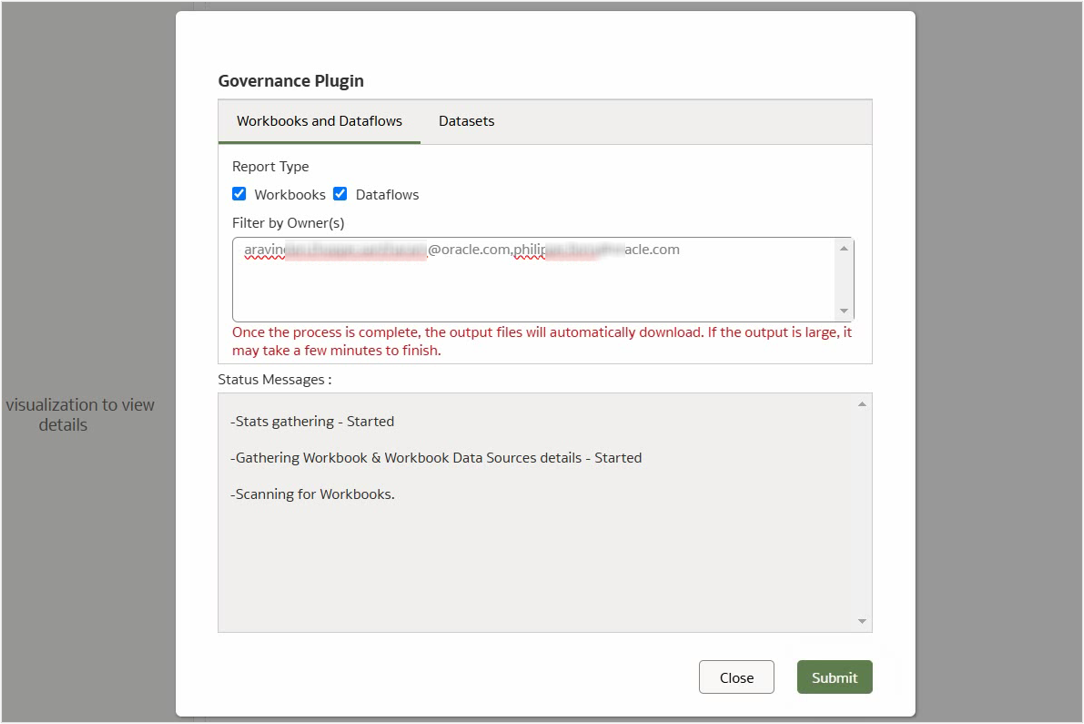
- Click Submit to initiate the process.
The status updates are displayed at the bottom of the dialog while the reports are being retrieved in the background. Depending on the data volume, this process may take a few minutes.
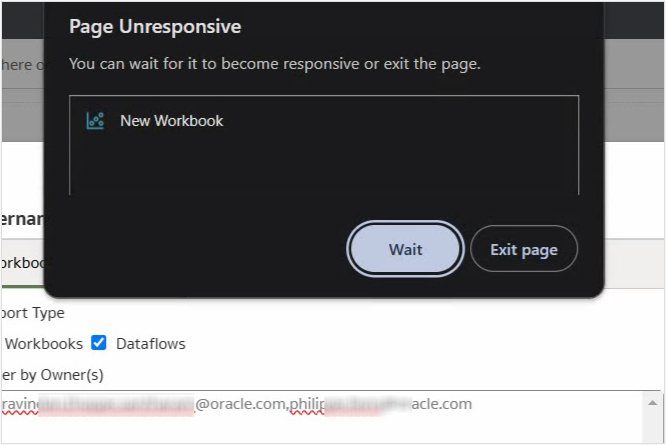
Note: If the browser displays a “Page Unresponsive” message, click Wait to allow the process to complete.
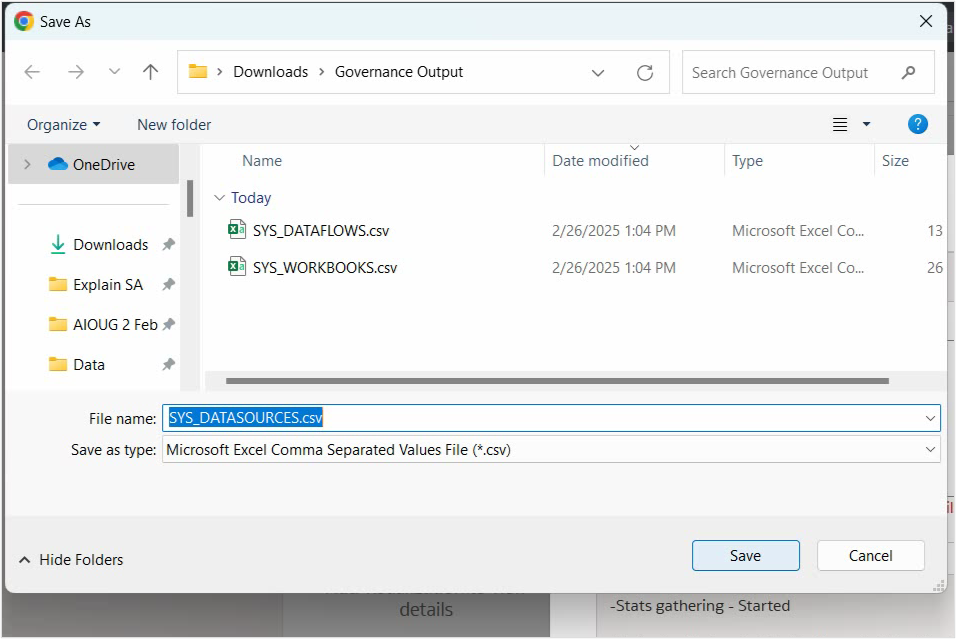
Once the process is finished, the output reports are downloaded to your local file system.
Datasets
- On the Datasets tab, you have the option to search for datasets by name or owner. You can search using the full dataset name or a partial match. For example, searching for “Sample” retrieves all datasets that include Sample as part of their name.
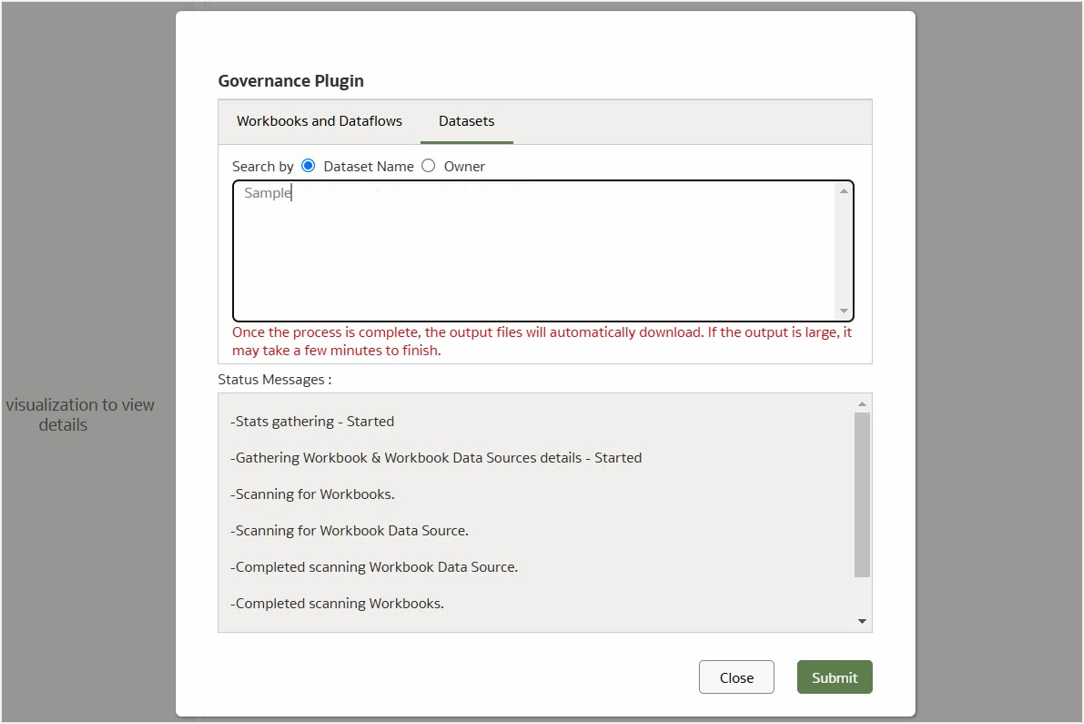
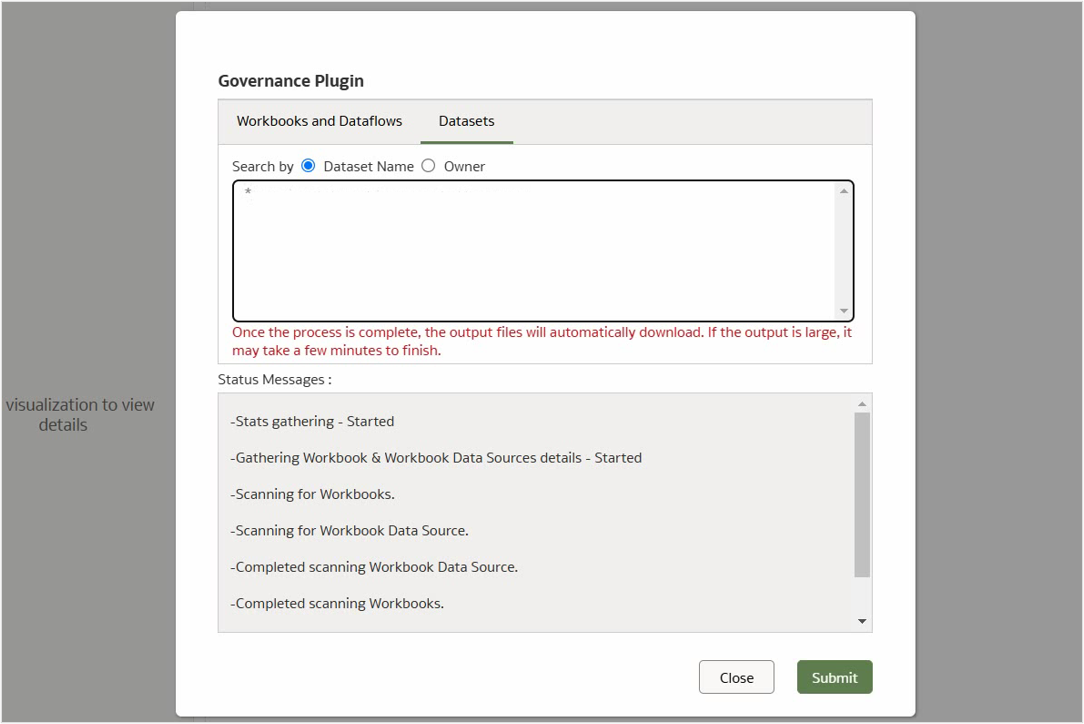
- You can use * to retrieve the report for all datasets.
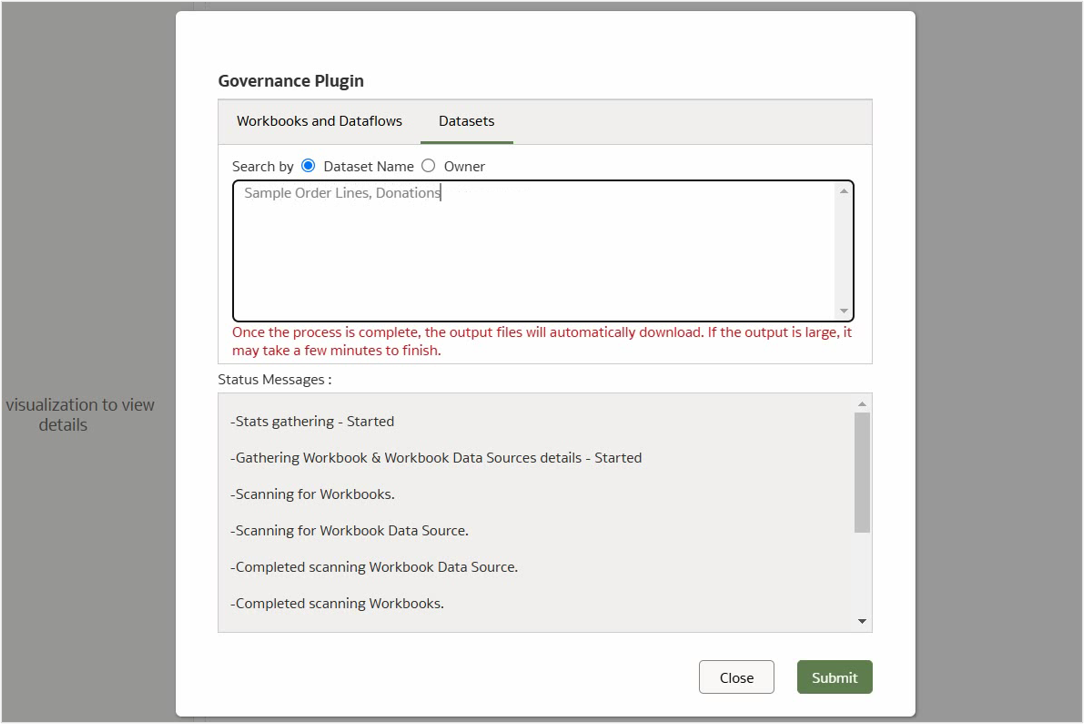
- Continue by selecting Dataset Name, and enter a few names, such as Sample Order Lines and Donations, separating them with commas.
- Click Submit to initiate the search.
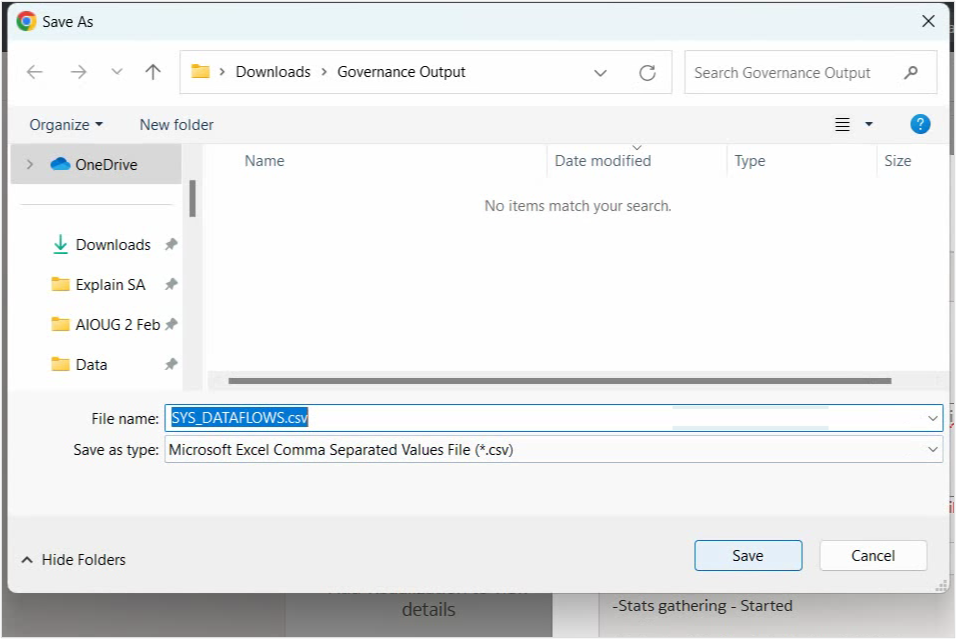
- Once the scanning process is complete, save the output file.
Understanding the output files
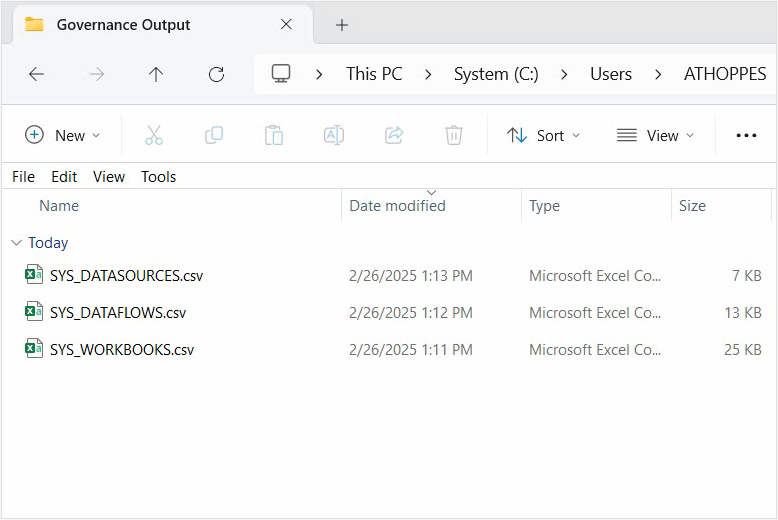
The Governance plugin generates three CSV output files: SYS_WORKBOOKS, SYS_DATAFLOWS, and SYS_DATASOURCES.
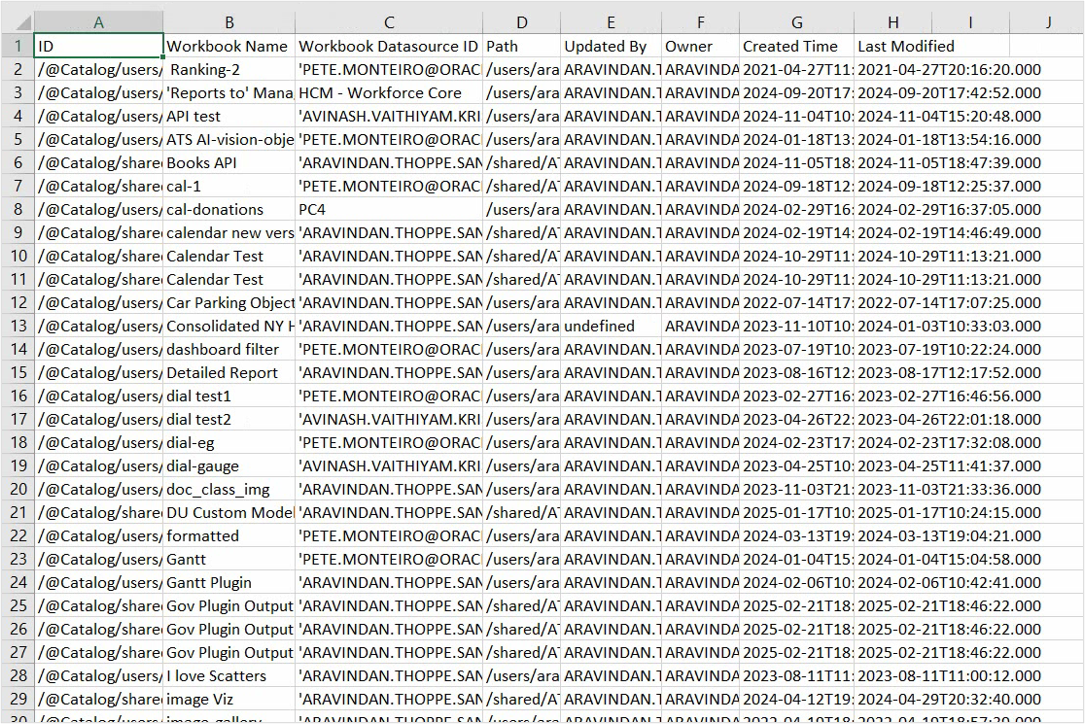
SYS_WORKBOOKS
This file contains details about workbooks, including:
- ID – The unique Object ID of the workbook
- Workbook Name – The name of the workbook
- Workbook Datasource ID – The data source associated with the workbook
- Owner – The user who owns the workbook
- Updated By – The user who last updated the workbook
- Created Time – The timestamp when the workbook was created
- Last Modified – The timestamp of the most recent modification
If a workbook is associated with multiple data sources, it appears multiple times in the output—once for each data source.
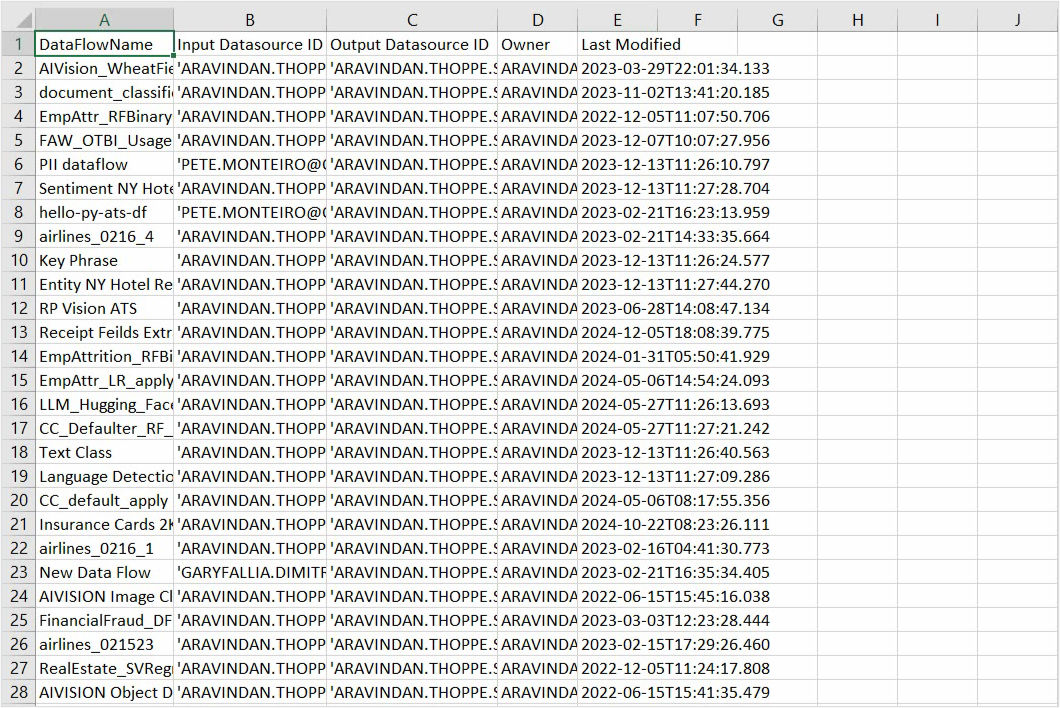
SYS_DATAFLOWS
This file contains details about data flows, including:
- Dataflow Name – The name of the data flow
- Input Datasource ID – The identifier of the input data source
- Output Datasource ID – The identifier of the output data source
- Owner – The user who owns the data flow
- Last Modified – The timestamp of the most recent modification
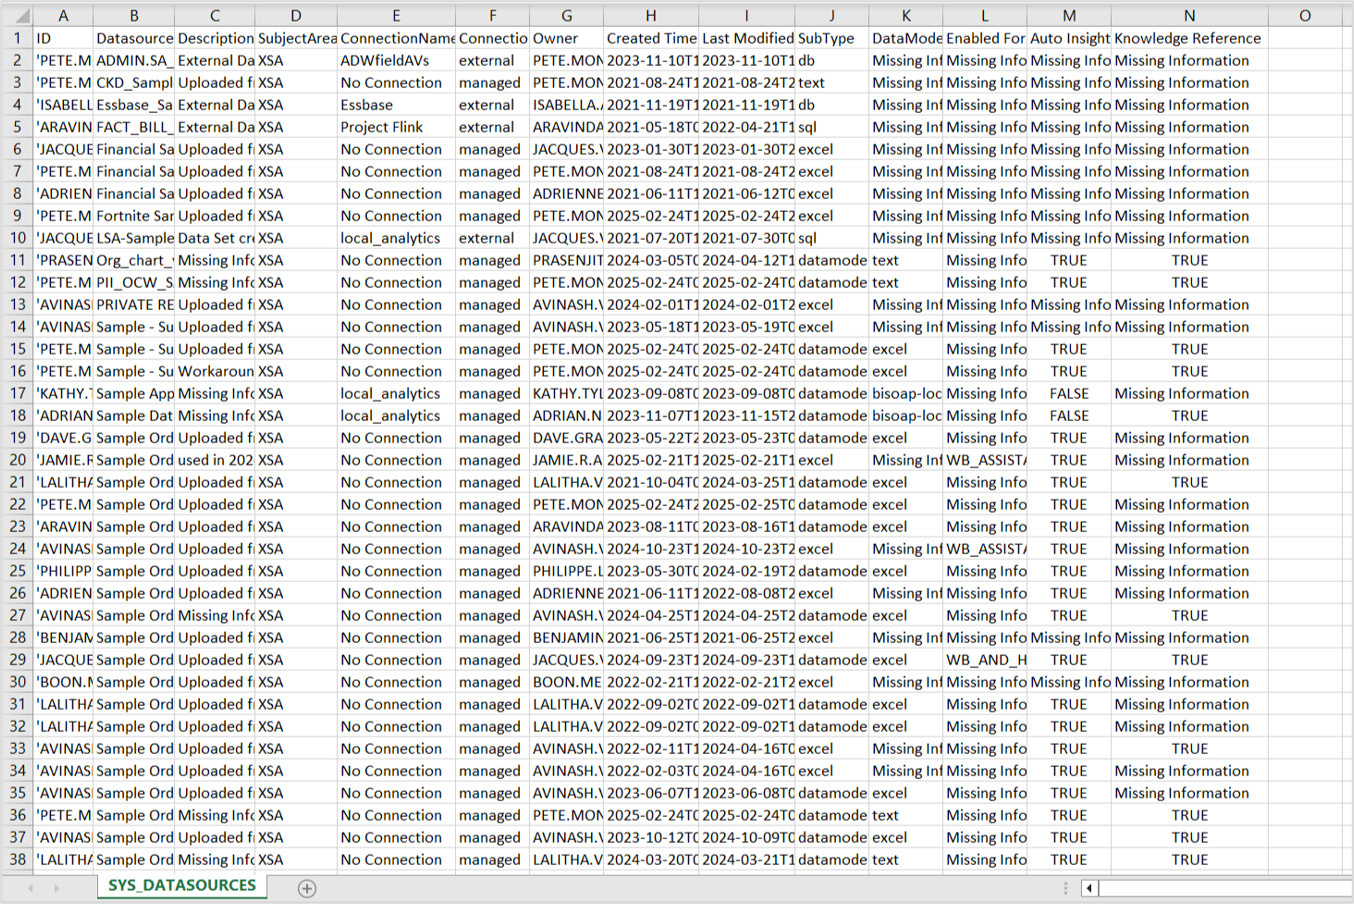
SYS_DATASOURCES
This file provides details about data sources, including:
- ID – The unique Object ID of the dataset
- Datasource – The name of the data source
- Subject Area – Specifies whether the data source is an RPD or XSA
- Connection Name – The name of the connection
- Connection Type – The type of connection used
- Owner – The user who owns the data source
- Created Time – The timestamp when the data source was created
- Last Modified – The timestamp of the most recent modification
- Sub Type – Indicates whether the data source is a text file, Excel file, data model, Parquet, etc.
- Data Model Provider – Displays the provider type (e.g., text, Excel, Parquet), and, if applicable, includes the data model type and provider, separated by a hyphen (-)
- Enabled For – Specifies whether Assistant and Home Page Ask features are enabled for the dataset
- Auto Insights – Indicates whether Auto Insights is enabled
- Knowledge Reference – Indicates whether Knowledge Reference is enabled
Consolidating the output files
The output from the Governance plugin provides valuable insights. For example, you can group workbooks, data flows, and data sources by attributes such as owner and last modified time. Additionally, you can identify datasets with AI Assistant or Auto Insights enabled to extract further insights directly from the output.
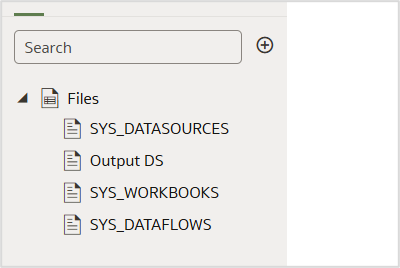
By creating a multi-table dataset with the output files in Oracle Analytics, you can conduct a more detailed analysis and gain deeper insights, such as how input and output data sources are mapped with a data flow or deriving lineage based on a connection etc. In Oracle Analytics, a multi-table dataset is constructed by adding all the output files. For more information, see the Joining Multiple Files In a Single Oracle Analytics Dataset video.
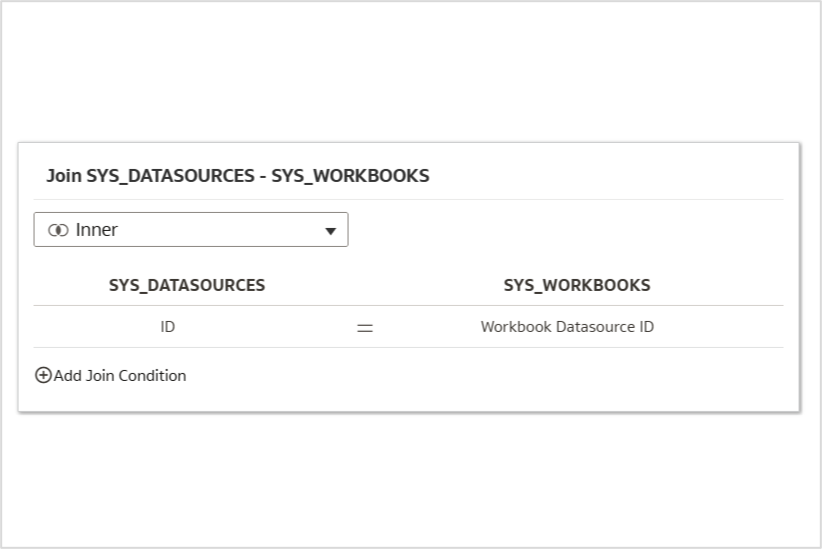
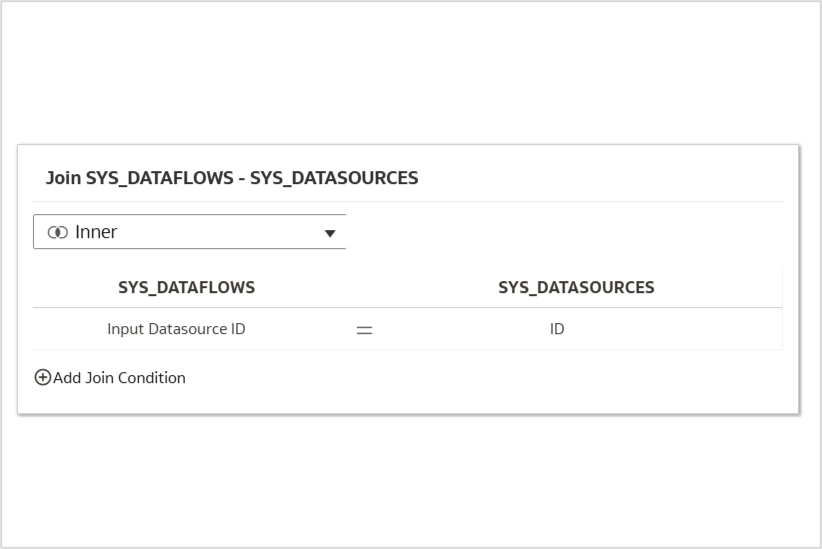
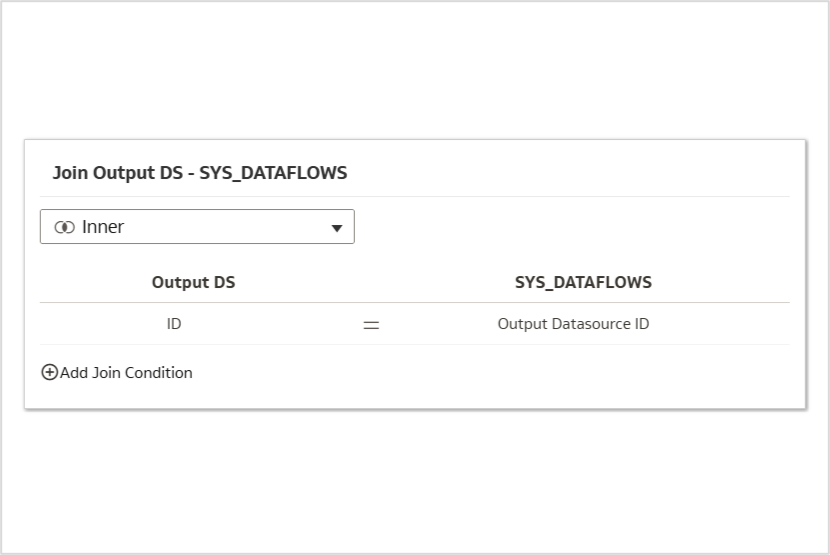
The output files are joined using ‘Datasource ID’—a common attribute present in all three outputs. The SYS_DATASOURCES file is duplicated as ‘Output DS’ and integrated with the output files to facilitate insight generation.
The multi-table dataset is created with four files:
Join diagram of the output:
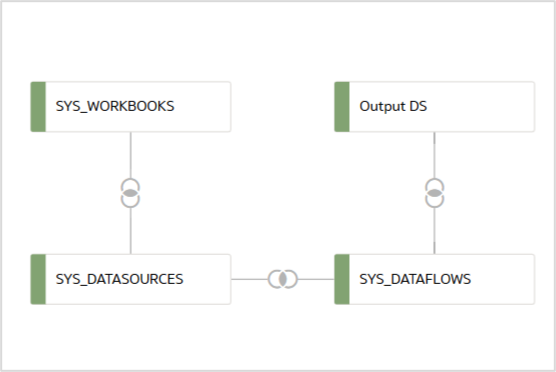
The output files are individually joined:
Use cases
The consolidated dataset enables you to visualize the Governance output data from various perspectives, as outlined in this section.
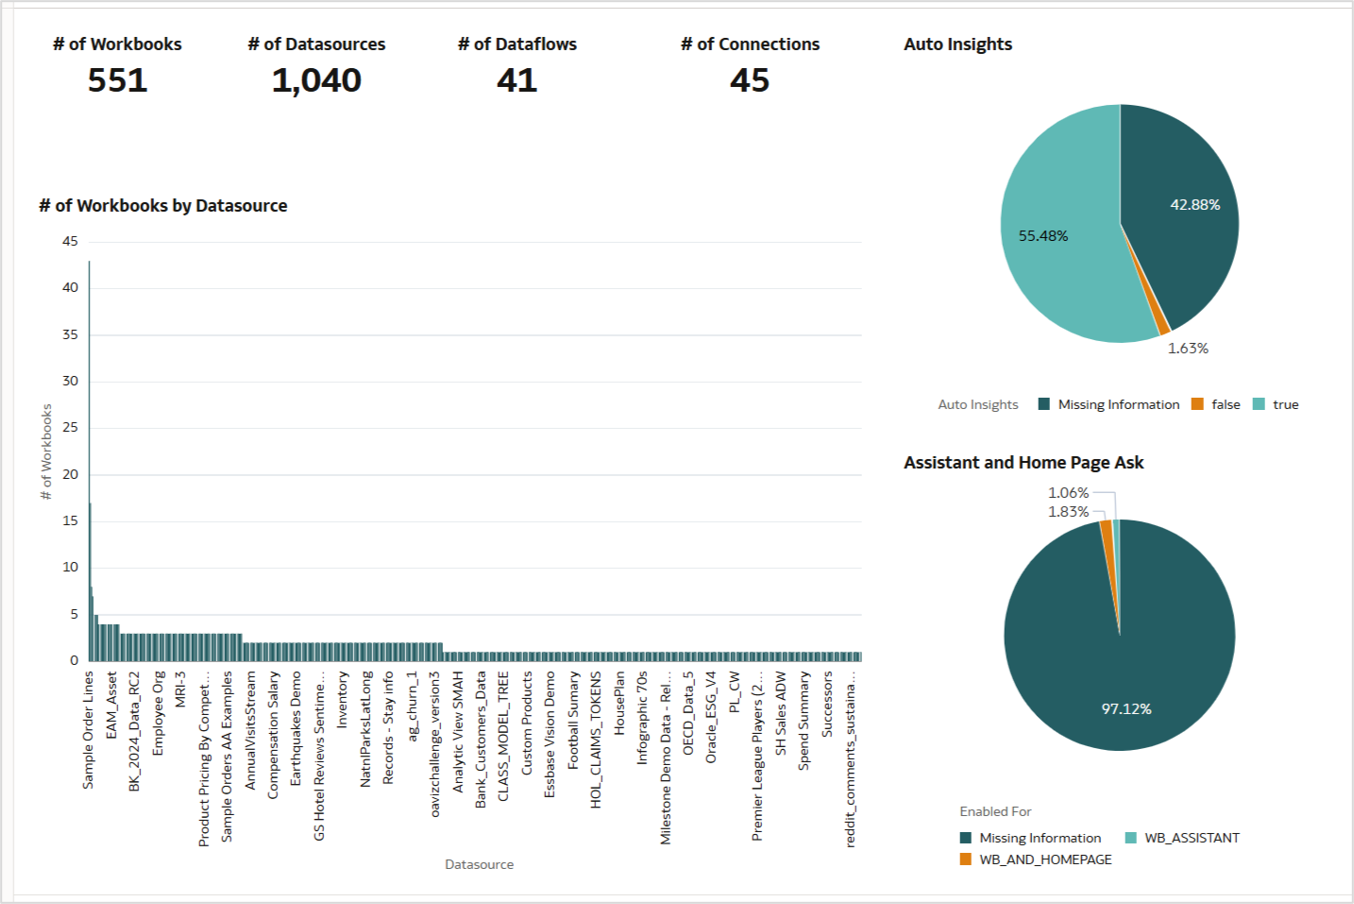
Insights panel
This canvas provides an overview of the number of various artifacts in the instance.
- For example, it displays 551 workbooks, 1,040 datasets, 41 data flows, and 45 connections, calculated using simple aggregations.
- The pie chart in the top-right illustrates the percentage of datasets with Auto Insights enabled.
The pie chart below represents the percentage of datasets where AI Assistant and Home Page Ask features are enabled.
Workbook data source mapping
This canvas focuses on workbooks, with a network graph that visualizes the relationships between data sources and workbooks.
- For example, you can highlight all the workbooks that use “Sample Order Lines” as a data source.
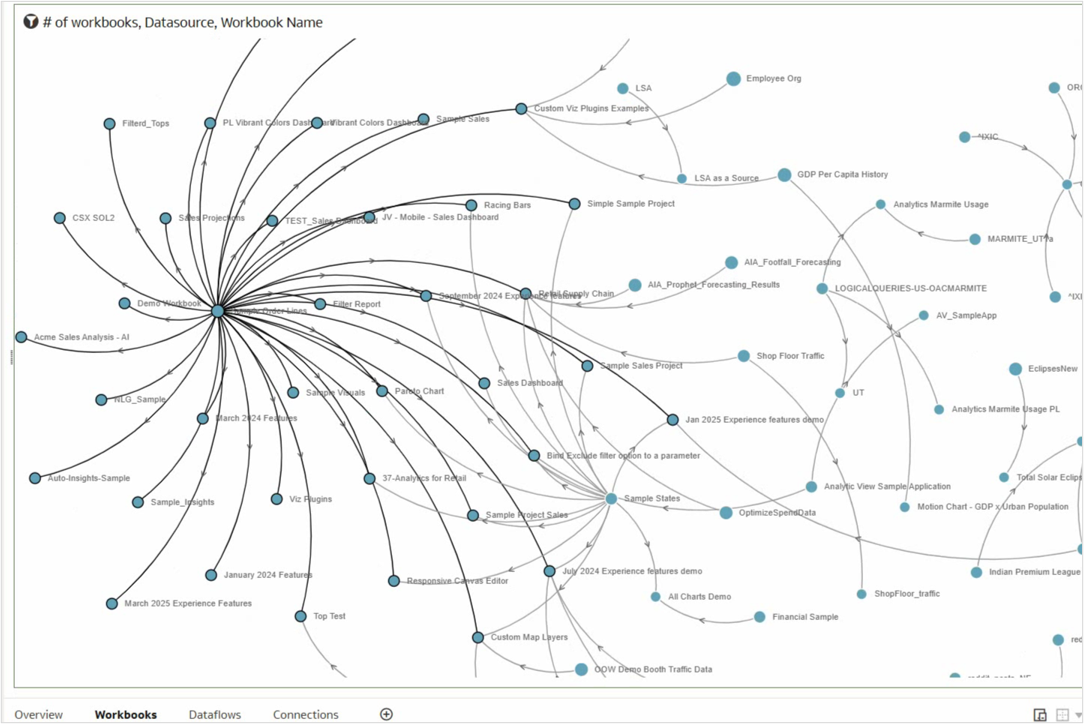
- Similarly, another section displays workbooks that use “Sample States” as a data source.
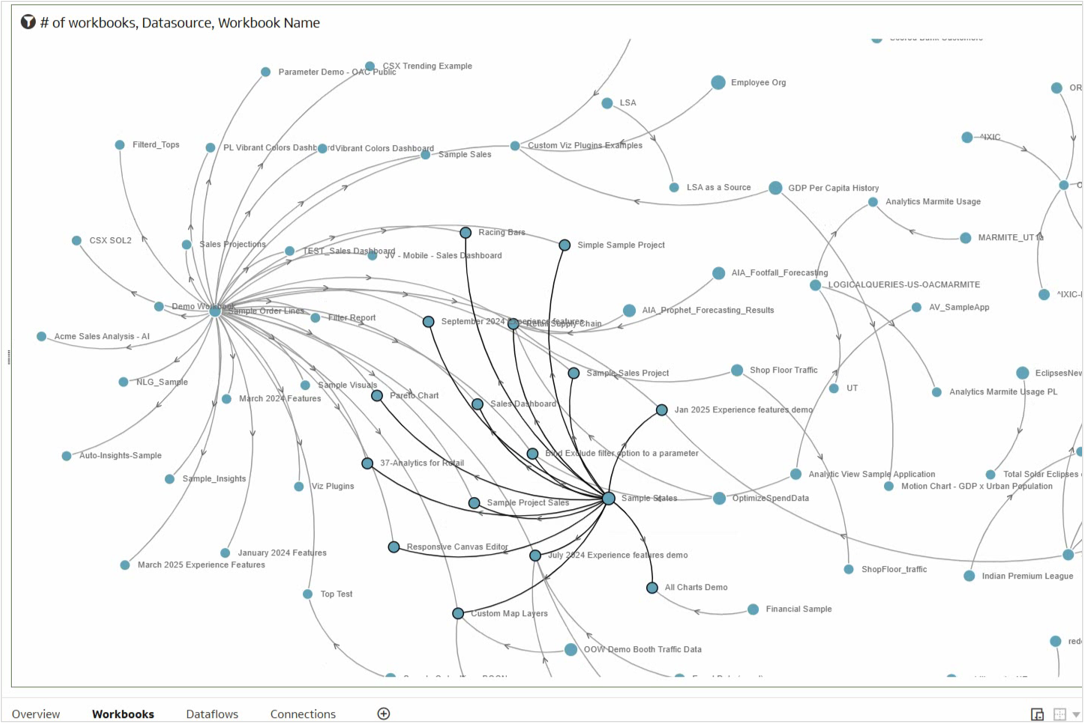
- Additionally, this visualization identifies workbooks that incorporate both “Sample Order Lines” and “Sample States” as data sources.
Input and output of data flows
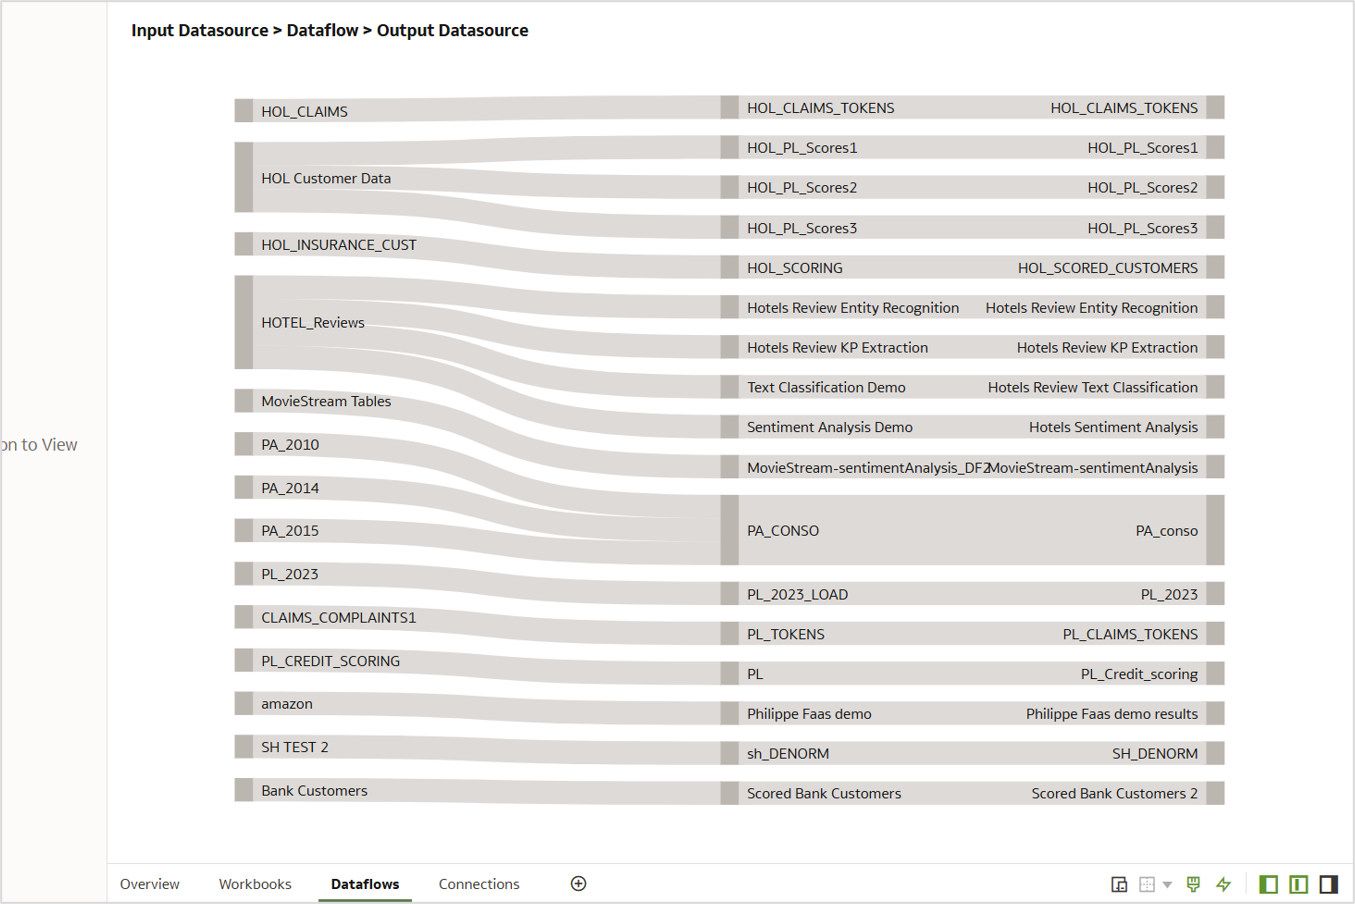
The Sankey chart visualizes the relationships between input and output data sources across all data flows. For example, the Hotel Reviews dataset serves as an input for multiple data flows, generating various output datasets.
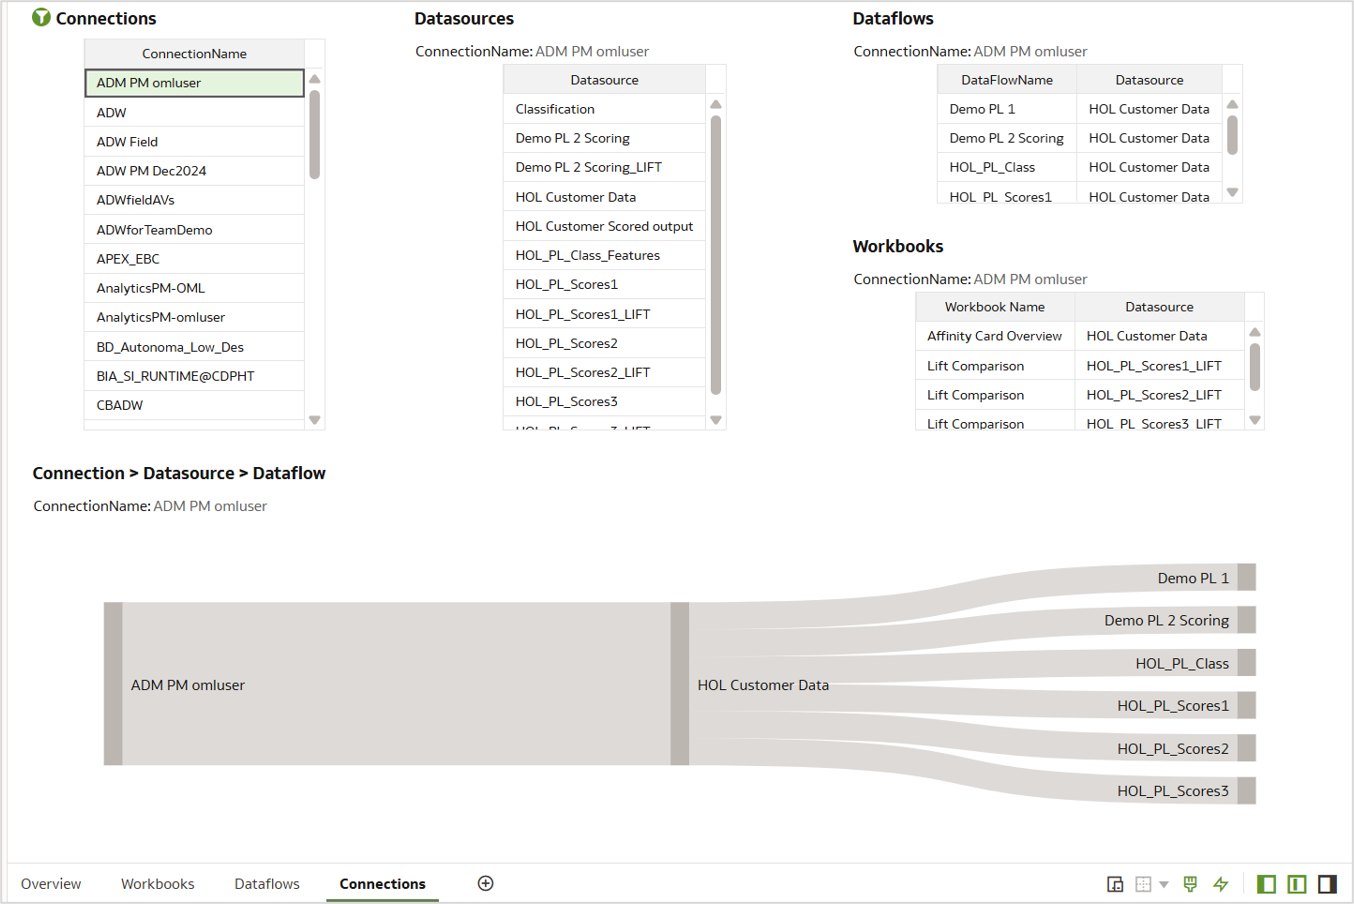
Connection lineage
This canvas demonstrates how the Governance Output enables the identification of all related artifacts associated with a specific connection.
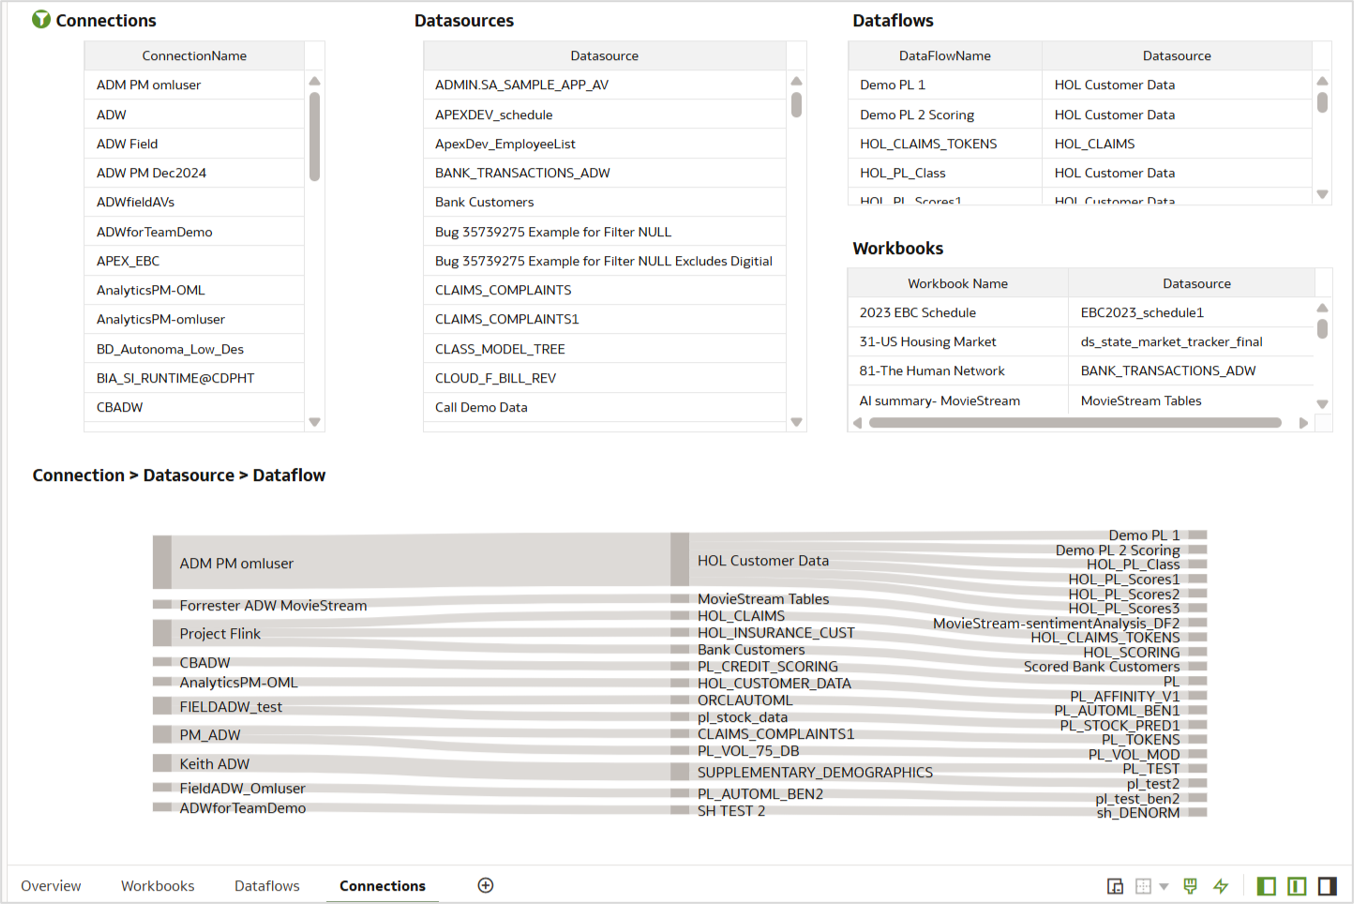
By leveraging Datasource ID to join the tables, users can efficiently trace all data flows and workbooks linked to a particular connection—such as ‘ADM PM omluser’—with a single click.
Call to action
In this article, you explored how to invoke the Governance plugin, aggregate the output data, and visualize insights effectively. Now that you’ve gone through this article, we encourage you to try it yourself and share your results in the Oracle Analytics Community. You can also ask questions and contribute ideas to enhance the discussion.