![]()
Horizontal Pod Autoscaling (HPA) is crucial for maintaining application performance and reliability in a Kubernetes cluster.
You can use Kubernetes HPA to automatically scale the number of pods in a deployment, replication controller, replica set, or stateful set, based on that resource’s CPU or memory utilization, or on other metrics. HPA can help applications scale out to meet increased demand, or scale in when resources are no longer needed. You can set a target metric percentage that HPA must meet when scaling applications.
This article walks you through setting up HPA in Oracle Cloud Infrastructure (OCI) using Nginx as a sample application.
Prerequisites
- Oracle Cloud Account: Ensure you have an active Oracle Cloud account.
- OCI CLI: Install and configure the OCI Command Line Interface (CLI).
- Kubernetes Cluster: Set up a Kubernetes cluster on OCI with at least 2 nodes to ensure high availability and redundancy.
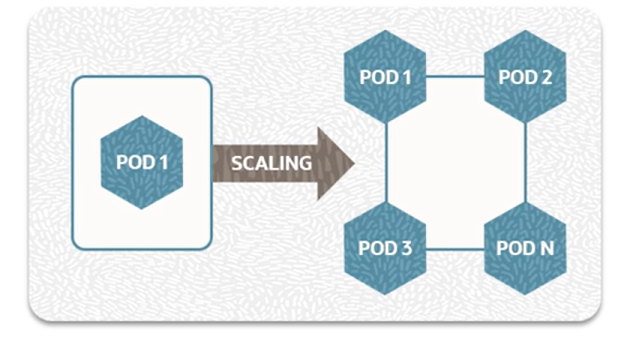
The diagram illustrates the scaling process in OCI using the HPA.
Overview of Steps
- Install the Metrics Server.
- Verify the Metrics Server installation.
- Deploy a sample application.
- Create an HPA.
- Verify the HPA.
- Test autoscaling.
- Stop the load simulation.
- Delete the HPA.
Step 1: Install the Metrics Server
The Metrics Server collects essential resource usage data necessary for HPA:
- Resource Utilization Data: The Metrics Server collects and aggregates real-time data on CPU and memory usage from all nodes and pods within the Kubernetes cluster.
- HPA Functionality: HPA relies on this data to determine when to scale the number of pod replicas up or down. Without the Metrics Server, HPA can’t access the necessary metrics to make informed scaling decisions.
First, download the Metrics Server manifest:
Open the metrics-server.yaml file in a text editor and remove the livenessProbe and readinessProbe sections from the Metrics Server deployment manifest.
This is often necessary to avoid issues where the server is incorrectly marked as unhealthy or not ready. These probes are designed to check the health and readiness of the application. If not configured correctly, they can cause the Metrics Server to be restarted frequently or to be deemed unavailable, leading to disruptions in metrics collection, which is essential for HPA to function correctly.
Remove the following livenessProbe and readinessProbe section from the manifest of the metrics-server deployment:
httpGet:
path: /livez
port: 443
initialDelaySeconds: 10
timeoutSeconds: 1
readinessProbe:
httpGet:
path: /readyz
port: 443
initialDelaySeconds: 10
timeoutSeconds: 1
After editing, apply the Metrics Server manifest:
Step 2: Verify the Metrics Server Installation
Ensure the Metrics Server is running correctly.
Step 3: Deploy a Sample Application
Create a sample deployment (for example, Nginx) and save it to a file named nginx-deployment.yaml.
kind: Deployment
metadata:
name: nginx-deployment
spec:
replicas: 1
selector:
matchLabels:
app: nginx
template:
metadata:
labels:
app: nginx
spec:
containers:
- name: nginx
image: nginx:1.14.2
ports:
- containerPort: 80
resources:
requests:
cpu: "500m"
limits:
cpu: "200m"
Explanation of Resource Requests and Limits
- Requests: The amount of CPU (or memory) that Kubernetes guarantees to a container. In this example, the container requests 500 milliCPU (0.5 CPU).
- Limits: The maximum amount of CPU (or memory) that the container can use. In this example, the container is limited to 200 milliCPU (0.2 CPU).
These settings help Kubernetes manage resources efficiently, ensuring containers get the necessary resources while preventing any single container from using too much. Adjust these values based on your application’s specific needs and performance requirements.
Apply the deployment:
Step 4: Create a Horizontal Pod Autoscaler
Use the following command to create the HPA directly, which avoids the need for a YAML file:
This command does the following:
- Targets the Deployment: nginx-deployment
- Sets CPU Utilization Target: 50% (–cpu-percent=50)
- Sets Minimum Replicas: 1 (–min=1)
- Sets Maximum Replicas: 10 (–max=10)
Step 5: Verify the HPA
Check the status of the HPA:
This command displays the current scaling status, including metrics and the number of replicas.
Step 6: Test Autoscaling
To test autoscaling, you can simulate a load on your application.
First, create a service to expose the Nginx deployment. Save the following YAML to a file named nginx-service.yaml.
kind: Service
metadata:
name: nginx-service
spec:
selector:
app: nginx
ports:
- protocol: TCP
port: 80
targetPort: 80
Apply the service configuration:
Now, simulate the load:
while true; do wget -q -O- http://nginx-service; done
Monitor the HPA to see if it scales up the number of pods:
Step 7: Stop the Load Automation
When the load simulation stops, the number of pods should decrease back to the minimum number specified by the HPA. This ensures that resources are used efficiently without over-provisioning.
Step 8: Delete the HPA
If you need to delete the HPA, use the following command:
Conclusion
By following these steps, you can set up automatic scaling of pods in OCI, ensuring your applications remain responsive under varying loads. Autoscaling helps optimize resource usage and maintain application performance, making it an essential feature for modern cloud-native applications.
Call to Action
Once you’ve tried this yourself, share your results in the Oracle Analytics Community.
To find out more, read Kubernetes Clusters and Node Pools in the Kubernetes documentation.