Using Data Actions in Oracle Analytics Data Visualization is a great way to navigate workbooks while passing values that can assist you in exploring data with different contexts. With just a couple of clicks, you can move between canvases within your workbook and get contextualized analysis for specific pieces of data.
There are 4 types of Data Actions that can be performed: Analytics Link, Publish Event, HTTP API, and URL Navigation.
In this blog edition, you’ll see how to use the Analytics Link Data Action type to navigate between canvases/workbooks. A future post will highlight Publish Event, HTTP API and URL Navigation.
Use Case
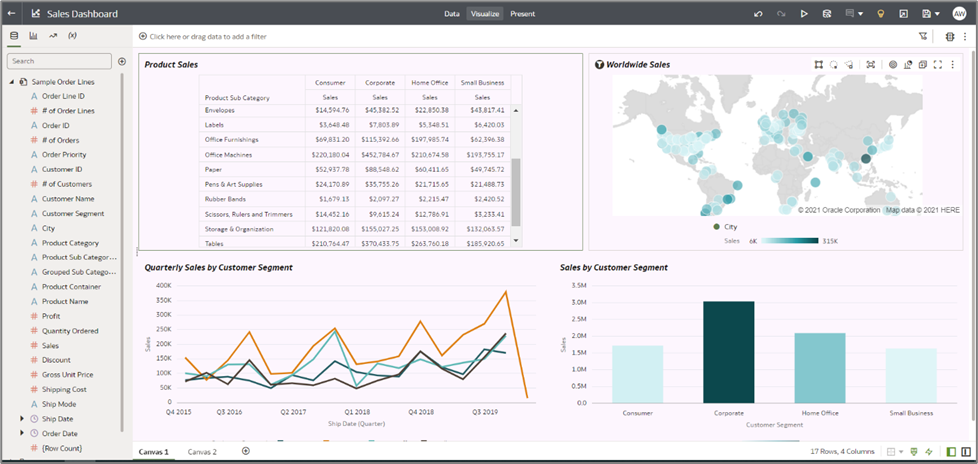
In this example, you are looking at the Product Sales report on Canvas 1 and would like to use data actions to get more relevant information for the Chairs & Chairmats sub-category. When the action is selected, you want to move to Canvas 2, passing values from the Product Sales report to a more specialized analysis.
First, configure Actions for the Workbook by clicking the menu and selecting Data Actions.
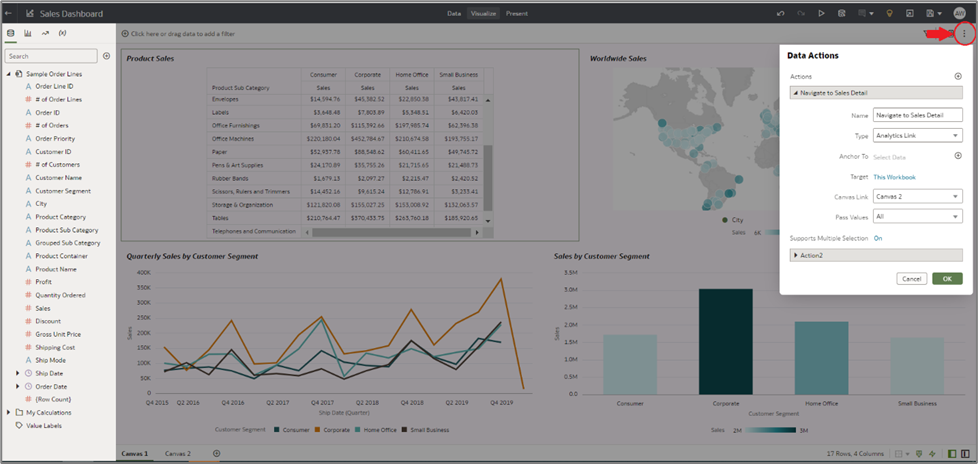
- Click the + to create a new action.
- Give the action a name. This name will show on the selection menu when you are ready to execute the action.
- Select the Analytics Link type. Skip over the “Anchor To” for now – you’ll revisit that later.
- You can choose to navigate within the current workbook or to another workbook within your catalog.
- The Pass Values property allows you to determine what data you would like to send as filters to the Target Location. You can choose to pass along all the values that are selected within the specific visualization, or you can choose either None or a custom selection. You may also select to pass along the Anchor Data. Selecting Anchor Data would only pass along the data chosen in the “Anchor To” section.
- Save the action.
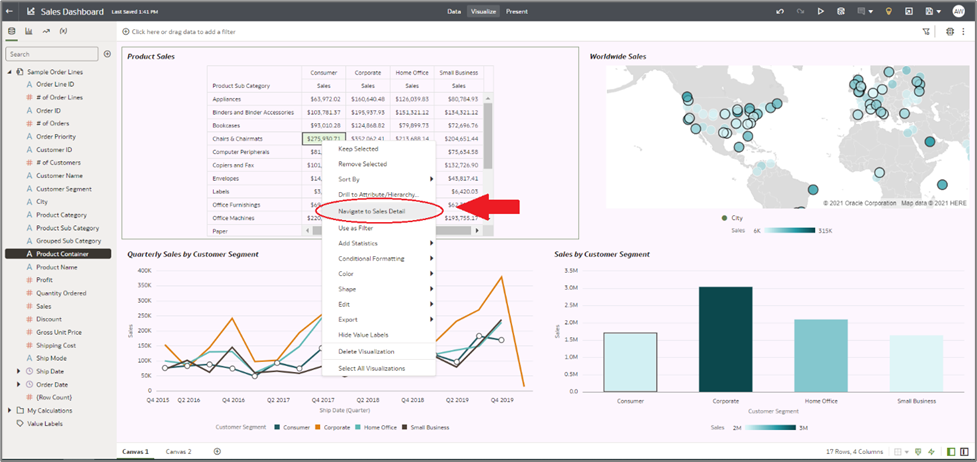
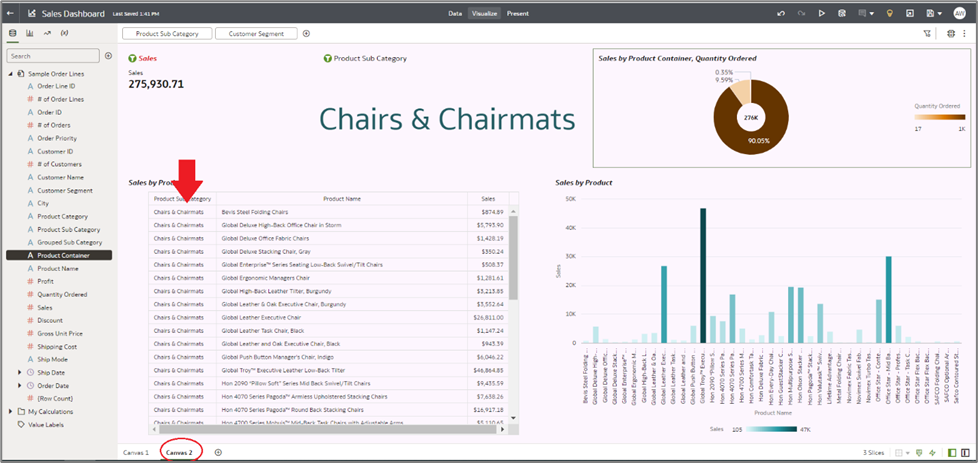
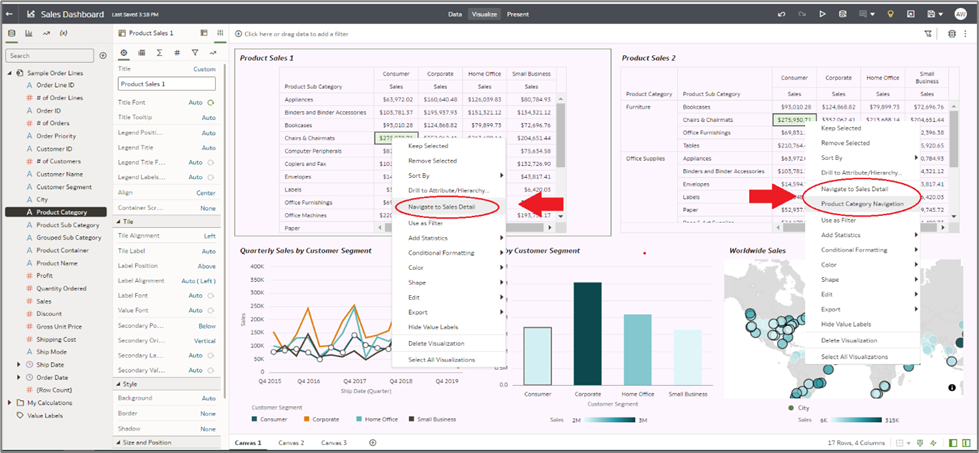
Within the Sales report, you can right-click any of the dollar amounts for Chairs & Chairmats and select the Navigate action from the middle of the menu. You will see that the action takes us to canvas 2 where now the Chairs & Chairmats sub-category is being used as a filter for the canvas.
Canvas 1
Canvas 2
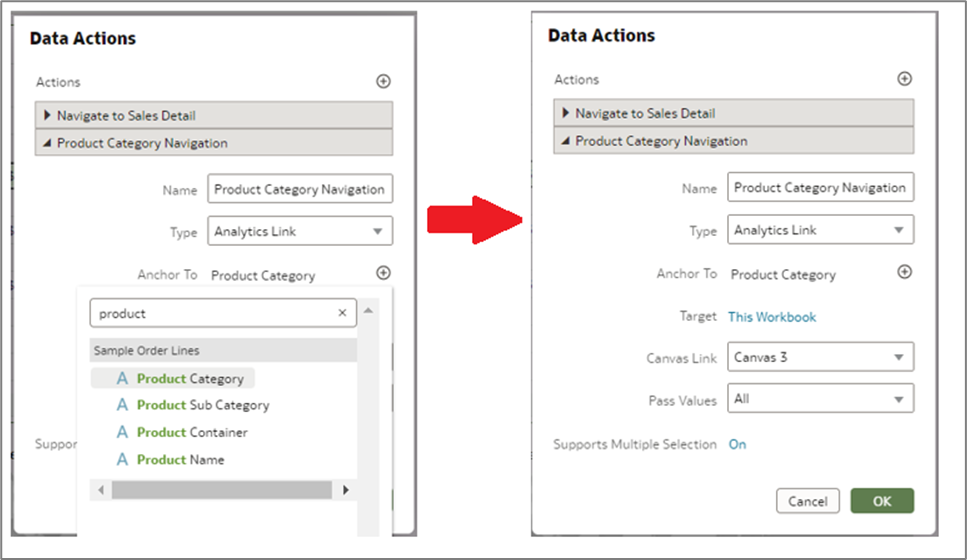
Now, suppose you want the Actions menu to be available for only analyses with specific columns of data. The Anchor To property in the Data Actions menu allows users to anchor Data Actions to a specific column(s). When configured, the Actions menu will only be available for visualizations that are using that column.
The next step is to create a 2nd Action that will pass values to Canvas 3 – but only when the Product Category column is present in the analysis.
Here is the configuration for Data Actions:
- In the Anchor To property, select the Product Category column. This Action will only be available for analyses that include Product Category.
- Choose Canvas 3 for the Canvas Link navigation.
See the results below. Notice that a right-click on an amount in the Product Sales 1 report only shows one Data Action to choose from. This is because the report does not include the anchored Product Category column. In the Product Sales 2 report on the right, both Data Actions are available.
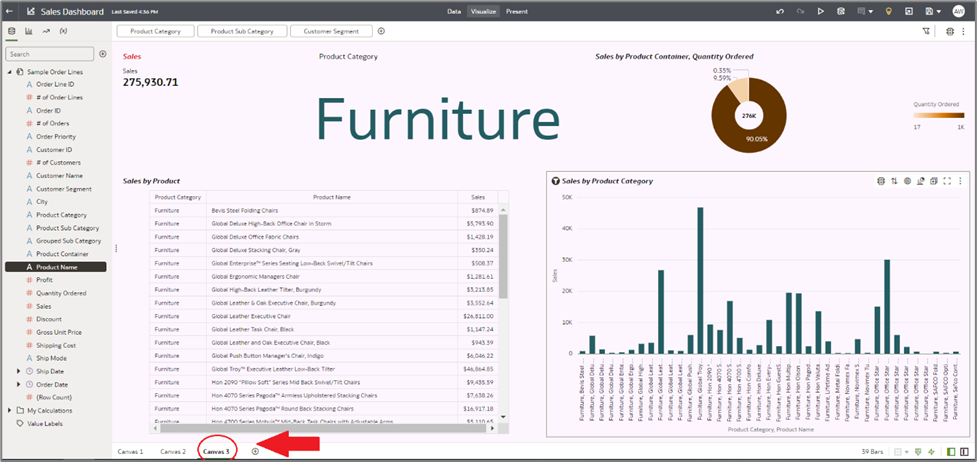
Results on Canvas 3
This is how to use Data Actions to help create contextualized navigation links.
To learn more about how you can benefit from Oracle Analytics, visit Oracle.com/analytics.