The Oracle Analytics Cloud (OAC) November 2024 update offers a strong series of features and enhancements. After OAC’s September 2024 update brought customers the keenly-awaited Oracle Analytics AI Assistant (you can get started with it here), the November update builds on the resulting momentum and continues to increase value with a long list of enhancements for analysts and administrators.
Featured highlights from this update:
- Augmented Analytics and Machine Learning
- OCI AI Services Integration: Run custom Document Understanding models.
- Exploring, Dashboarding, and Storytelling
- Enhanced Distribution: Share workbook URLs with persisted filters.
- Accelerated Dashboard Creation: Shared templates.
- Advanced Design Features: Custom themes, tooltips, and filter controls.
- Enhanced Navigation: Catalog experience and home page customization.
- Data Connectivity, Modelling and Preparation
- Expanded Connectivity: Connect to remote Databricks data sources.
- Administration
- Update Cycle Options: Set preferences across OAC environments.
- Fine-Grain Permissions: Manage permissions for custom groups, layers, and themes.
Augmented Analytics and Machine Learning
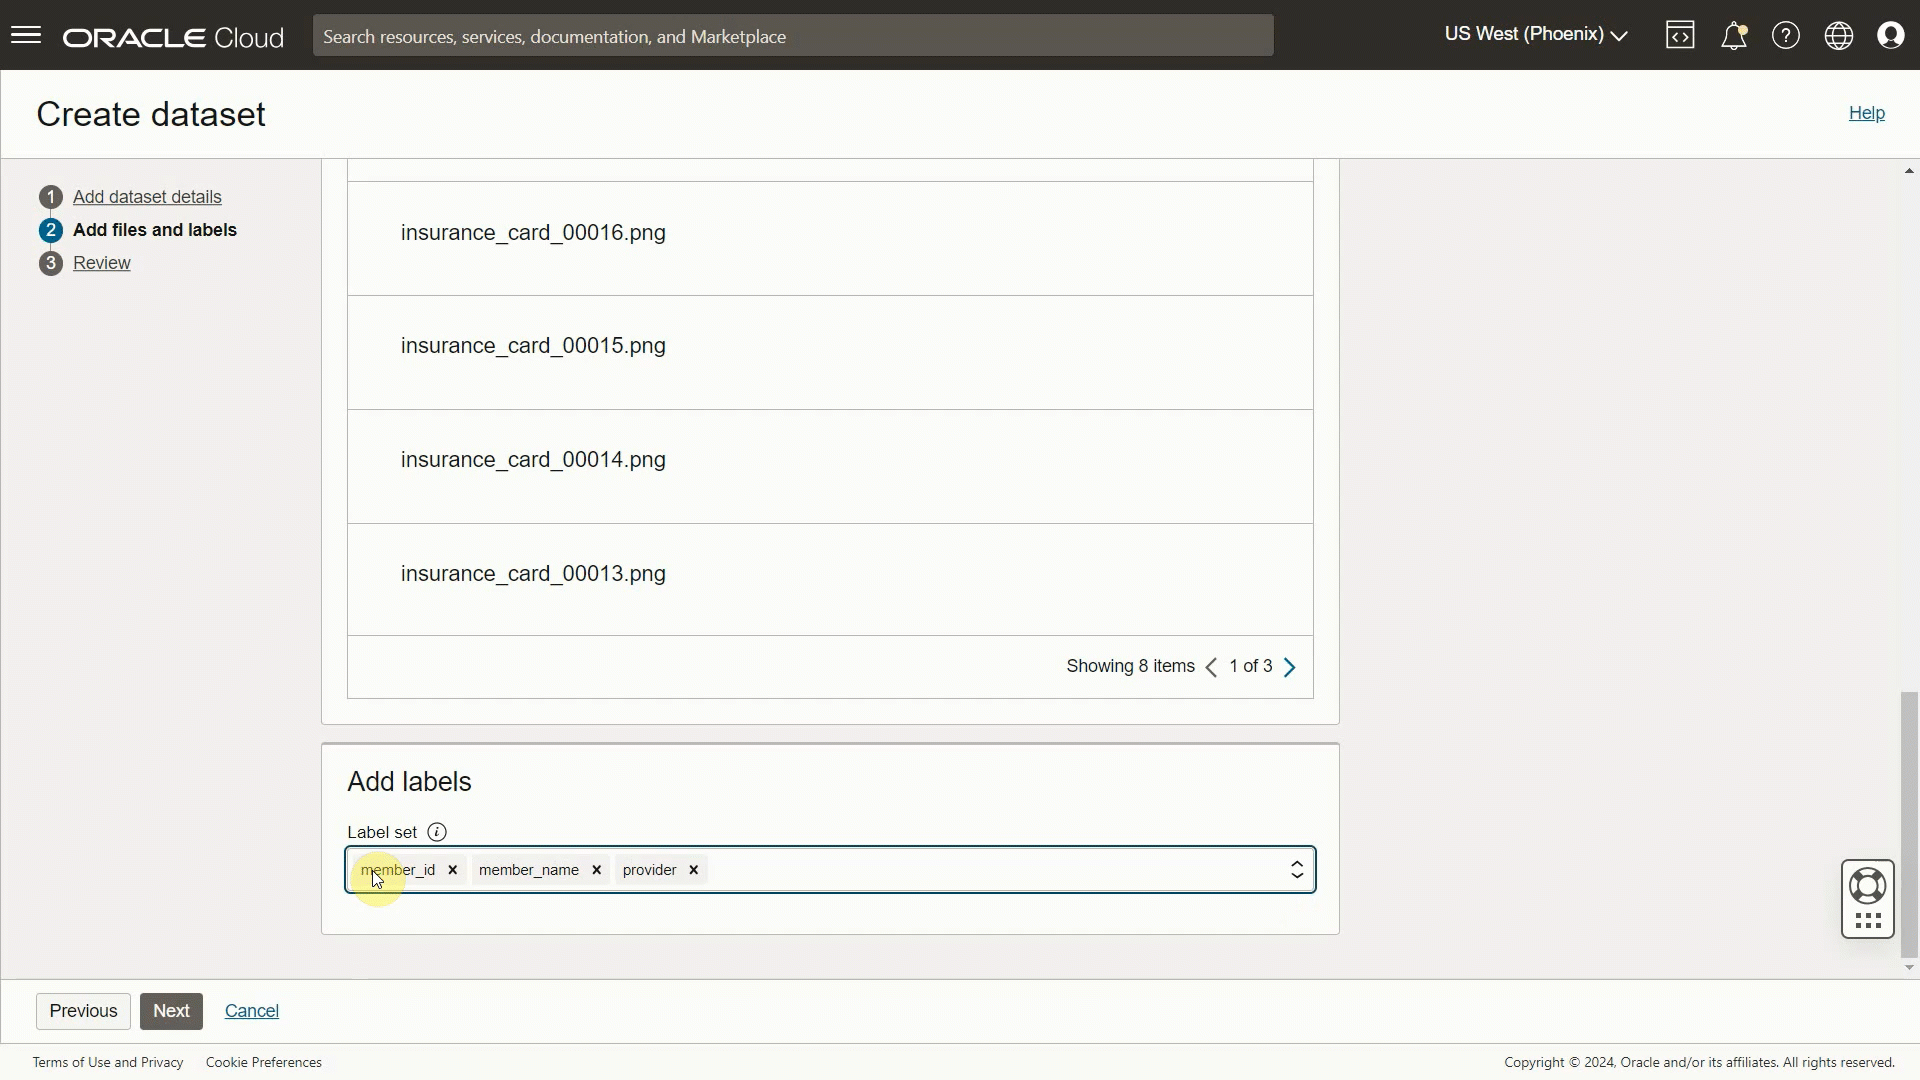
Oracle Analytics now allows the deployment of custom OCI Document Understanding models for classification and key value extraction. Once a custom model is created and trained in OCI, it can be registered and run within Oracle Analytics Cloud, leaving the results available to be further aggregated and explored using Oracle Analytics Cloud Data Visualization. This offers customers an intuitive experience when designing models to accelerate the processing of large collections of documents.
Exploring, Dashboarding, and Storytelling
The November 2024 update enhaces the entire author experience, from navigation to communication.
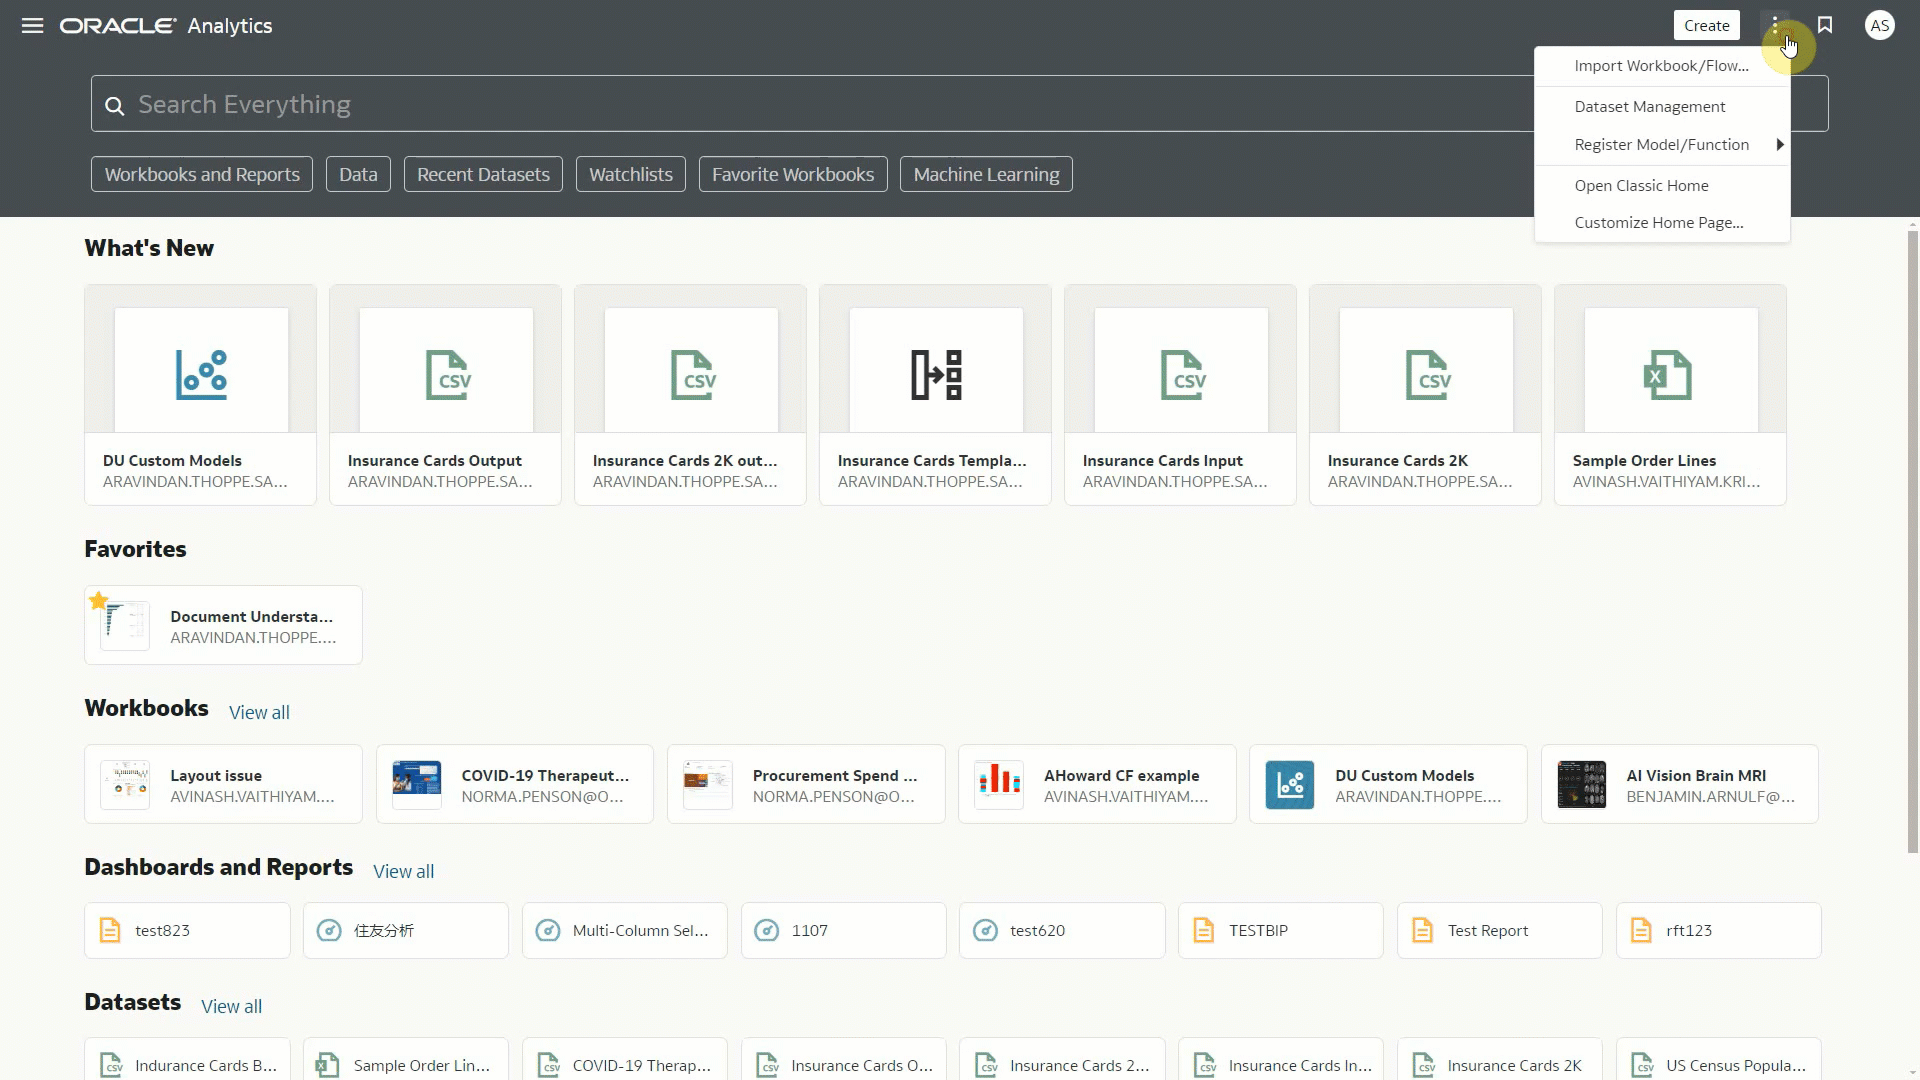
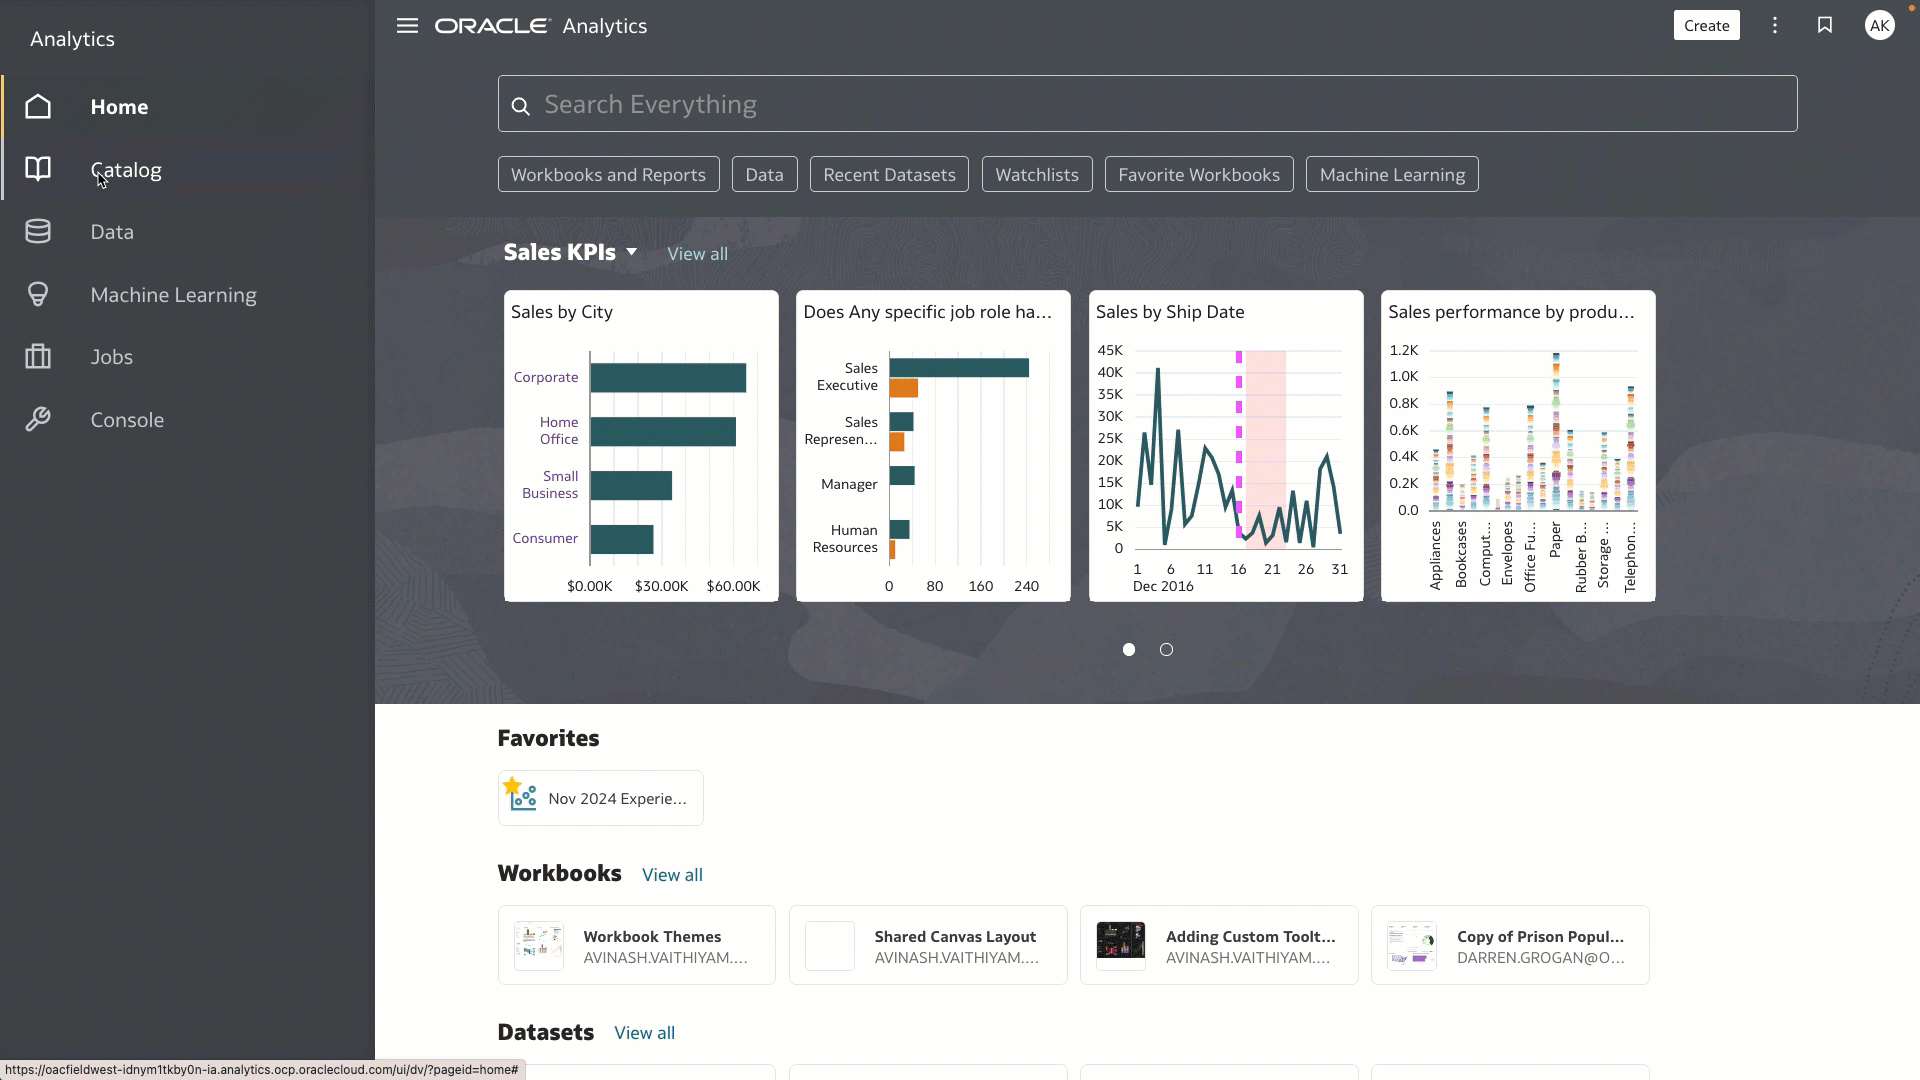
Users can expect a streamlined homepage navigation with custom groups. This allows users to assemble any combination of dashboards, data sets, and visualizations together for direct access upon opening Oracle Analytics Cloud. In the Catalog, users will now find folders in a new directory format. This one-pane view across all folders (as shown in Figure 3) allows for easier identification of files and swifter reorganization of artifacts via drag and drop.
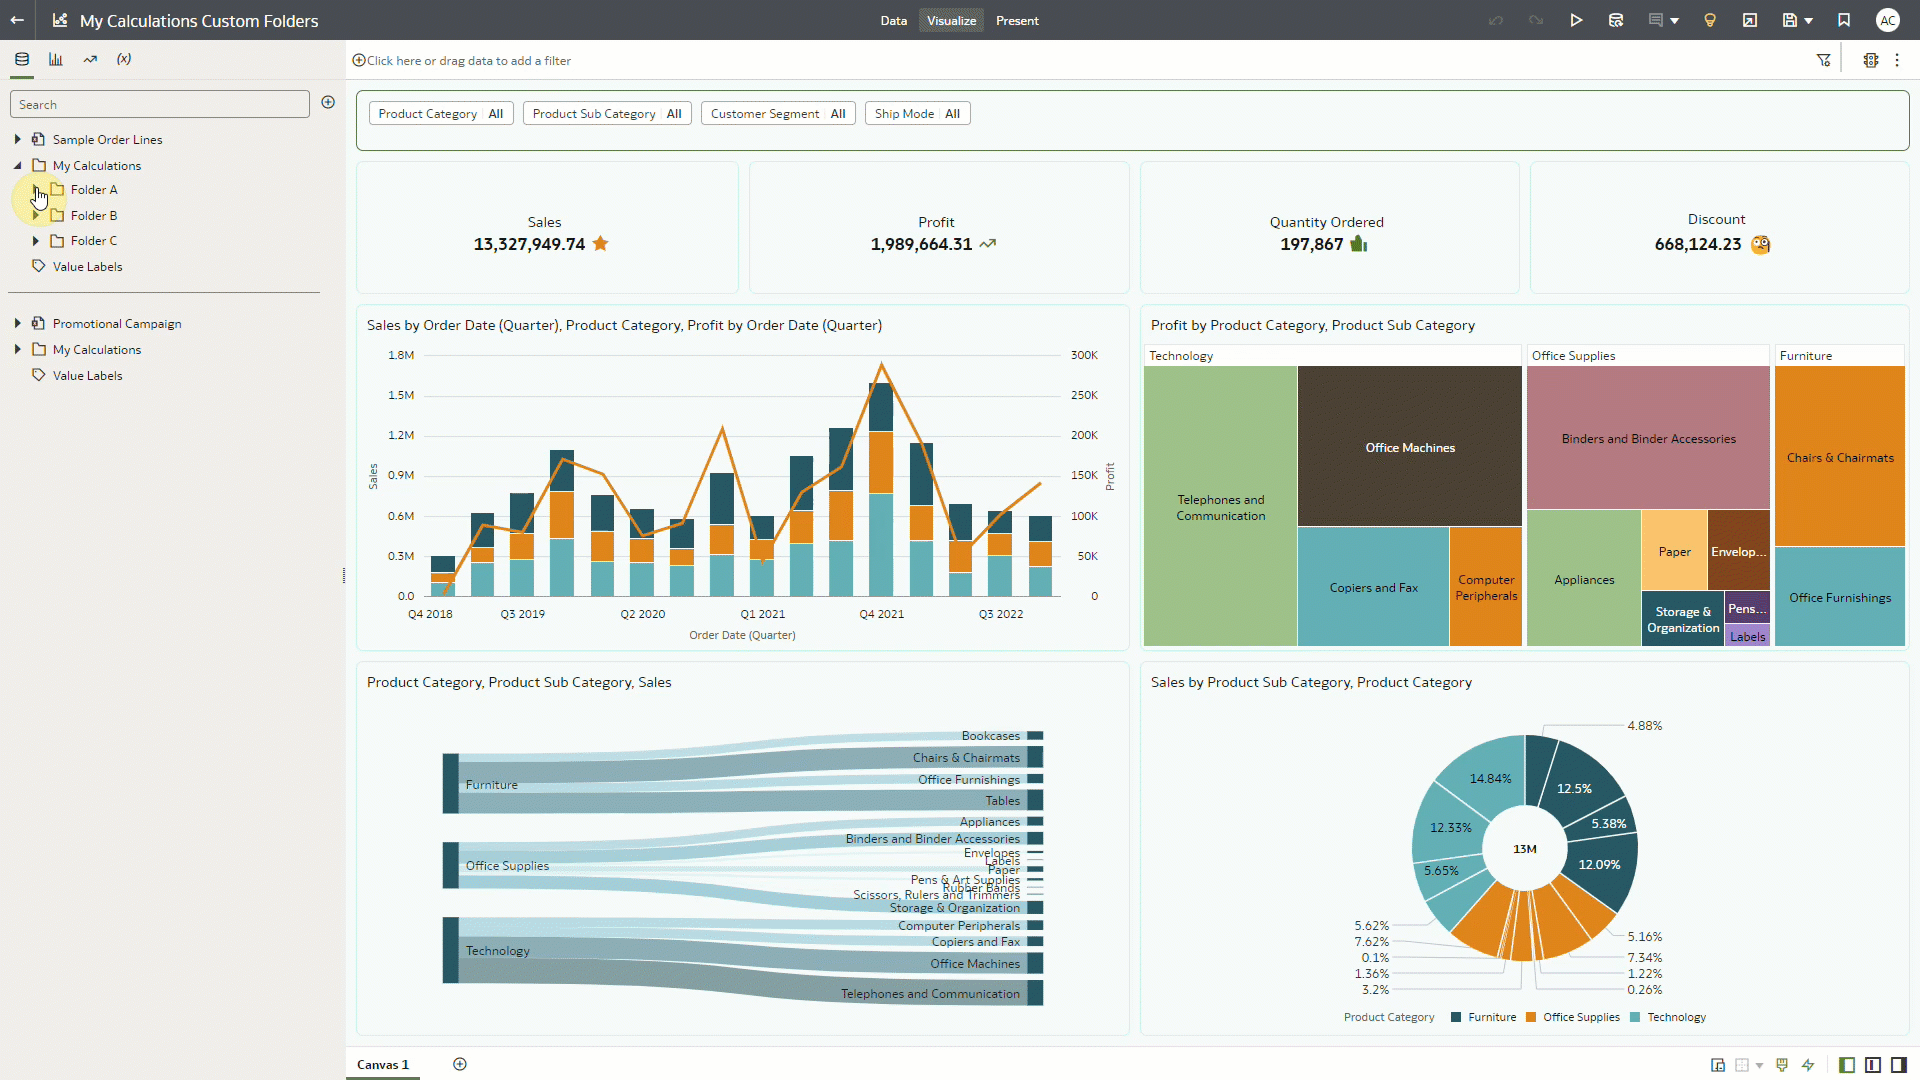
Sorting has also been enhanced within Workbooks. The new search area in the Add Data dialog allows users to find tables more easily. Similarly, the addition of custom calculation folders makes the management of calculations in workbooks with multiple datasets more comprehensive. These folders can be renamed, deleted and custom sorted via drag and drop, providing easy organization for every author.
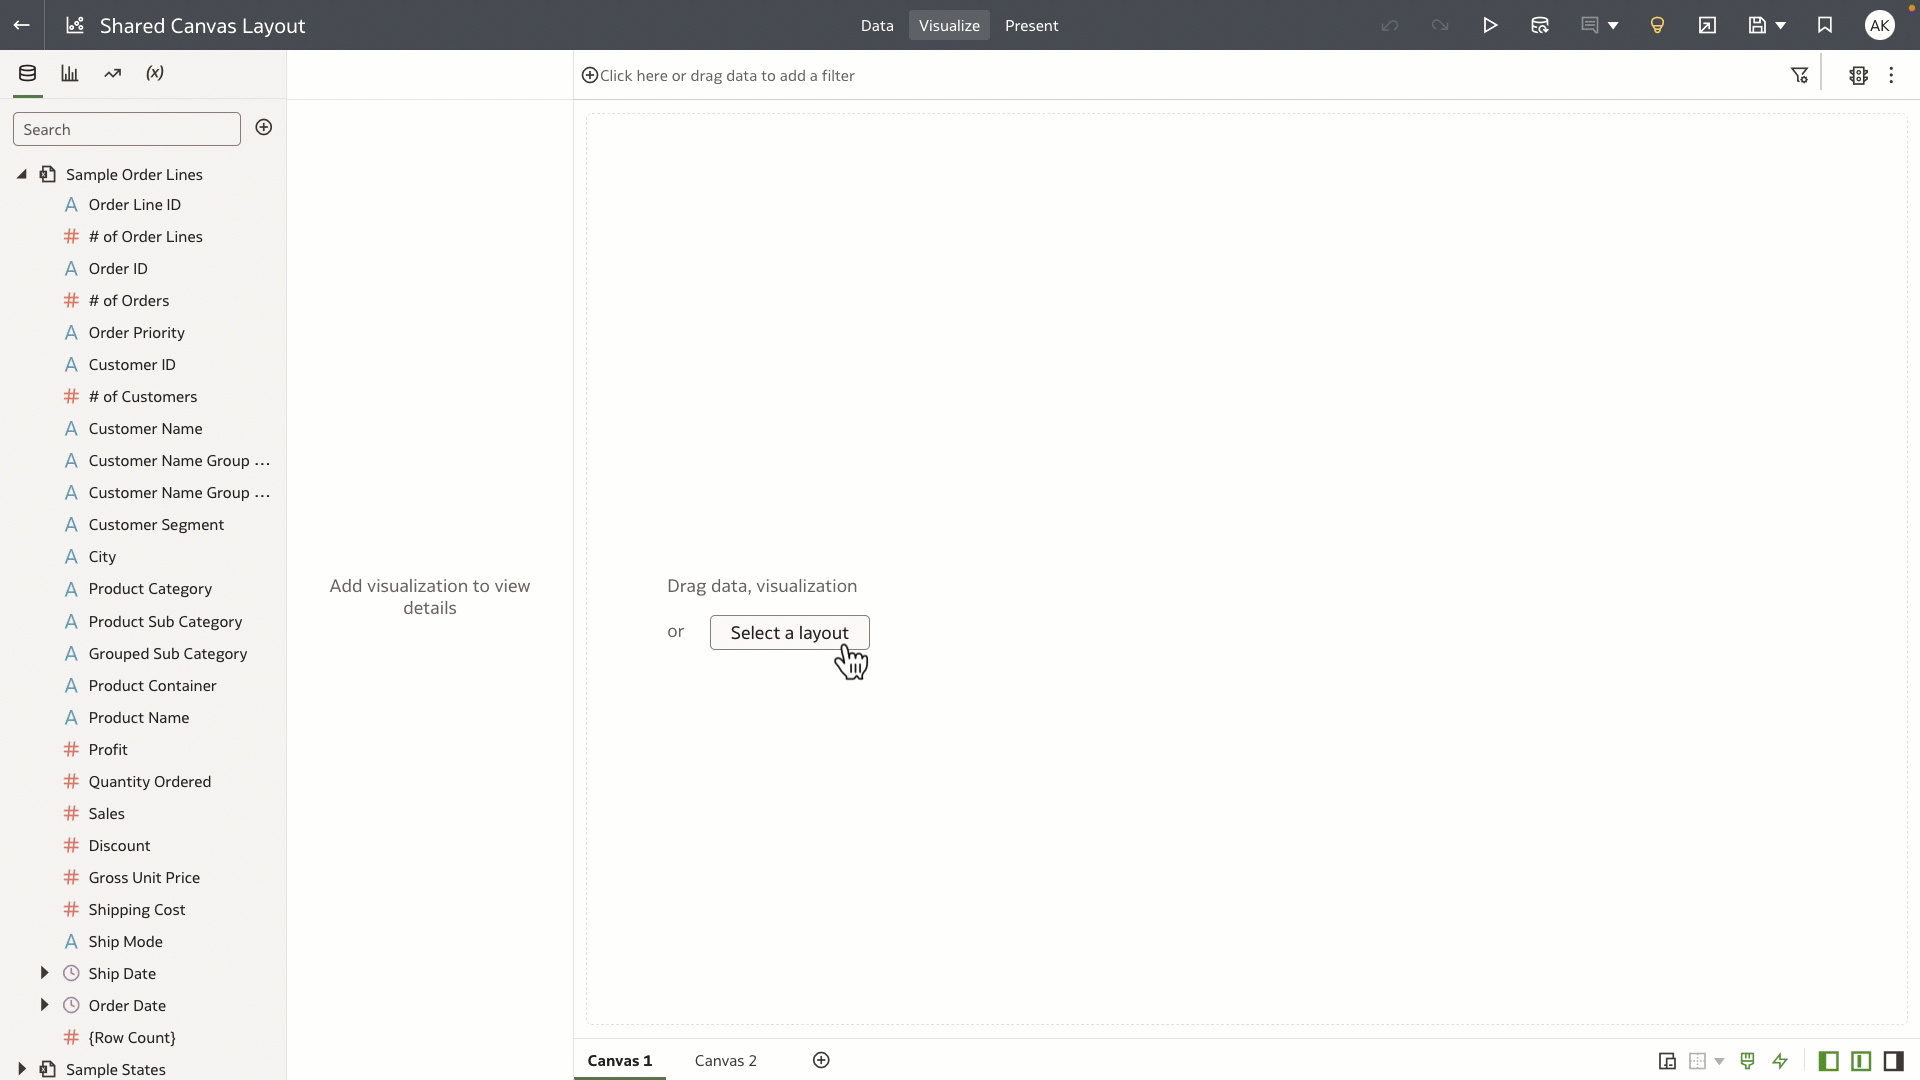
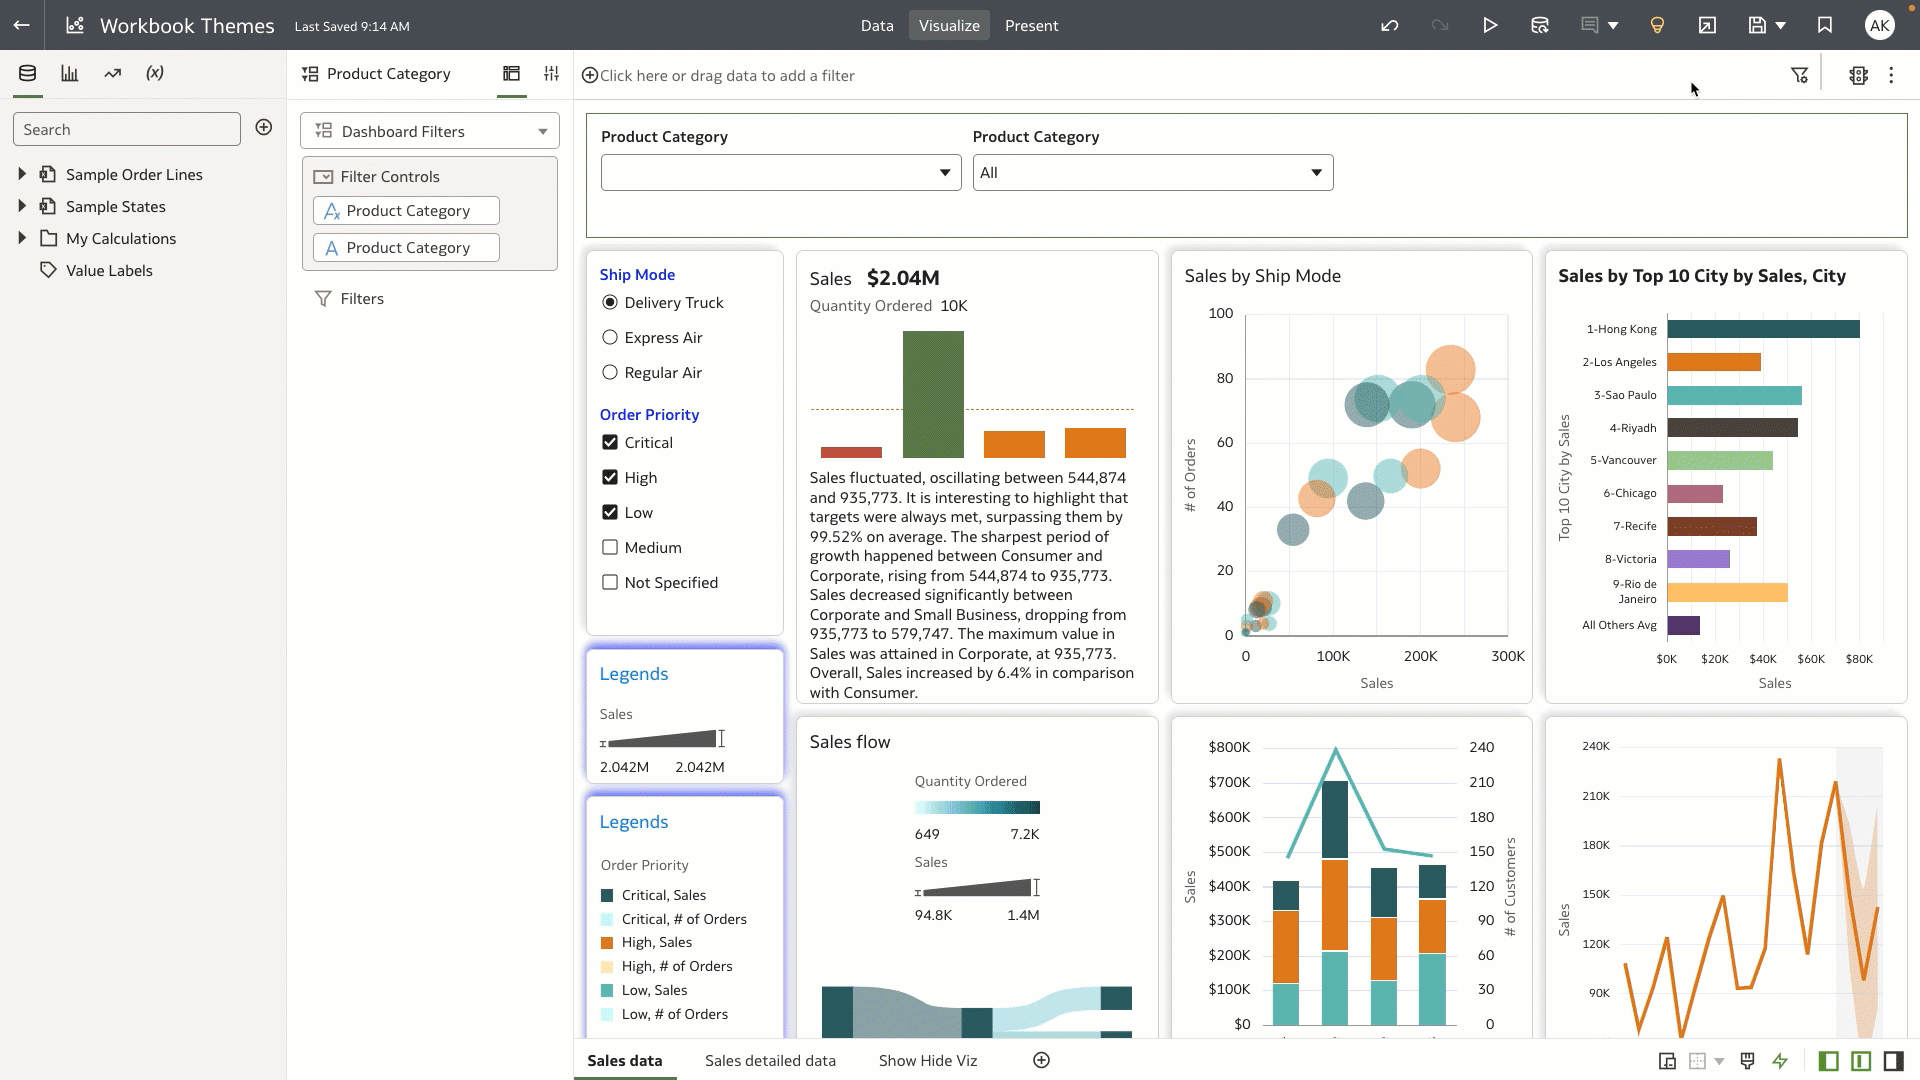
Accelerated dashboard creation is enabled with the shared canvas templates. Selecting a template applies a series of empty containers across the canvas, ready to be populated with visualizations via drag and drop. See how authors can use the custom watchlists to accelerate this process further.
Authors now have access to a range of options to design and stylise their canvases:
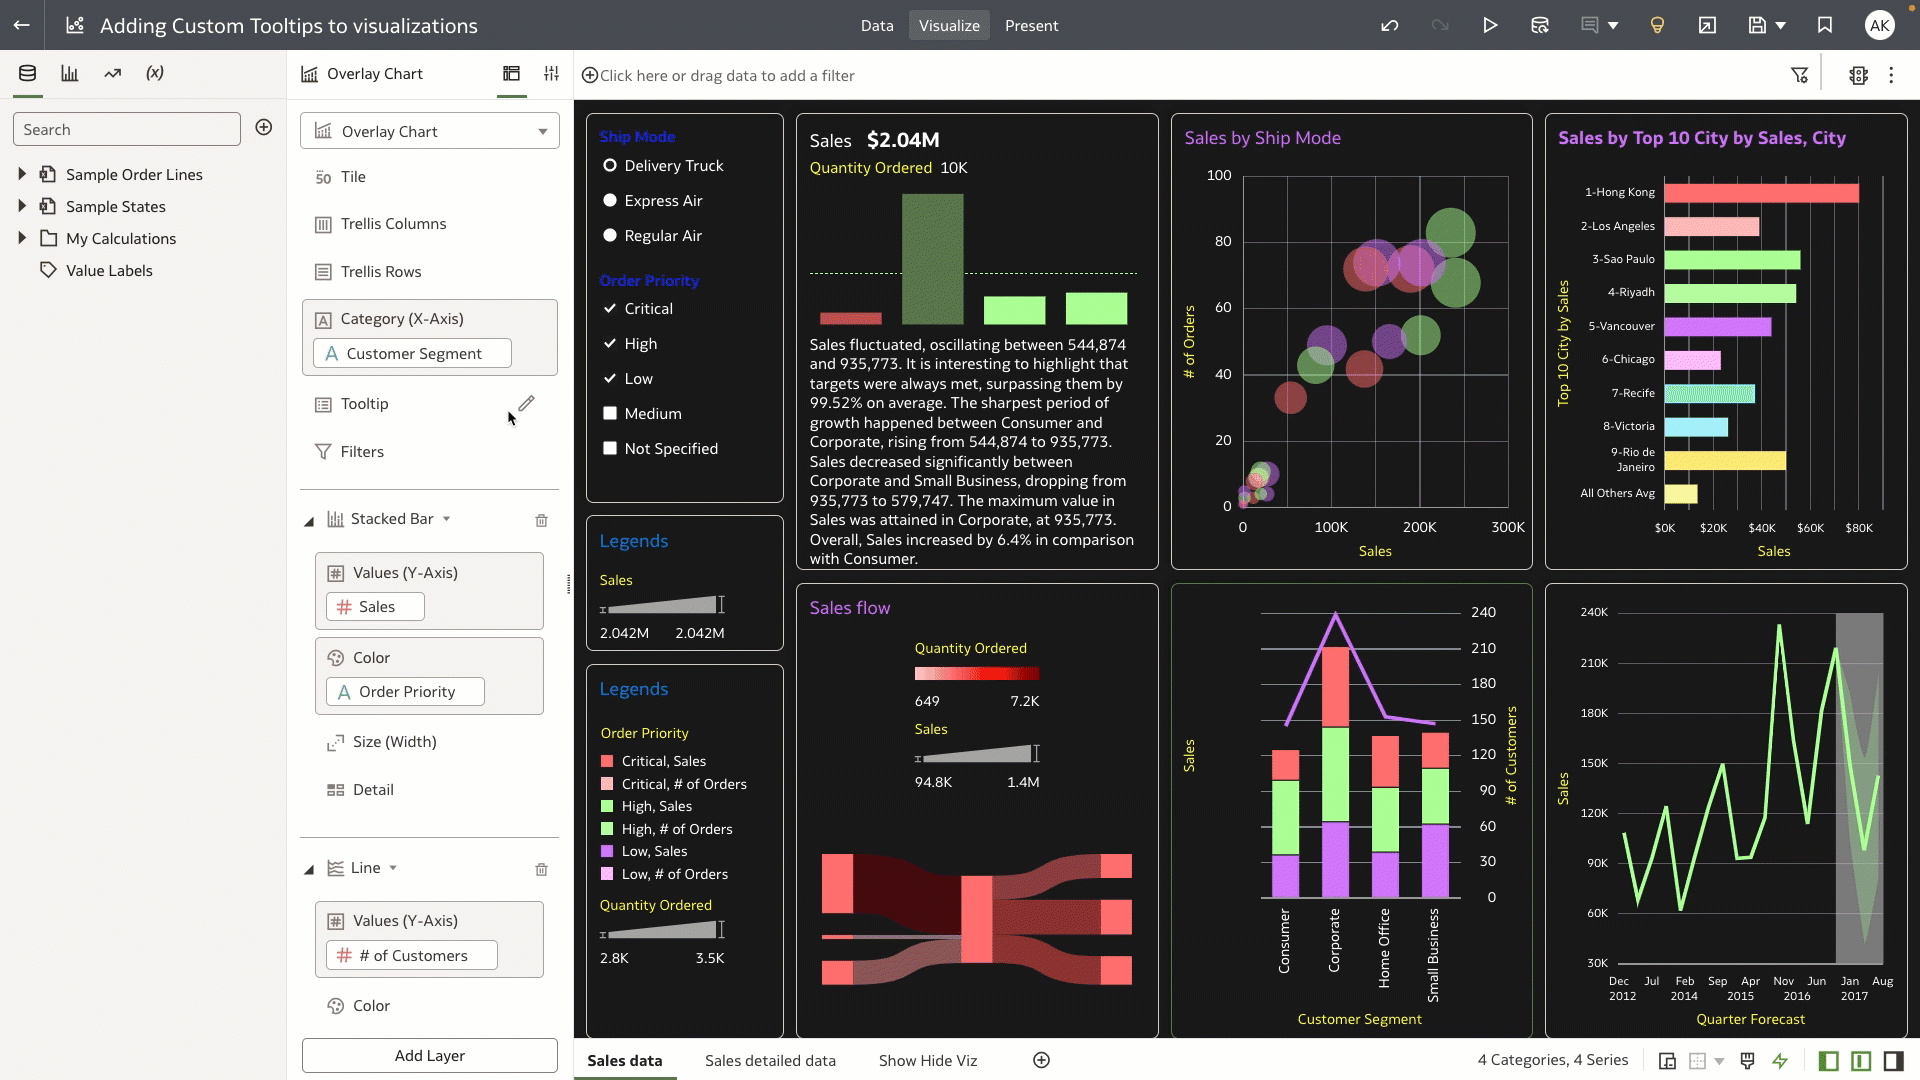
- Customizable themes applied in one click to easily format colours across a canvas (see Figure 6).
- Custom tooltips enabling authors to provide additional context and insights to consumers (see figure 7).
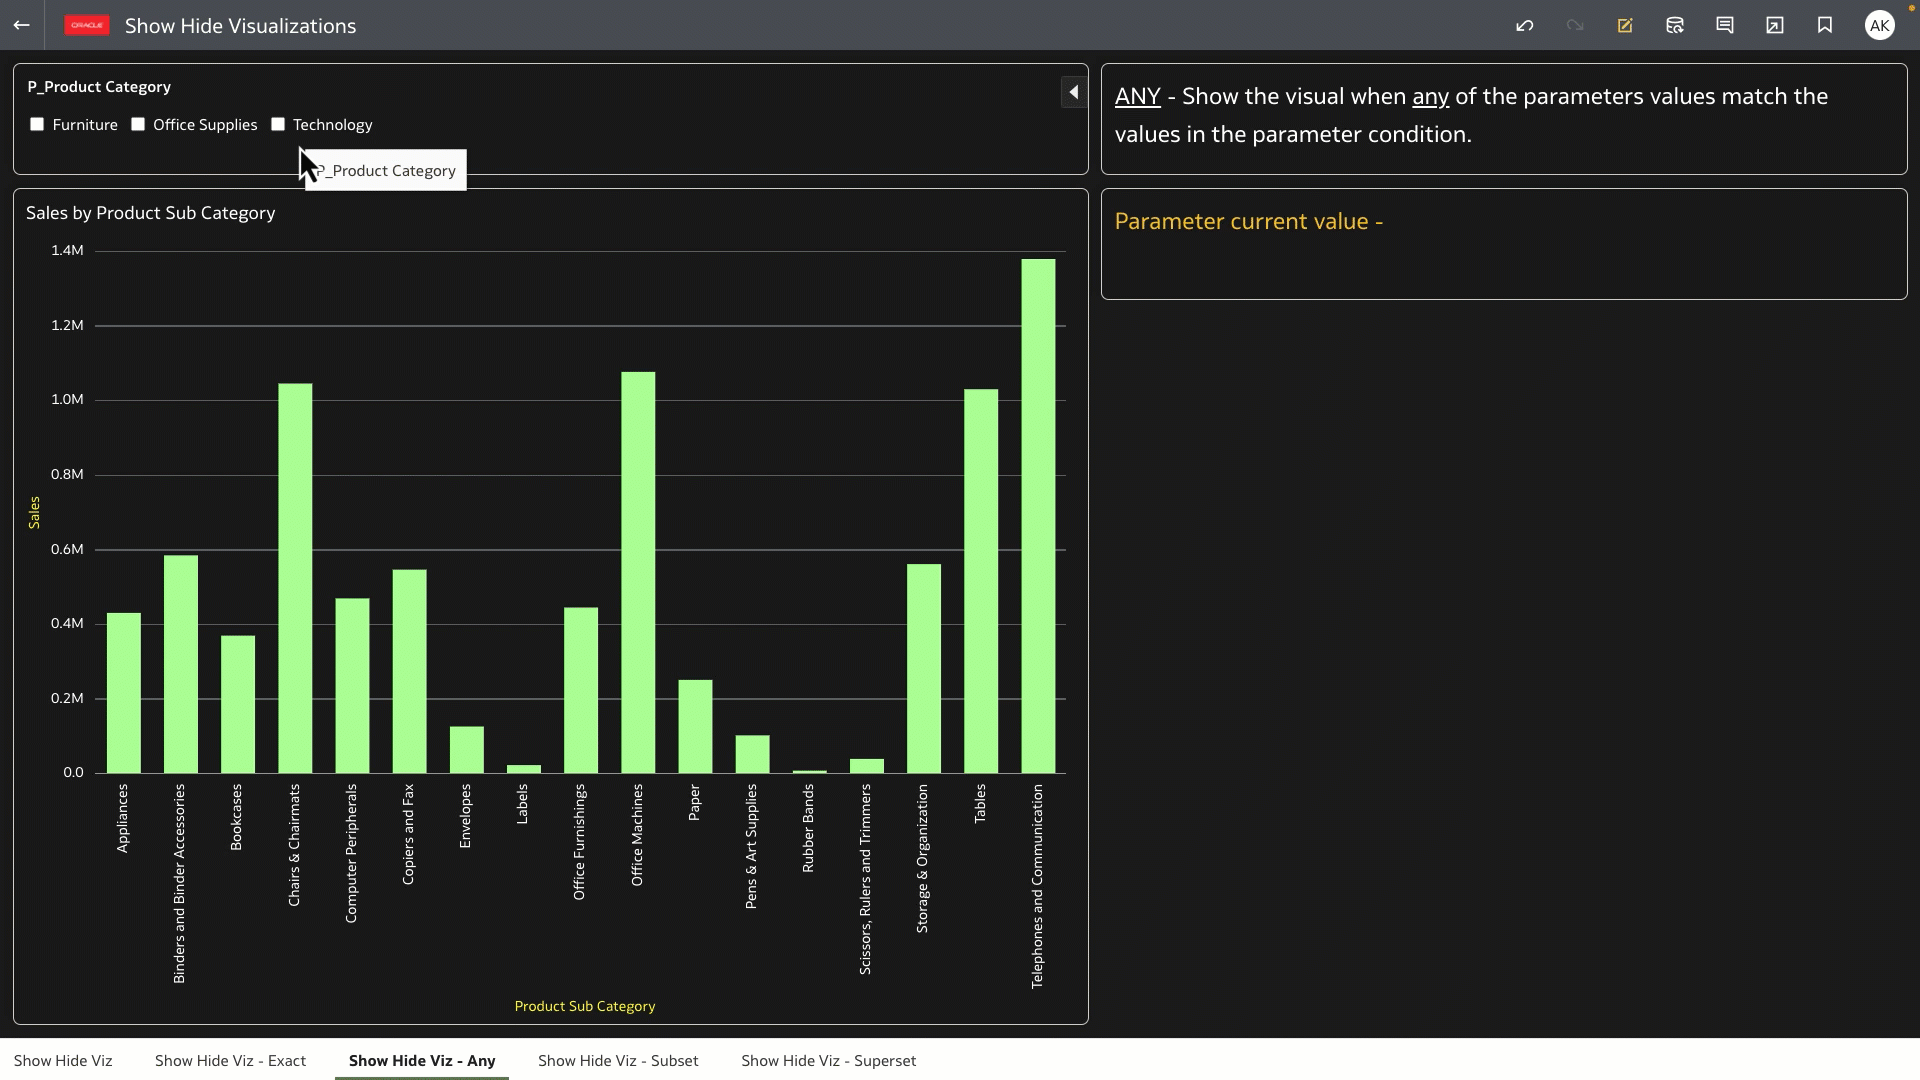
- Hidden visualizations enabling adaptable dashboard design responsive to consumer-set values (see figure 8).
- Customizable dashboard filter controls further expanding the filter design-options border selection.
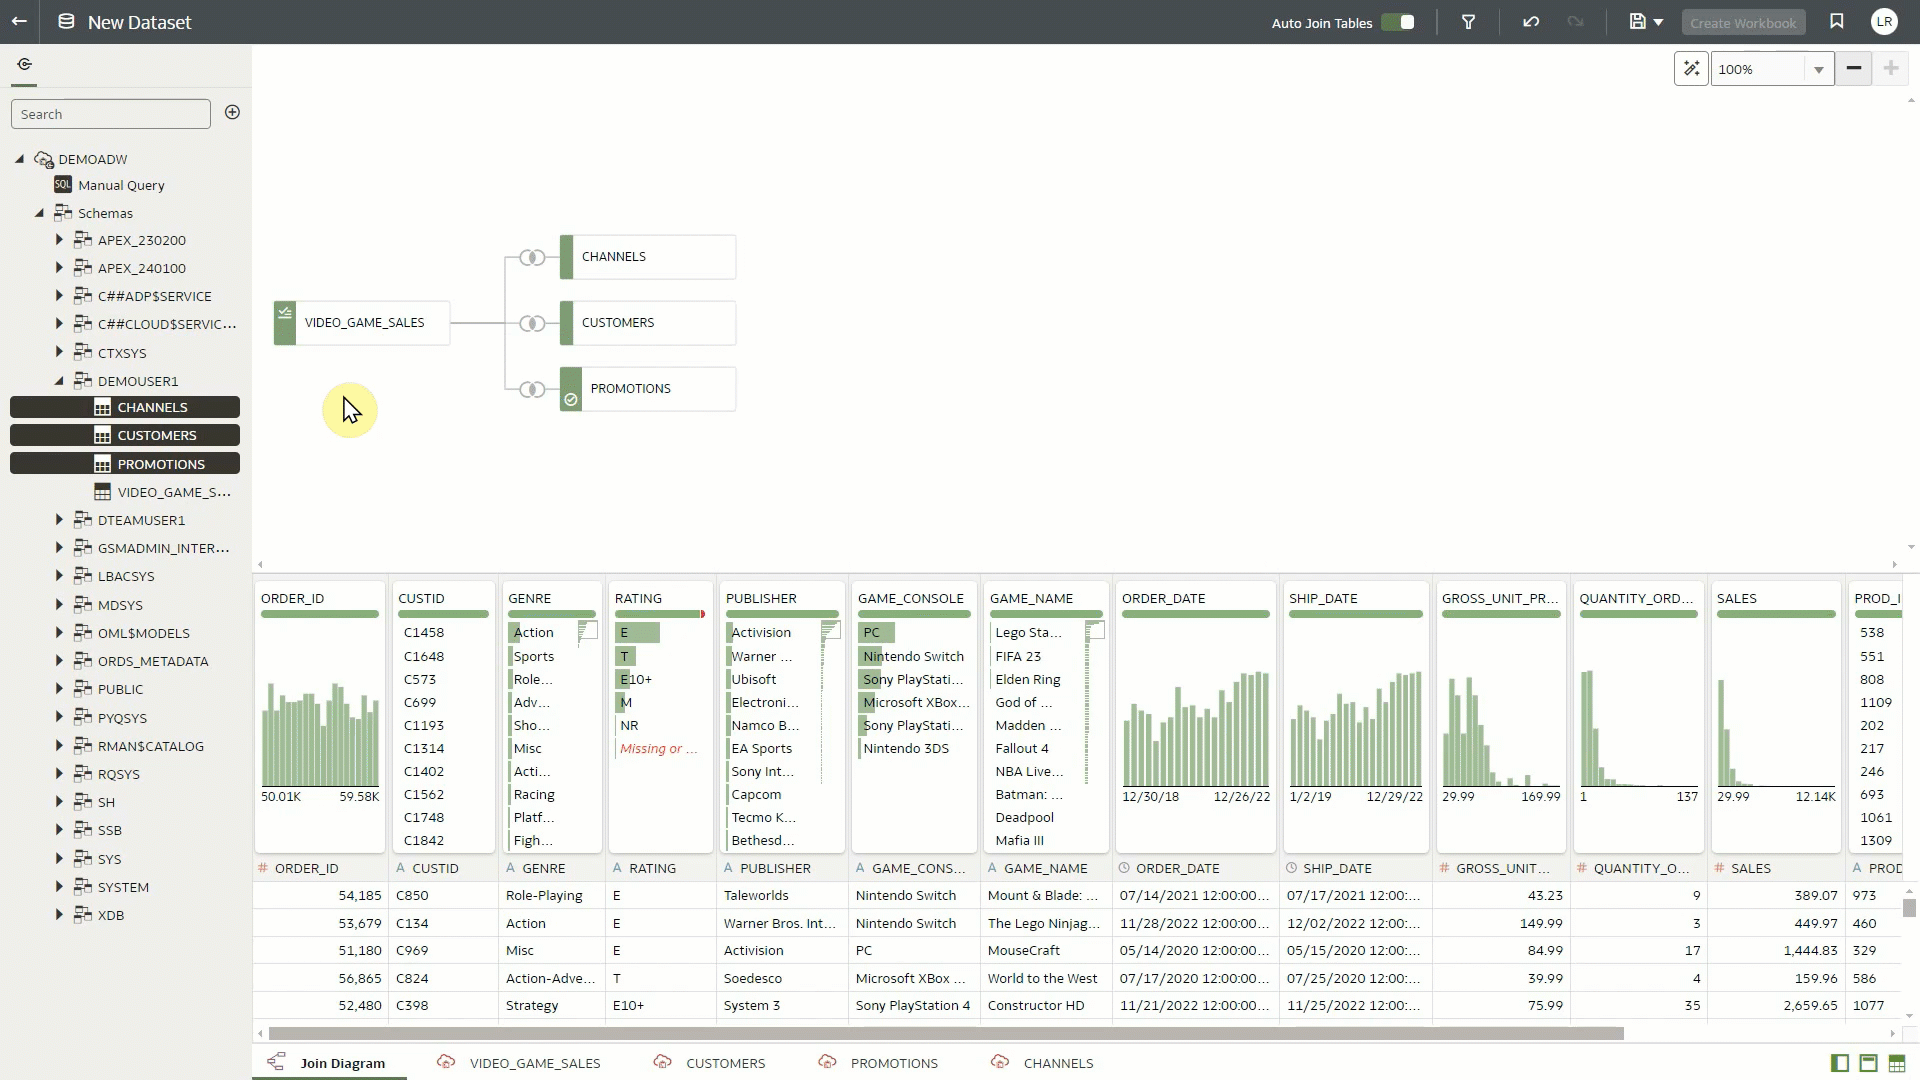
Designing datasets has also become easier with the enhanced Join Diagram editor. In this release the grid layout was replaced with free-form node placement, allowing authors to arrange the nodes with total flexibility. New node icons and customizable tooltips also add to the information authors can obtain directly from the editor view, without having to navigate to the edit definitions screen.
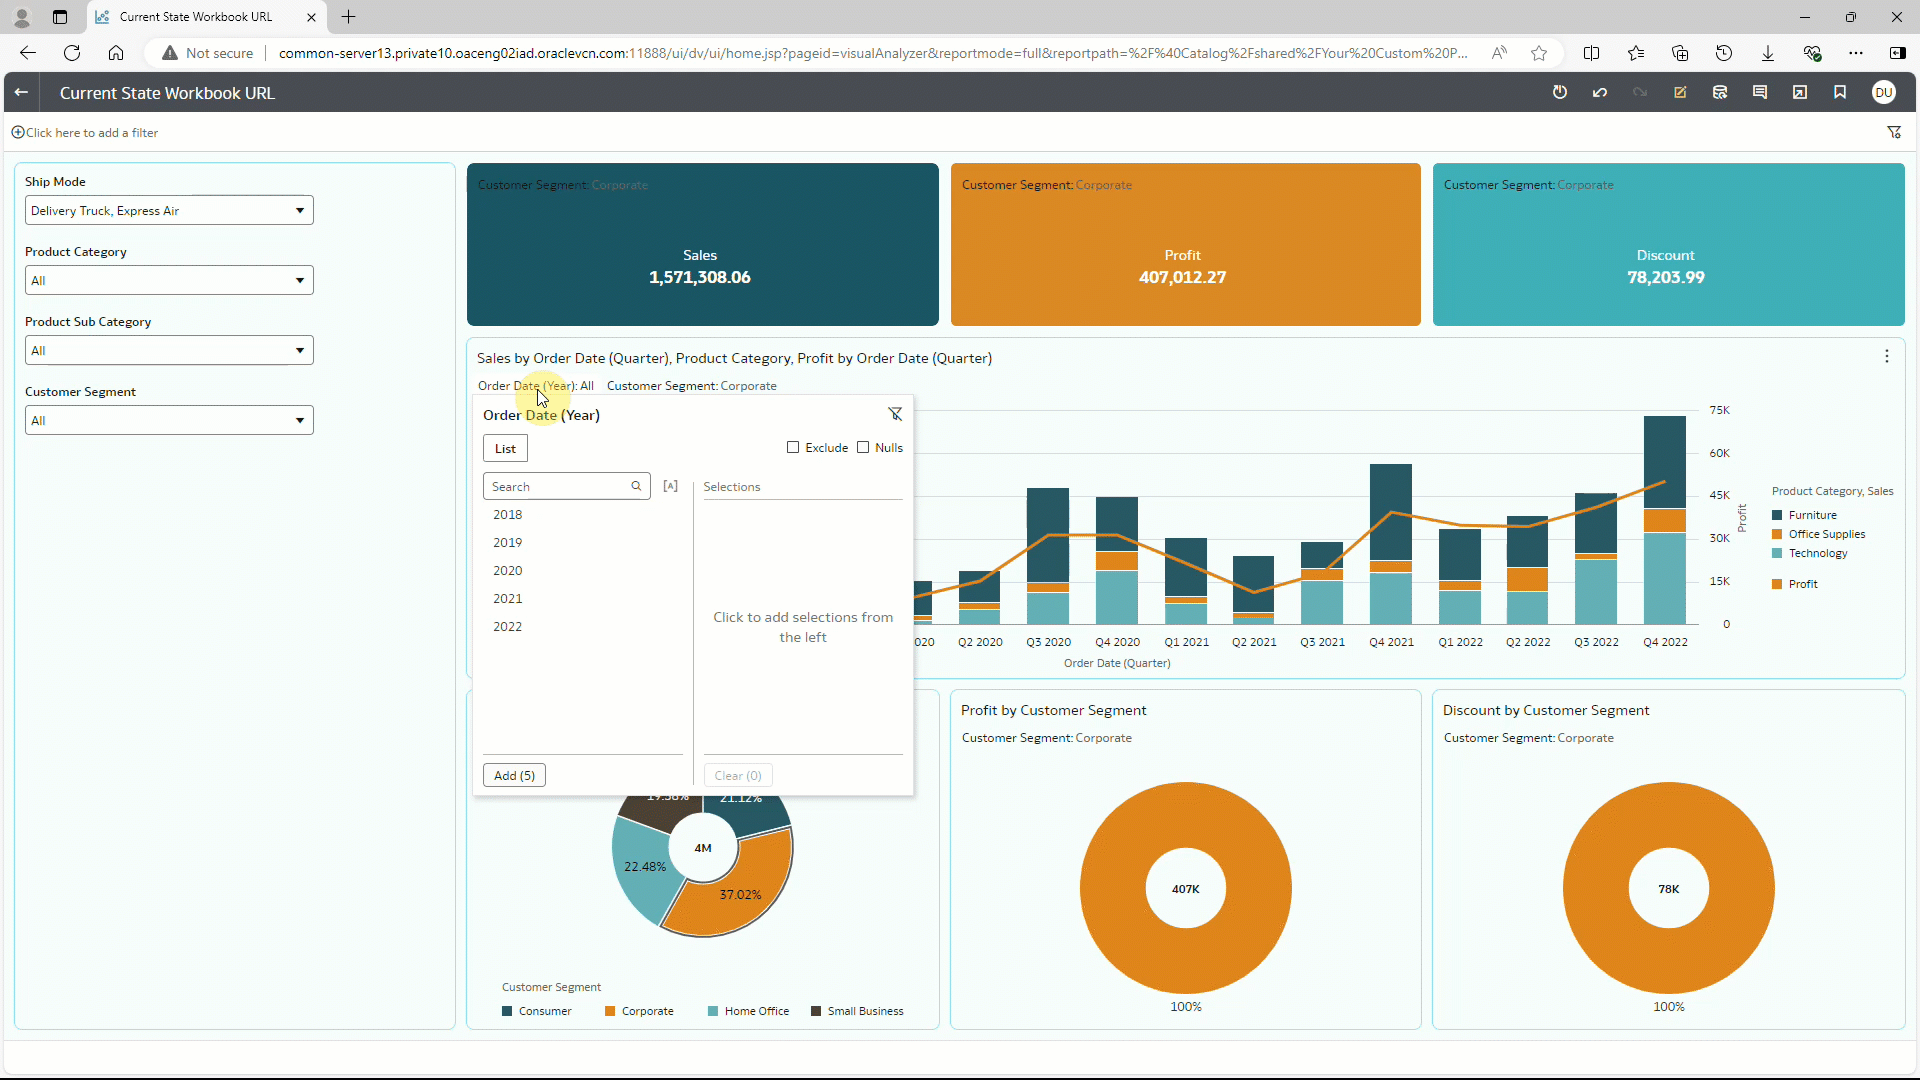
Finally, dashboard sharing URLs are now enabled for persisted filters. At the point of export, users simply select “Current State” under “Apply State” to capture any dashboard, visualization or user filters present in the workbook at that time.
Data Connectivity, Modelling and Preparation
The November 2024 update enables administrators to connect to remote Databricks data sources. Leveraging a customer-supplied driver and the Remote Data Gateway, this self-service connection allows administrators to configure and save the connection, enabling the creation of datasets within Oracle Analytics Cloud from Databricks data sources.

Administration
With November’s addition of custom groups, layouts and themes, fine-grained permissions for managing these features are now available. Administrators can switch the layouts and themes on their instance between “Read-Only” or “Read-Write”, determining which are available for editing by users. Individuals can also be given permission to update a shared theme or layout.
Oracle Analytics administrators can now switch their Oracle Analytics Cloud environment update cycle from the default ‘Regular’ setting, to an ‘Early’ schedule. This allows administrators to designate certain environments to receive updates as soon as possible, delivering new ways to explore enhancements early or stagger updates across the environments.
Note – starting November 4th, Oracle Support no longer processes requests to reschedule software updates. See Can I postpone or reschedule service updates?
Key Takeaways
The November 2024 update of Oracle Analytics Cloud provides an enhanced experience that is intuitive, streamlined, and customizable. With an improved Catalog, quickly applied dashboard themes and layouts, expanded connectivity, and ever-increasing fine-grained permissions, OAC continues to deliver advanced analytics that help organizations make more informed decisions and take action based on data and insight.
For more information: