
Data Lineage is now available as a Preview feature in Oracle AI Data Platform. Data Lineage provides a visual way to understand how data artifacts are related through notebook and workflow executions, including their upstream sources, downstream consumers, and column-level derivations.
This Preview release focuses on data engineering lineage for supported Oracle AI Data Platform artifacts. This article explains the capabilities available today, shows how to explore entity and column relationships, and describes how impact analysis can help you understand dependencies before making a change.
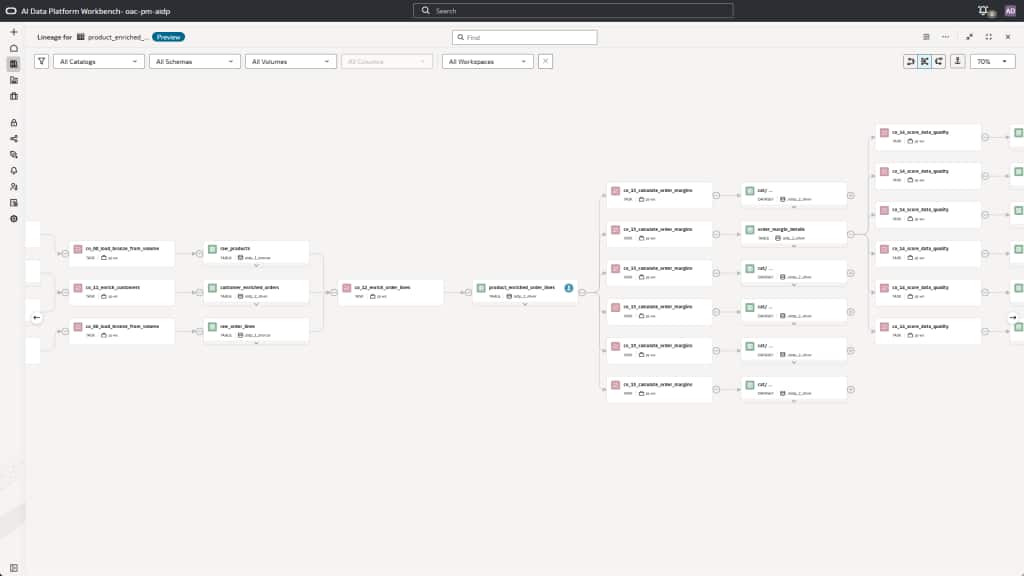
Data Lineage graph centered on the selected anchor table.
Understand how data moves through the platform
Data Lineage helps data engineers, data stewards, and other users understand the path that data takes through Oracle AI Data Platform. Lineage metadata is captured automatically from notebook and workflow executions. The resulting graph connects upstream sources, downstream consumers, and the processes that transform data between them.
With Data Lineage, you can:
- Start from a data artifact in the Master Catalog and open its lineage graph.
- Explore the full graph or focus on upstream or downstream relationships.
- Trace how individual columns are derived, transformed, or propagated.
- Inspect details for tables, volumes, notebooks, tasks, and workflows.
- Review source to target mappings and transformation types.
- Perform upstream and downstream impact analysis.
- Search, filter, and adjust the depth of the lineage graph.
- Share a lineage view through a link or export the current view as a PNG image.
Start from the Master Catalog
You can launch Lineage from a data artifact in the Master Catalog. Navigate to a table, right-click the artifact, and select Lineage. You can also open the artifact and select Actions > Lineage.
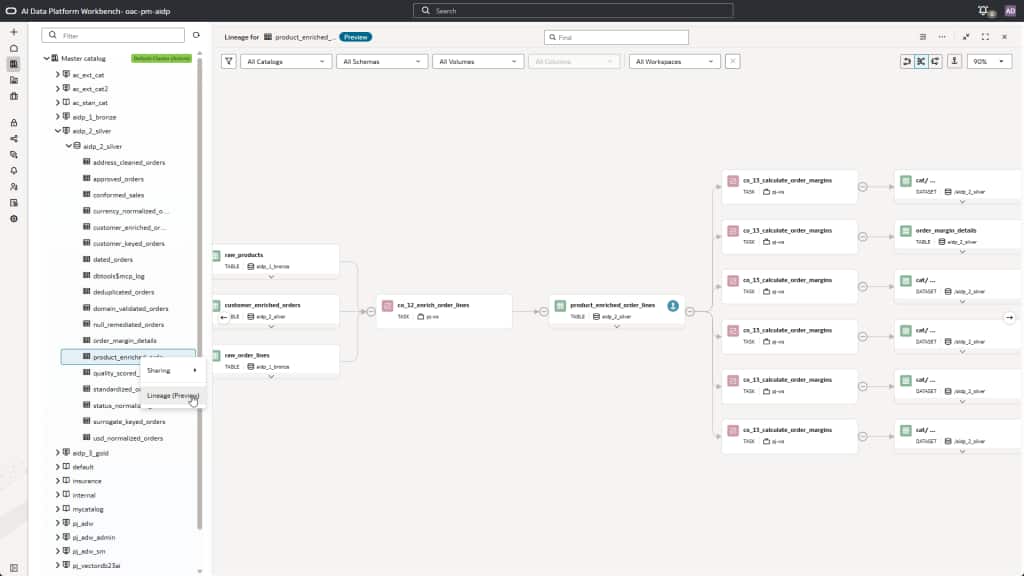
Open Data Lineage directly from a table in the Master Catalog.
The artifact you start from becomes the anchor node. The graph opens around that anchor, showing upstream artifacts to the left and downstream artifacts to the right. This gives you an immediate view of where the data came from and where it is used.
You can switch between the full graph, an upstream-only view, or a downstream-only view depending on the question you are trying to answer. You can also set another table as the anchor to recenter the graph and continue exploring from a different point.
Navigate larger lineage graphs
As data moves through more notebooks, tasks and tables, lineage graphs can become more complex. Navigation controls help you focus on the parts of the graph that are relevant to your investigation.
Use Find to locate an artifact or process node and center the graph on the selected result. Use filters to narrow the visible graph by catalog, schema, volume, column or workspace. You can also change the upstream and downstream depth in Lineage Settings to either narrow the view or reveal more levels around the anchor.
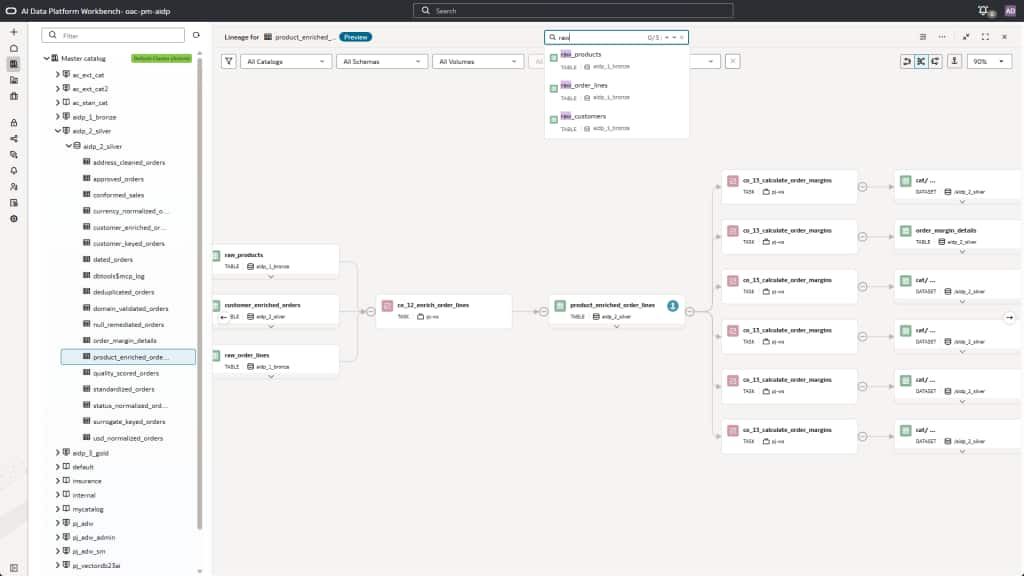
Use Find to locate a data or process artifact in a larger lineage graph.
These controls are useful when you are investigating a specific pipeline, reviewing a production change, or trying to locate the process that produced a downstream data artifact.
Trace column-level lineage
Entity lineage answers which datasets and processes participate in producing a target. Column lineage answers a more specific question: Which source columns supplied or contributed to the values in a target column?
Expand a table or volume in the lineage graph to see its columns. The graph displays column relationships between supported source and target artifacts. Double-click a column to highlight its path across the graph. You can select multiple columns to compare their paths and understand how related values move through the pipeline.
Column lineage can show whether a field was copied without change, aggregated from multiple records, or transformed using functions, casts, concatenation, or other expressions. Oracle AI Data Platform categorizes these relationships as IDENTITY, AGGREGATION, or TRANSFORMATION.
Entity and column lineage can differ for the same pipeline. For example, one table might provide the values written to a target while another table is used only to filter which rows qualify. Both tables participate in entity lineage because the target depends on both. Column lineage can show only the table that supplied the target values. This distinction helps separate dependency lineage from value provenance.
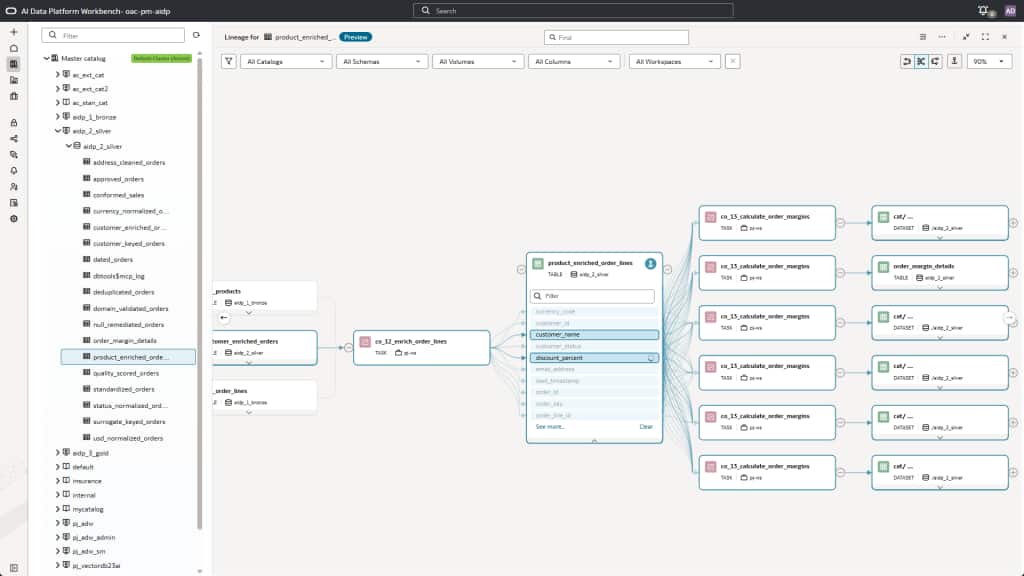
Select one or more columns to highlight their paths across the lineage graph.
Inspect data and process details
The lineage graph includes both data artifacts and process artifacts. Select a table or volume to review details such as its catalog, schema, format, last updated time, columns, and upstream and downstream counts. An asset link takes you back to the artifact in the workspace when you need to review additional metadata or permissions.
Select a process artifact, such as a notebook or workflow task, to see execution information. Depending on the artifact, the details include the job and task status, duration, task type, notebook or job identifiers, and the compute cluster used for the execution.
The process details also show source and target artifacts, source and target columns, and the associated transformation type. This combines operational context with transformation context, making it easier to understand not only which process moved the data, but also what the process did.
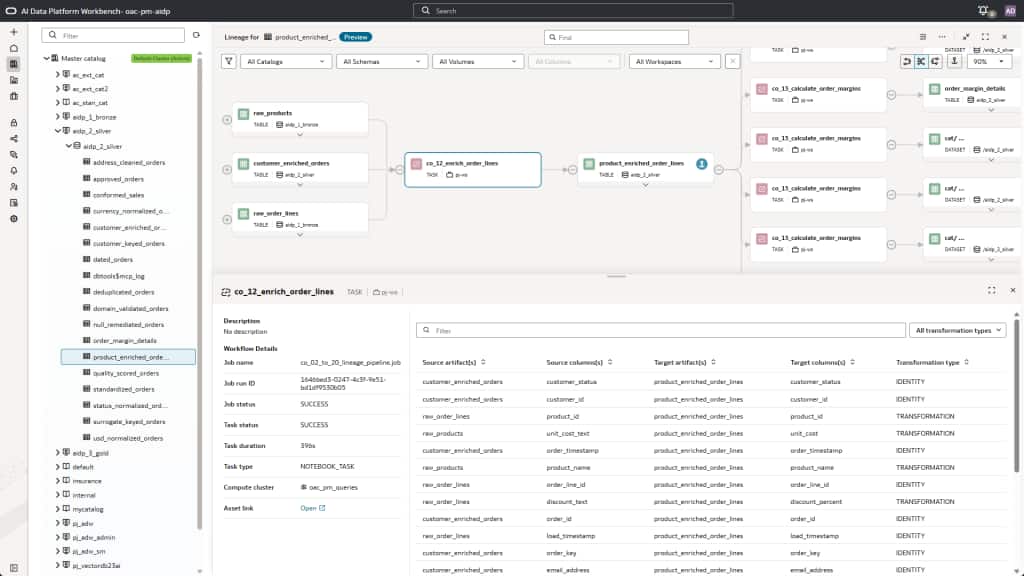
Process details combine execution context with source-to-target transformation mappings.
Assess the impact of a change
Understanding where data came from is one side of lineage. Before changing a table or pipeline, you also need to understand what depends on it. The Impact Analysis tab lists upstream and downstream artifacts related to the anchor data artifact.
Use upstream impact analysis to understand the sources and processes that contribute to the selected artifact. Use downstream impact analysis to identify the consumers that might be affected by a schema, transformation, or data change.
You can search the impact list, filter by artifact type or direction, and export upstream, downstream, or all related artifacts as a CSV file. This creates a practical starting point for change reviews, incident analysis, and coordination with the teams that own affected downstream assets.
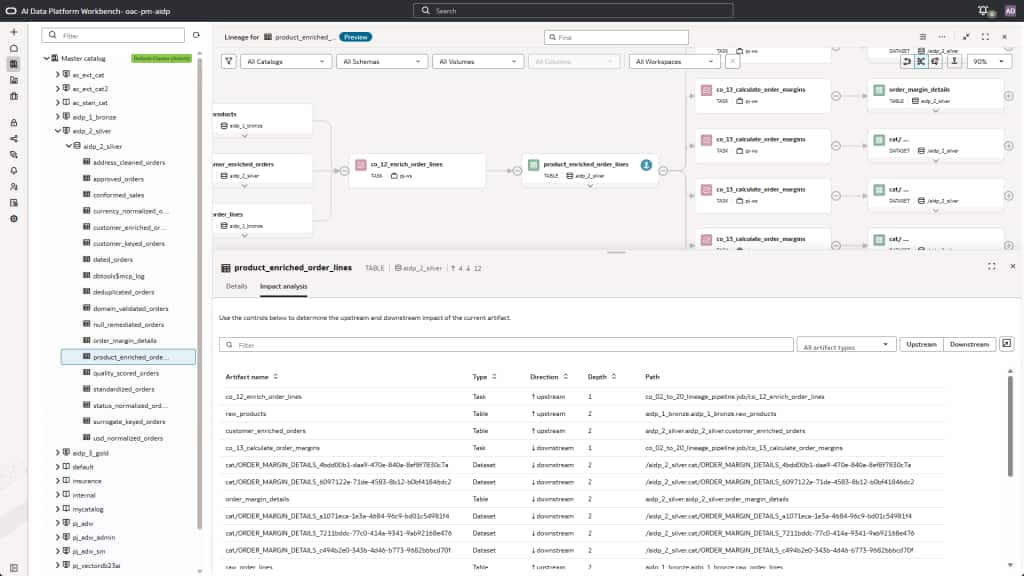
Impact Analysis lists upstream and downstream dependencies for the selected artifact.
Share the lineage view
Lineage is often most useful when it can be shared with another engineer, data steward, or application owner.
From the Actions menu, copy a link to the lineage view or export the current graph as a PNG image. The PNG export includes the current rendered view and any filters you applied.
Lineage capture is enabled by default
Lineage metadata is captured by the compute used to run a notebook or workflow task. Capture is enabled by default for newly created computes and is managed independently for each compute.
If a compute was created before lineage became available, restart it before running the notebook or workflow task. To disable or re-enable capture, edit the compute, open Advanced options, and set spark.aidp.lineage.enabled to false or true in the Spark configuration. Changing this setting on one compute does not affect notebooks or workflow tasks running on other computes.
Get started with Data Lineage
Data Lineage brings graph exploration, column-level provenance, process execution details, transformation mappings, and impact analysis together in Oracle AI Data Platform. These capabilities help teams understand where data came from, how it changed, and what might be affected downstream.
To get started, open a table in the Master Catalog and select Actions >Lineage. Explore the upstream and downstream relationships created by your notebooks and workflow tasks, and use Impact Analysis to understand dependencies before making a change.
Learn more