Unlocking What-If Analysis with OCI ADS
Static forecasts rarely survive real-world volatility. Promotions shift, weather surprises, supply stalls and business partners want to know right now how those changes ripple through revenue, inventory, or staffing. Instead of re-running entire pipelines for every “what if,” modern teams need a loop where trained models stay live, inputs flex instantly, and decision-makers see the impact before the moment passes.
The ADS (Accelerated Data Science) Forecasting Operator delivers that agility by baking “what-if” analysis directly into the machine learning pipeline. In this post we walk through the feature’s architecture, configuration surface, and operational flow so you can deploy it in your own OCI Data Science environments with confidence.
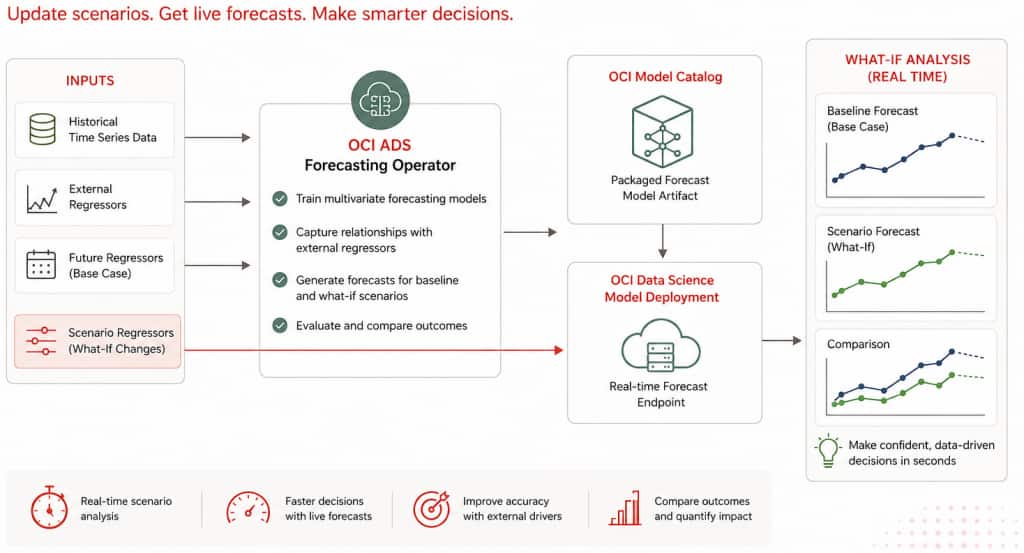
Oracle Cloud Infrastructure (OCI) Accelerated Data Science (ADS) now brings real-time What-If Analysis to its Forecasting Operator. In a single low-code workflow you can:
- Equip planners with instant scenario testing on top of their existing ADS forecasts.
- Train multivariate forecasts that combine historical targets with external regressors.
- Package those trained models automatically into the OCI Model Catalog.
- Stand up an operational endpoint that accepts new scenario (exogenous features) data and returns updated forecasts within seconds.
Scenario Planning 101: From Spreadsheet Tweaks to Operational Intelligence
- Traditional What-If: Analysts copy spreadsheets, tweak a few cells, and pray the formulas hold.
- Modern Approach: Treat the forecasting model as a service. Hold a single source of truth, feed it revised assumptions, and capture each scenario with full lineage.
- Why it Matters: Research in supply-chain and retail forecasting shows that continuous scenario evaluation improves accuracy, reduces stock-outs, and builds trust in analytics programs.
Stakeholder Impact
- Demand Planners explore pricing or promotion shifts without rerunning training pipelines.
- Operations Teams gauge inventory requirements when supply conditions change overnight.
- Executives receive defensible, data-backed explanations for each strategic adjustment.
- Data Scientists stay focused on model quality instead of ad-hoc retooling.
How ADS Changes the Game
Conventional forecasting pipelines retrain or fine-tune models whenever assumptions change, which is brittle and slow. ADS separates training from scenario simulation so models stay live while scenarios churn quickly:
- Train multivariate forecasts that blend historical targets with external regressors (for example, promotions, weather, macro drivers).
- Persist each trained model one per time-series segment into the OCI Model Catalog.
- Stand up a real-time endpoint that reuses those trained models.
- Feed revised regressors to the endpoint by uploading a new additional_data.csv with adjusted values and instantly observe updated projections.
Oracle’s Accelerated Data Science Forecasting Operator automates the entire flow: training multivariate models, packaging them into the OCI Model Catalog, standing up a fully managed endpoint, and letting teams replay the future by simply uploading revised external regressors.
The result is a unified workflow where forecasting and scenario planning live side-by-side: data scientists focus on model quality, while planners and analysts iterate on business hypotheses as soon as the model is trained.
Workflow at a Glance
- Data preparation
- Historical dataset: timestamps + target metric (for example, daily sales per product).
- Additional dataset: the same timestamps plus future values of drivers such as promotions, weather, or macroeconomic indicators.
- Optional test dataset for model backtesting.
- Operator configuration
- Define a what_if_analysis block in the YAML spec to enable model packaging and (optionally) automatic deployment.
- Set deployment parameters such as display name, shape, logging, and auto-scaling thresholds.
- Declare project OCID, compartment, deployment metadata, logging, and auto-scaling preferences.
- Execution
- Run
ads operator run -f forecast.yaml. - ADS trains the forecast model, serializes the model artifacts, performs sanity checks, and saves the model bundle to the OCI Model Catalog.
- ADS serializes per-series models and sanity-tests them.
- If
model_deploymentis configured, ADS creates a Model Deployment with logging and auto scaling settings. - The run produces
deployment_info.json, which captures deployment metadata such as model OCID, deployment OCID, endpoint URL, work request, series information, and logging metadata.
- Run
- Scenario testing
- Update additional_data.csv, edit the regressors to reflect the scenario, and upload the file to Object Storage.
- POST the file location to the deployment endpoint.
- Predictions return as JSON arrays per series, ready for dashboards, notebooks, or planning tools.
- Compare the returned forecast against the baseline to quantify impact.
| Phase | What Happens | Typical Outcome |
|---|---|---|
| Operator Run | Train models, serialize artifacts, publish to Model Catalog | Versioned model bundle per time-series segment |
| Deployment Provisioning | ADS invokes Data Science APIs, sets up logging, applies fixed or threshold-based scaling | Live endpoint with predictable capacity |
| Scenario Upload | Analysts edit additional_data.csv, upload new values to Object Storage | “Scenario A/B” datasets captured alongside baseline |
| Scenario Invocation | POST {"additional_data": {"url": "<path>"}} to the endpoint | JSON forecast per series and horizon |
| Business Review | Compare baseline vs. scenario, export to dashboards or planning tools | Decisions grounded in quantified impact |
Dataset Snapshot and What-If Scenarios
There are two primary types of datasets involved in this process.
Historical Data
This file contains the historical time series data. This file remains unchanged during What-If Analysis, as the external regressor factors are manipulated in a separate file.
Historical data example:
Series_ID,Date,Sales
1,2023-01-01,200
1,2023-01-02,220
1,2023-01-03,210
1,2023-01-04,230
1,2023-01-05,180
1,2023-01-06,175
1,2023-01-07,190
1,2023-01-08,205
1,2023-01-09,250
1,2023-01-10,240
1,2023-01-11,255
1,2023-01-12,260
1,2023-01-13,270
1,2023-01-14,275
1,2023-01-15,265
Additional Data
This file contains external regressors such as promotions, temperature, and holidays, which can be modified for What-If Analysis.
Additional data example:
Series_ID,Date,Temperature,Holiday,Promotion
1,2023-01-01,30,0,0
1,2023-01-02,35,0,10
1,2023-01-03,34,0,0
1,2023-01-04,36,0,15
1,2023-01-05,28,1,50
1,2023-01-06,25,0,0
1,2023-01-07,29,0,20
1,2023-01-08,32,0,0
1,2023-01-09,40,0,0
1,2023-01-10,38,0,0
1,2023-01-11,42,1,30
1,2023-01-12,41,0,0
1,2023-01-13,45,0,25
1,2023-01-14,46,0,0
1,2023-01-15,44,1,75
1,2023-01-16,46,0,0
1,2023-01-17,44,1,75
Assume the forecast horizon is 2 and the forecast generated from the data above is:
{'prediction': '{"1": "[301.32, 279.85]"}'}Example What-If Scenario A
Series_ID,Date,Temperature,Holiday,Promotion
1,2023-01-16,46,0,60
1,2023-01-17,44,1,80
Example What-If Scenario B
Series_ID,Date,Temperature,Holiday,Promotion
1,2023-01-16,46,0,0
1,2023-01-17,44,1,0
In Scenario A, the future promotion values are increased for the forecast horizon. In Scenario B, the future promotion values are set to zero. The endpoint can be called with each modified additional_data.csv file to observe how the forecast changes against the base forecast.
This is the same pattern a retail planning team can use to compare different promotion strategies. For example, one scenario might increase promotional spend across flagship stores, while another shifts budget to targeted digital campaigns. The returned forecasts help teams compare predicted revenue curves, evaluate whether the investment meets revenue targets, and repeat with alternative mixes.
Because the endpoint supports rapid iterations, planners can evaluate multiple strategies in a single session, and the data science team no longer needs to orchestrate ad-hoc retraining jobs. Because the operator stores every scenario input, analysts can audit prior assumptions and build a library of stress tests.
Submit the Scenario to the Endpoint
After creating a scenario file, upload the modified `additional_data.csv` to Object Storage and submit its URI to the model deployment endpoint.
import requests
import oci

payload = {
    "additional_data": {
        "url": "oci://my_bucket@my_namespace/scenarios/additional_data_promo_push.csv"
    }
}

auth = oci.auth.signers.get_resource_principals_signer()
response = requests.post(model_deployment_endpoint, json=payload, auth=auth)
print(response.json())
The response returns the updated forecast for each series. For a single series with Series_ID = 1, the response can look like this:
{'prediction': '{"1": "[456.87, 423.15]"}'}Compare this response with the baseline forecast to quantify the effect of the changed regressors. For example, Scenario A can show the impact of increased promotion values, while Scenario B can show the effect of removing promotions for the same forecast horizon.
Scenario Analysis vs. Sensitivity Analysis
What-If Analysis can support both scenario analysis and sensitivity analysis.
Scenario analysis tests a realistic business situation by changing multiple assumptions together. For example, a retail planner might increase promotion spend, adjust holiday flags, and update expected temperature for the same forecast horizon. This answers questions like: “What happens if we run a promotion during a holiday period under expected weather conditions?”
Sensitivity analysis isolates one driver at a time while keeping the other inputs unchanged. For example, a planner might change only the `Promotion` values while leaving `Temperature` and `Holiday` unchanged. This answers questions like: “How sensitive is the forecast to promotion changes?”
In the sample data above, Scenario A and Scenario B both modify future promotion values:
Scenario A increases promotion values for the forecast horizon.
Scenario B sets promotion values to zero.
If only the Promotion column changes while Temperature and Holiday stay fixed, the comparison behaves like sensitivity analysis for promotions. If promotion, holiday, temperature, or other drivers change together to represent a realistic business plan, the comparison becomes scenario analysis.
ADS supports both patterns because the endpoint accepts revised additional_data.csv files. Teams can change a single column to measure sensitivity, or change multiple columns together to evaluate a complete business scenario.
Configuration Guide
A representative YAML configuration looks like this:
kind: operator
type: forecast
version: v1

spec:
  datetime_column:
    name: Date
    format: "%Y-%m-%d"

  historical_data:
    url: oci://analytics_bucket@namespace/sales_history.csv

  additional_data:
    url: oci://analytics_bucket@namespace/sales_additional.csv

  target_category_columns:
    - Series_ID

  target_column: Sales
  horizon: 8
  model: prophet

  what_if_analysis:
    project_id: ocid1.datascienceproject.oc1..example
    compartment_id: ocid1.compartment.oc1..example
    model_display_name: retail_revenue_forecast

    model_deployment:
      display_name: retail-what-if
      initial_shape: VM.Standard2.1
      description: "Real-time scenario testing for merchandising"
      log_group: ocid1.loggroup.oc1..example

      auto_scaling:
        minimum_instance: 1
        maximum_instance: 4
        cool_down_in_seconds: 600
        scaling_metric: CPU_UTILIZATION
        scale_in_threshold: 20
        scale_out_threshold: 70
Key tips:
additional_datamust extend beyond the forecast horizon, share the datetime column, and include the same category keys as historical data. ADS enforces this to ensure simulations remain realistic.- If you omit
model_deployment, ADS still stores the model bundle and writesdeployment_info.jsonwith the catalog OCID. You can then deploy manually via UI or API. - Provide the
model_deploymentblock when you want ADS to provision the endpoint automatically during the run.
The complete YAML structure can be found here
Putting It All Together
Real-time What-If Analysis elevates forecasting from a static report to an always-on decision engine. Train once, open the loop, and every “what happens if…?” conversation becomes a quantifiable, auditable scenario instead of a guess.
The OCI ADS Forecasting Operator makes this agility table stakes: a declarative YAML spec toggles What-If Analysis without bespoke infrastructure, model packaging and deployment run automatically on native OCI services, analysts keep working with familiar CSVs while getting low-latency forecasts, and the system records logs plus metadata for enterprise-grade observability.
The result is a closed loop between data science and decision-making—the gap from model to business outcome shrinks to a single operator run, precisely when speed matters most.
Explore OCI Data Science
Ready to learn more about the Oracle Cloud Infrastructure Data Science service?
- Configure your OCI tenancy with these setup instructions and start using OCI Data Science.
- Star and clone our new GitHub repo! We’ve included notebook tutorials and code samples.
- Visit our service documentation
- Watch our tutorials on our YouTube playlist
- Subscribe to our Twitter feed
- Visit the Oracle Accelerated Data Science Python SDK documentation
- See another end-to-end forecasting example in the bike-sharing demand forecasting blog
- Try one of our LiveLabs. Search for data science.