



Introduction
Enterprise AI is moving from simple chat experiences to production workflows. A user may ask one question, but behind that response the system may perform multiple model calls, apply guardrails, invoke tools, call enterprise APIs, retrieve context, and generate a final answer.
For business users, the experience should feel simple. For enterprise teams, the execution path must be visible: what happened, how long it took, what it cost, and whether it followed expected policy and quality standards.
This is where Langfuse becomes valuable. It provides tracing, observability, evaluation, and cost visibility for AI applications. In Enterprise AI, it becomes an operating layer for making systems traceable, measurable, and improvable.
In our Enterprise AI implementation, Langfuse was used with an OCI-aligned architecture where AI workflows use OCI Generative AI, integrate with enterprise tools and APIs, and rely on secure configuration through OCI Vault. Langfuse was deployed in two practical patterns: on a VM for a simpler self-hosted setup and on Oracle Kubernetes Engine (OKE) for a Kubernetes-based deployment model.
The goal is simple: make Enterprise AI execution visible, trustworthy, and production-ready.
Why Enterprise AI Needs Langfuse
Traditional logs are useful, but they are not enough for AI systems. They show service activity and errors, but not the full AI decision path.
In an AI workflow, a model may choose a tool, a prompt may influence routing, a tool may return partial data, or a retry may increase latency and cost. Even when the answer looks correct, teams must know whether the right context and path were used.
Without structured AI observability, enterprise teams face limited traceability across model calls and tools, hidden token and cost growth, difficulty identifying which prompt or step caused a bad answer, weak evaluation loops, and governance gaps around metadata, user context, and outputs.
Langfuse addresses these issues by turning AI execution into a structured operational record. It captures traces, observations, metadata, latency, token usage, cost, scores, and datasets that teams can inspect and improve over time.
One Request One Trace
A key design principle for Enterprise AI observability is:
**One user request should map to one Langfuse trace.**
A trace represents the full lifecycle of a user request. Observations capture model calls, tool calls, retrieval steps, routing decisions, or downstream actions.
In our implementation, Langfuse tracing uses a consistent root trace identity and propagates trace context through the AI workflow, including trace URLs, metadata, environment tags, callback handlers, and parent span propagation.
Enterprise AI workflows are rarely flat. Langfuse makes nested execution visible as a trace tree instead of forcing teams to reconstruct it from scattered logs. A useful trace shows which model, prompt or workflow version, tool, latency point, token count, estimated cost, and environment were involved.
Cost, Latency, Tokens, and Evaluation
Cost control is one of the most practical reasons to use Langfuse. A single answer can include hidden planning, routing, tool, summarization, retry, or evaluation calls. Without observation-level usage tracking, teams miss the real cost profile.
Both usage details and cost details can be either
- Ingested via API, SDKs or integrations
- Or inferred based on the model parameter of the generation.
Our implementation includes Langfuse Metrics API presets to measure request count, average latency, total generation cost, token usage, daily request trends, observation breakdowns, environment-specific request counts, and cost/token/latency trends by workflow version or execution category.
Langfuse also supports evaluation. Teams can assess whether an answer was useful, grounded, policy-aligned, and produced through the right workflow path. They can attach scores, review traces, build datasets, and compare prompt or model changes over time.
This turns improvement into a repeatable feedback loop rather than a manual guessing exercise.
Self Hosting LangFuse
For enterprise teams, self-hosting matters because tracing data may include prompts, context, tool inputs, outputs, and user-linked metadata. Langfuse can be hosted on a VM using Docker Compose for simpler setups, or on OKE (Oracle Kubernetes Engine) when you want a Kubernetes-based deployment with better scaling and operational control. The entry path is short: clone the repository, review the docker-compose.yaml and environment configuration, and deploy the containers. But the architecture behind it is more nuanced.
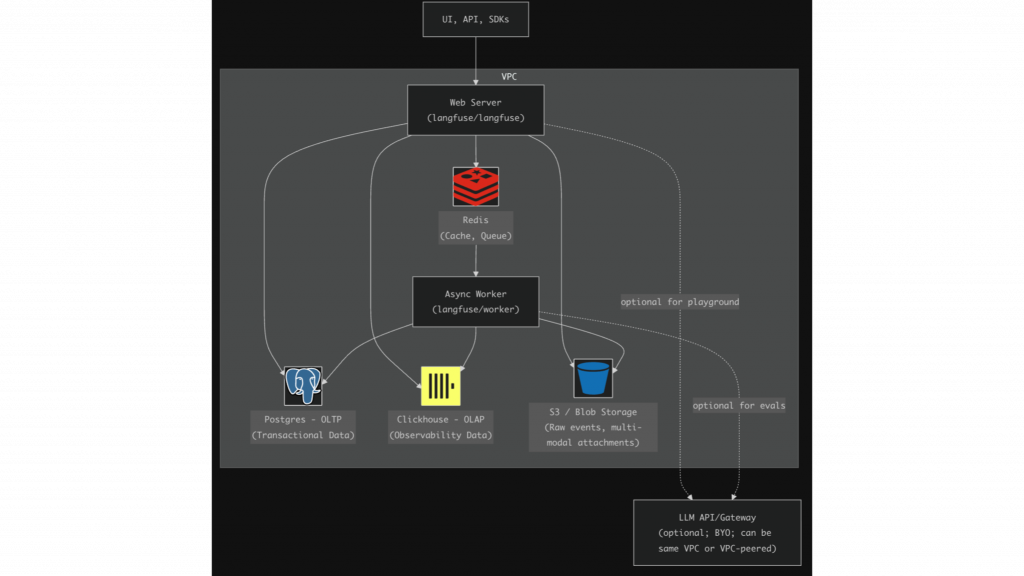
Langfuse runs with a Web Server that handles the UI, API, and SDK traffic, and an Async Worker that processes events in the background. Redis/Valkey acts as cache and queue. Postgres stores transactional state, while ClickHouse stores high-volume observability data such as traces, observations, and scores. S3 or Blob Storage holds raw events, exports, and multimodal attachments. An optional LLM API or gateway can be used for features like playground or eval-related flows.
This separation is critical for production systems. Postgres handles system state, ClickHouse supports analytics at scale, Redis absorbs queue and cache traffic, and the worker offloads processing from the web layer. Together, this enables Langfuse to operate reliably in enterprise environments.
LangFuse For Multi-Agent Systems
In a multi-agent system, the most important rule is that one user request should map to one trace. The orchestrator creates the root trace and root span, and downstream agents continue that same trace with child spans. Tool calls appear as nested spans under the agent that invoked them.
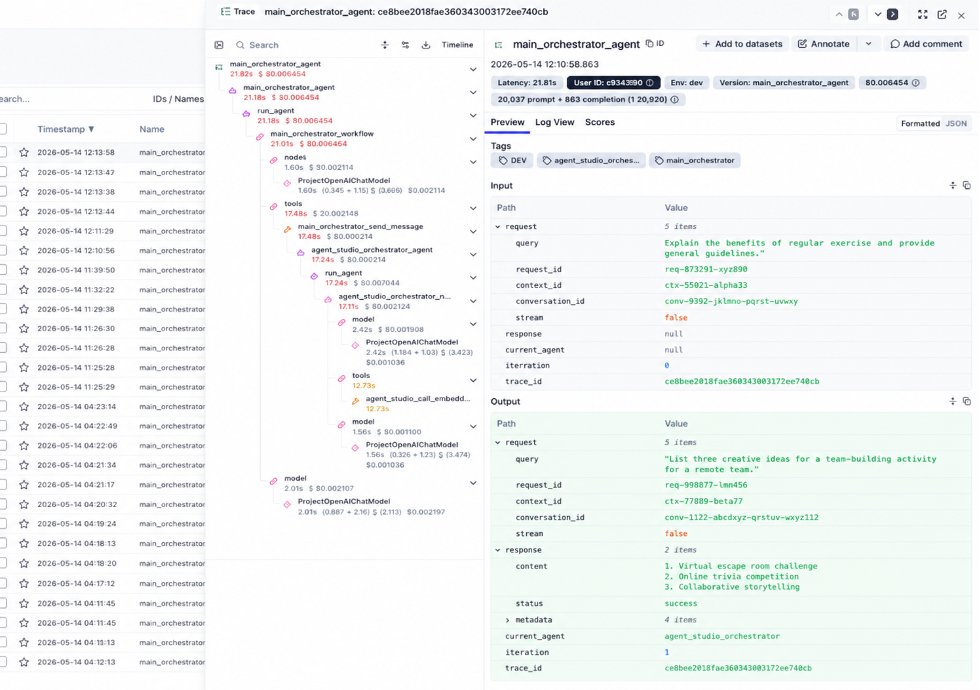
This structure makes multi-agent debugging practical. Instead of disconnected logs, teams see a single execution tree: which agent handled the request, what tools were called, where latency increased, and which steps consumed the most cost.
It also preserves decision lineage, which is useful for audits, incident reviews, and understanding how one user request turned into multiple agent and tool actions.
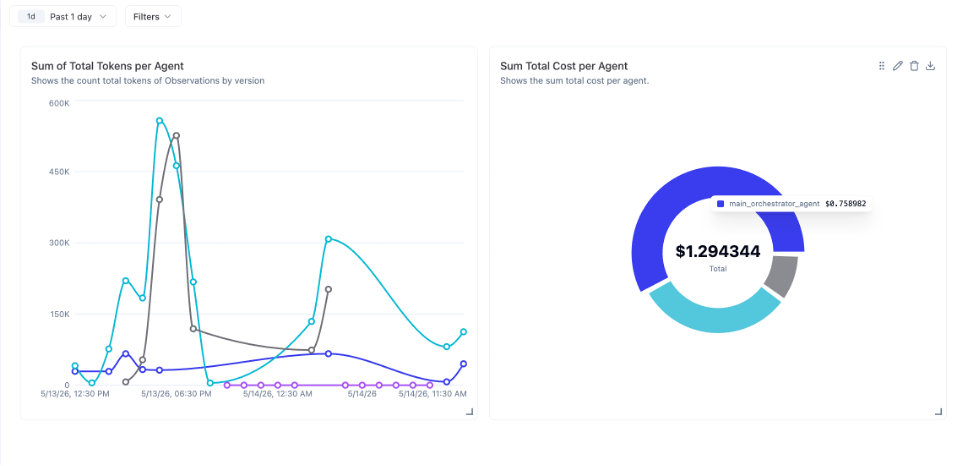
LangFuse also provides a way to create custom dashboards to monitor the system over a period of time. How many tokens did my first agent consume?
What was the cost related to the second agent in the past 7 days?
What was the average time for the agent to respond to user query?
Future Enhancements
The next step is to move beyond observability into active control. Evaluation Framework, Prompt Management, LLM as a Judge,etc. are provided by LangFuse which will be helpful for agentic systems.
Conclusion
Langfuse becomes essential when AI systems evolve from single prompts into enterprise workflows.
In this Enterprise AI implementation, Langfuse provides the observability layer needed to understand how AI responses are produced. It captures model calls, tool usage, metadata, latency, token usage, cost, and evaluation signals. It also fits enterprise deployment needs through self-hosted patterns on VM and OKE, with secure configuration practices such as OCI Vault-backed credential resolution.
For Enterprise AI, the question is not only whether the AI can answer, but whether the organization can understand, trust, operate, and improve how that answer was produced.
Langfuse helps make that possible.