Introduction
The current, documented approach for adding log scraping for your WebLogic Server running in Kubernetes is to use Fluentd but deployed as a sidecar. What will be demonstrated in this document is the deployment of Fluent bit as a daemonset. The logs will be scraped and sent to OpenSearch and Grafana Loki. Both products are open source.
Fluent bit is a much lighter weight option to Fluentd and has been designed with performance and low resource consumption. Deploying Fluent bit as a daemonset means that there will be one instance of Fluent bit on every node in the node pool(s). With the sidecar approach there is one sidecar deployed with every instance of the Oracle WebLogic administration and managed servers.
Prerequisites
- Helm v3.x
- Kubernetes cluster
- At least 3 nodes, Grafana Loki requires at least 3 nodes.
- WebLogic Kubernetes Operator
- WebLogic Application, such as ToDoList sample application
Software Installation
Fluent bit
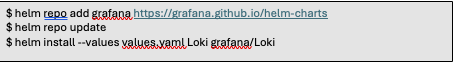
The easiest way to install Fluent bit is with the Helm charts and as a daemonset. To do the installation execute the following:
![]()
To verify that the repo was added execute:
![]()
The output from the above command should be like the following:
| NAME |
CHART VERSION |
APP VERSION |
DESCRIPTION
|
| fluent/fluent-bit |
0.47.10 |
3.19 |
Fast and lightweight log processor and forwarde…
|
| fluent/fluent-operator |
3.20 |
3.20 |
Fluent Operator provides great flexibility in b…
|
| fluent/fluentd |
0.5.2 |
V1.16.2 |
A Helm chart for Kubernetes |
| grafana/fluent-bit |
2.6.0 |
V2.1.0 |
Uses Fluenbit Loki go plugin for gathering lo… |
Prior to doing the actual deployment of Fluent bit we want to update the values.yaml file. The default chart values include configuration to read container logs, with Docker parsing, systemd logs to apply Kubernetes metadata enrichment and finally output to an Elasticsearch cluster. You can find the default values.yaml file here. We will cover the required modifications to the values.yaml for our purposes in the “Fluent bit Pipeline Configuration” section.
Prior to executing the installation of Fluent bit, follow the instructions in the “Fluent bit Pipeline Configuration” section.
![]()
OpenSearch Installation
There are two components of installation for OpenSearch: the OpenSearch opensearch, and OpenSearch the components.
![]()
With the operator installed we can now install the OpenSearch product. The Helm chart for OpenSearch is found at this location.
To install OpenSearch and the dashboards execute as below.
![]()
Grafana-Loki Installation
Grafana-Loki provides multiple types of installation: monolithic Loki, microservice Loki, or scalable Loki. This document will implement the installation of microservice Loki. If you’re interested in determining which approach is best for your application, then reference the Loki documentation.
Grafana-Loki is installed with helm charts. However, prior to do the installation I will create the values.yaml file. In the documentation, Grafana provides a sample values.yaml file. The Grafana-Loki values.yaml file is found here. It is best to get started using this file. The default configuration uses “minio” as the storage. You can set up block storage, and is recommended for production; however, for my purposes I use the “minio”.
Configuration
Fluent bit Pipeline Configuration
[INPUT]
We are going to focus on the pipeline section of the Fluent bit values.yaml file. This section will cover the service, input, filter, and output sections of the pipeline. The service section will look as below.

The input section defines the plugins we will use to gather information for the log files. There are plugins for metrics gathering; however, for the purpose of our discussion we will not cover them in this document. If you’re looking for a deeper dive into the Input Plugins refer to the documentation.
We will use two input instances. When the input plugin is loaded, “Tail”, for our scenarios, an internal instance of this Input plugin will be instantiated. Each instance has its own independent configuration.
The first input plugin is defined as shown below:
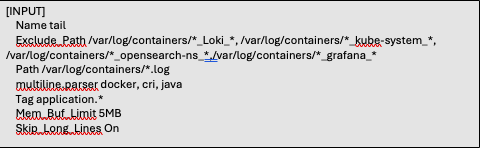
Let’s peek into the key properties that define what we want or don’t want the plugin to collect.
Name: This is the name of the plugin we are to use for our input processing. For this scenario we are using the “tail” plugin. You can find the “tail” plugin documentation here.
Exclude Path: The exclude path informs the plugin to exclude files that match a specified pattern. In the case defined above, we are excluding files that are contained in the “/var/log/containers/” directory. However, notice the additional wildcard statement following the directories. By specifying the path as such, we are directing the plugin to bypass those directories within those namespaces.
Path: Specifying the path informs the plugin which logs are to be processed by the input plugin. We eliminated, via the Exclude_Path, several pod container logs based upon namespaces those pods are in. With the Path parameter we are asking Fluent bit to collect the logs from our application pod. The WLS pods are in the todolist-domain-ns namespace, which is the domain namespace remaining.
Tag: This value will be placed on lines read. This value will be used later in filters and outputs to match the inputs with the outputs.
Multiline.parser: There are two ways to configure and use multiline parsers. You can use the built-in parser or use a configurable parser. In the scenario defined above we will use the built-in multiline parsers. Why are we using the multiline parser? Most of the time log messages are contained within a single line. However, there are times that multiple lines belong to the same context, such as in stack traces. Using the multiline parser ensures that the multiple lines, but within the same context, are treated as one log message.
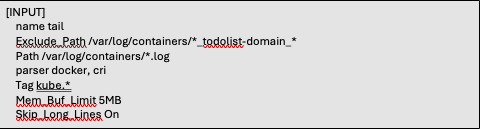
The second input defines a different set of scraping rules. Much like we did above we eliminated the scraping from non-application containers. However, in this instance we are eliminating the application containers and will include all the namespaces we excluded above. We also tag this input as ‘kube.*’.
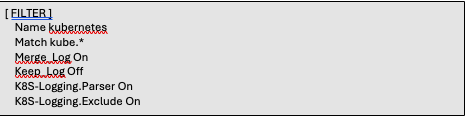
Name: The Kubernetes filter enriches the log files with Kubernetes metadata. With Fluent bit deployed as a daemonset this filter aims to perform the following operations:
- Analyze the Tag and extract the following metadata:
- Pod Name
- Namespace
- Container Name
- Container Id
- Query Kubernetes API Server to obtain extra metadata for the POD in question:
- POD ID
- Labels
- Annotations
- Namespace Labels
- Namespace Annotations
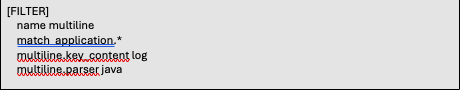
The multiline filter helps to concatenate messages that originally belong to one context but were split across multiple records or logs.
[OUTPUT]
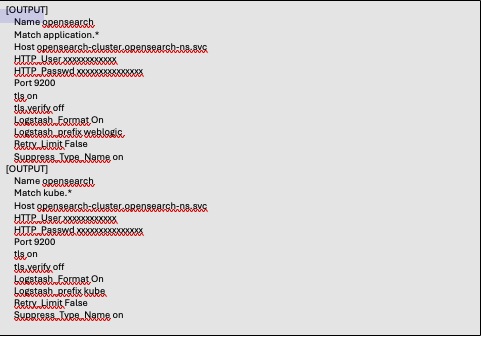
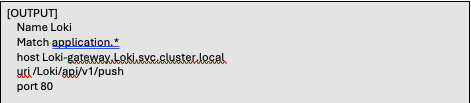
We created two output sections for OpenSearch: one for the application logs and the second one for the kube system logs. The third output is to Grafana-Loki. For this scenario we are only going to push the application logs to Loki. In order to drive the application logs, and only the application logs to Loki, we provide the same value, “application.*”, as was used in the Tag parameter in the INPUT sections. The kube.* logs will not reside in Loki.
With the Fluent bit pipeline now configured the logs will now be routed to the defined output endpoints. Let’s now have a look at the OpenSearch and Grafana-Loki endpoints and configure them accordingly.
To access the OpenSearch dashboards, execute the following.
![]()
We can now open the OpenSearch dashboard from your favorite browser. Within your browser execute: https://locahost:5601. The default set of credentials to gain access to the dashboards are admin/admin.
OpenSearch Configuration
We are going to setup the index patterns. The patterns will match the Logstash prefixes that were specified in the Fluent bit configuration in the output sections. To do this, do the following:
- Select the hamburger menu in the upper-left corner.
- Scroll down to the management section and select Index Management
- Select Indexes
- Select Create Index
- Specify an Index Name. The name should match the logstash prefix, “weblogic”.
- Go back to the management section from the hamburger menu.
- From the Dashboards Management select Index Patterns
- Within the Index Patterns page select “Create index pattern”
- From the text box enter the name of the prefix, “weblogic”.
After setting up the “weblogic” index repeat the above steps and create the index pattern for “kube”.
Grafana-Loki Configuration
Loki is a datastore much like OpenSearch is. OpenSearch provides dashboards for the viewing of the logs. However, to view the logs for Loki the use of Grafana dashboards is required.
To bring up the Grafana dashboard execute the following from the command line. The first thing we need to do is grab the password for the “admin” user. The default user for Grafana is “admin”.
![]()
To bring up the Grafana dashboard do another port-forward from the command line.
![]()
From a browser enter, http://localhost:3000. Login to the dashboard. The user is “admin”, and the password is from what was provided from the command above. To view the logs stored in Loki a data source needs to be created.
From the main console do the following:
- Expand Connections
- Select “Add new connection”
- From the “Add New Connection” page select Loki
- Select “Add new source”
- Specify Name: “Loki” set as default
- Connection Url: http://Loki-gateway.Loki.svc.cluster.local. The url is defined as follows: <service name>.<namespace>.svc.cluster.local. Configure your endpoint appropriately.
To see the logs a dashboard needs to either be created or one is imported. Predefined dashboards can be found at the Grafana website.
Writing Logs to FSS
The above example demonstrates the use of multiple observability and monitoring products. However, all the logs were written to the container’s filesystem. If the pod crashes or is stopped, then the files are gone as well. To ensure the files are not lost, we can configure the files to be written to an external filesystem, such as the OCI File system Service (FSS). Block storage is an option, as well. The approach given below will focus on FSS.
Configure OCI FSS
The first task is to setup OCI FSS.
- Create a File System from the OCI console or through the CLI
- Select an export path
- Select or specify a mount target
- Create an export in the mount target
Follow the instructions at Creating File Systems in the OCI documentation.
There are two pieces of information that you will need for future use.
- Capture the IP address of the mount target
- Capture the mount target export path
Once the volume is created, you need to set the permissions on the volume. To do that, you need to exec into a pod container that has access to the FSS volume. If a pod is not available then follow the instructions to use a sample provided. Once you’re in the shell of the container execute the following command:
![]()
After changing permissions on the volume, you can delete the sample pod.
Create Persistent Volume and Persistent Volume Claim
For the WLS logs to be written to the volume in the FSS, you need to define a Kubernetes persistent volume and a Kubernetes persistent volume claim. The PersistentVolume (PV) is a piece of storage in the cluster. The PersistentVolumeClaim (PVC) is a request for storage by a user.
There is 1 one piece of information that is necessary to make note of. Both WLS and Fluent-bit need to access the same FSS volume. You would think that since both resources are referencing the same file storage that one PVC would suffice. This is not the case. You must define a PVC for the WLS reference and also for the Fluent-bit scraping.
Let’s have a look at the configuration for the PV.
Persistent Volume Configuration

- The name of the PersistentVolume
- The label to be applied. Specify the weblogic.domainUID as the key and the value must be the name of the WLS domain.
- The storage class name. The storage class name provided does not have to exist. It can be any name you want.
- The IP address that was defined for the mount target that was created previously.
- The export path
Persistent Volume Claims
PVC for Fluentbit
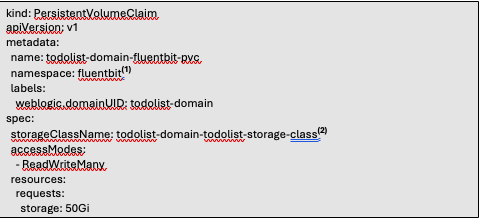
- The namespace to deploy the PVC to. The namespace must be the same namespace where Fluent-bit has been deployed.
- The storageClassName must match the same name of the storageClassName specified in the PV.
PVC for WLS logs

- The namespace to deploy the PVC to. The namespace must be the same namespace where your WLS domain has been deployed.
- The storageClassName must match the same name of the storageClassName specified in the PV.
After creating the PV and PVC manifests you can deploy these resources to the Kubernetes cluster. Use the “kubectl apply …” command to deploy the resources.
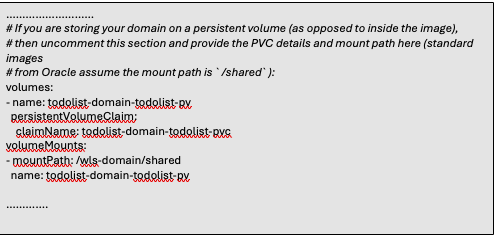
Update the Domain
The domain configuration needs to be updated. The filesystem has been created and ready, the PV and PVC are deployed. The domain resource needs to know about the new external system. This is done with modifications in the domain yaml. Update the “domain.yaml” manifest, by adding the information to reference the persistent volume. After updating the domain manifest, then deploy the updated domain with the “kubectl apply -f <domain-manifest.yaml>.
Now that the domain has been updated, the WLS logs will now be written to the external volume.
Next we modify the Fluent-bit configuration to direct Fluent-bit to scrape the logs from the external volume.
Modify Fluent-bit Configuration
To have Fluent-bit scrape the external files, it must be configured to know about the external filesystem. The configuration modifications are made in the “values.yaml” or a copy of this file. The two sections of the “values.yaml” are the “daemonSetVolumes” and “daemonSetVolumeMounts”. The following snippet of the file is shown below.
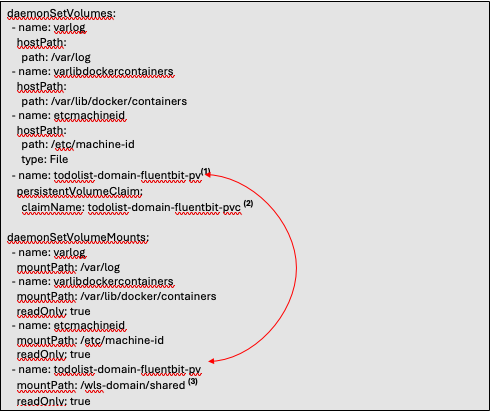
- The name for the “daemonSetVolumes” and the “daemonSetVolumeMounts” must match. These names are also the same name specified in the Persistent Volume configuration.
- The name of the Persistent Volume Claim configured above.
- The mount path. This is the mount path specified in the mount target.
With these configurations in place there is only one last configuration that needs to be made to the Fluent-bit configuration. This configuration involves making changes to the input section.

To upgrade your Fluent-bit configuration it is done as follows:
![]()
Summary
With Fluent bit, OpenSearch, Loki, and Grafana the ability to scrape application and kube logs for review is now available. As demonstrated throughout the article, you can default to having the logs written and scraped from the container filesystem or you can specify an external volume. Which approach is used is heavily dependent on one’s use case and non-functional requirements. The OpenSearch and Grafana dashboards can provide tremendous insights into your enterprise system.