
Siebel CRM deployments are increasingly distributed and operationally complex. Operators and Administrators need timely visibility into server availability, workload, application health, and the signals that help explain an issue. When monitoring information is fragmented across tools and teams, diagnosing problems can take longer and day-to-day operations can become more difficult.
That’s precisely where our new Siebel Monitoring & Diagnostic Console (SMDC) is designed to enhance existing monitoring solutions with centralized observability for Siebel CRM deployments. It brings together metrics, logs, and operational signals through prebuilt dashboards and a unified application experience, helping operators monitor the health and performance of their Siebel CRM environments.
SMDC runs alongside the existing Siebel CRM environments and is designed to provide observability without requiring application changes. It supports Siebel CRM deployments in both on-premises and cloud infrastructure.
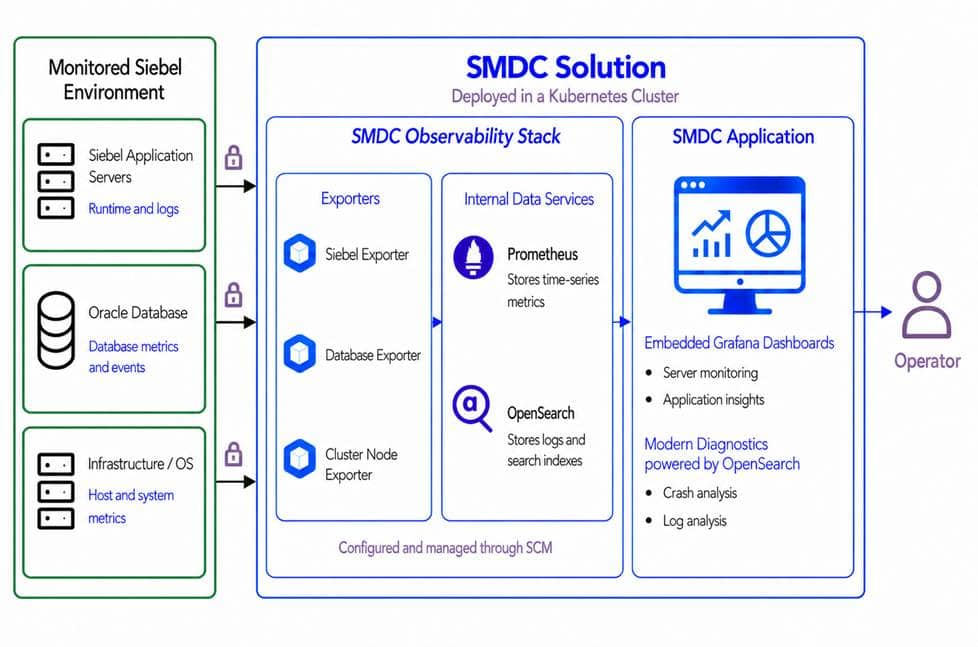
Image: SMDC functional architecture
How customers benefit
SMDC is intended to help operations teams gain a more complete and actionable view of their Siebel CRM environments. By consolidating monitoring information into a single experience, it can help teams identify issues sooner, investigate them with better context, and focus their troubleshooting efforts.
- Monitor Siebel server availability, health, and component status from a centralized view.
- Track workload indicators such as active sessions, processes, tasks, SQL activity, and user commits.
- Review application health, component groups, workflow activity, and repository information.
- Use prebuilt dashboards to investigate operational conditions by server, component, and time range.
- Simplify observability deployment and lifecycle management through Siebel Cloud Manager and Kubernetes-based infrastructure.
Key capabilities
- Environment overview. SMDC provides a summary of the monitored Siebel environment, including server health, availability, deployment details, operating system information, repository status, and data-source connectivity.
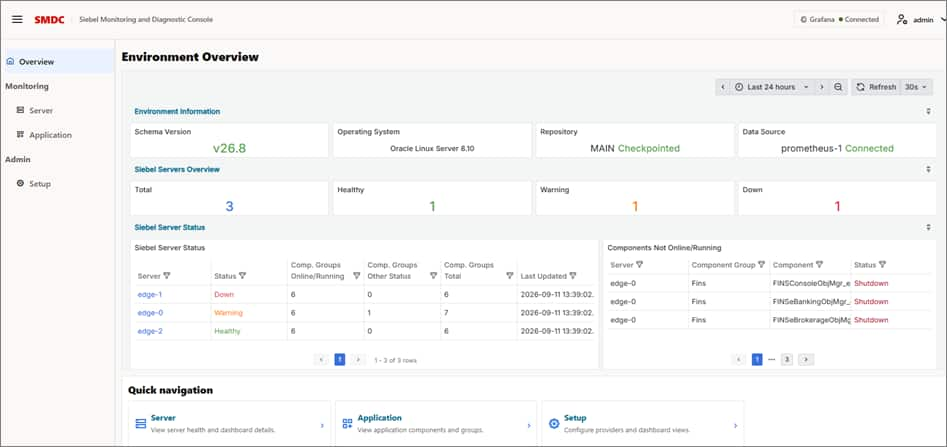
- Server monitoring. Operators can view server availability and health across the environment, with workload metrics for sessions, processes, tasks, SQL activity, and user commits. Component-level views help teams investigate potential bottlenecks.
- Application insights. SMDC provides consolidated application health views and monitoring for component groups, individual components, sessions, running tasks, processes, workflows, and repository information.
- Centralized configuration. Administrators can manage dashboard providers, configure dashboards by functional area, and enable or customize dashboards through a single interface.
- Secure everyday access. SMDC can be configured with an enterprise OpenID Connect provider, allowing users to access dashboards with their corporate identity after commissioning is complete.
How it works
The SMDC observability stack is deployed through Siebel Cloud Manager. During setup, administrators prepare the required infrastructure, connect the Siebel environment, register the necessary exporters, and validate that monitoring targets are healthy.
The SMDC application is then deployed through Siebel Cloud Manager and connected to Grafana dashboards. After the public URL and enterprise identity provider are configured, users can sign in and monitor the connected Siebel target environment through the Environment Overview, Server Monitoring, and Application Monitoring dashboards.
The deployment workflow uses temporary bootstrap access for initial commissioning. Once setup is complete, configuration can be secured and users can access SMDC through the configured enterprise identity provider.
Getting started
SMDC is delivered as a Sample Application by request only through My Oracle Support. The package includes the SMDC Observability Deployment Guide, SCM packages containing the required container images and Helm charts, supporting utility images, and prebuilt Grafana dashboard exports.
The current sample application supports Siebel 21.2 and later, Linux-based Siebel Server deployments, and SCM-based deployment for both the SMDC application and observability stack. It supports containerized and non-containerized Siebel deployment models.
To access the SMDC Sample Application, please contact Oracle Technical Support and reference Patch #40179549.
We look forward to hearing your feedback on the new Siebel Monitoring & Diagnostic Console solution!.