Data Visualization and Dashboards
Dashboards provide an intuitive approach to consuming aggregated data and insight, often used to track KPIs and metrics relevant to core business objectives. As part of our Data Visualization strategy, we want to provide a framework to easily build Dashboards with OpenUI, accelerating the time to market and reducing the cost associated with such business requirements.
In the 22.5 release, we released two important structures for building dashboards in Siebel CRM. These pre-defined components and sample dashboards can be further extended and customized to match your specific business objectives:
Data Visualization Components
- Pre-defined Components: New pre-defined visual components are available to use in Dashboard views: Infolets, Relationship Hierarchy and Timeline.
Dashboards
- Industry Dashboards: Sample, industry dashboards for Financial Services, High Tech & Manufacturing and Communications, related to user personas across Service, Sales and Account Management. These dashboards contain the new visual components and provide a summary of the most important information related to the specific persona use cases.
Data Visualization Components
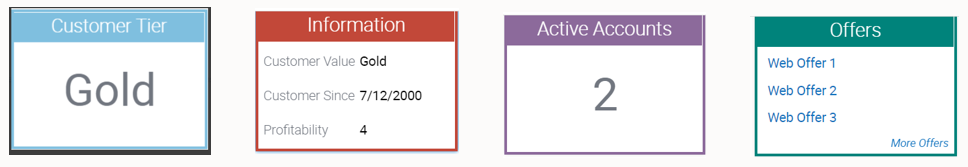
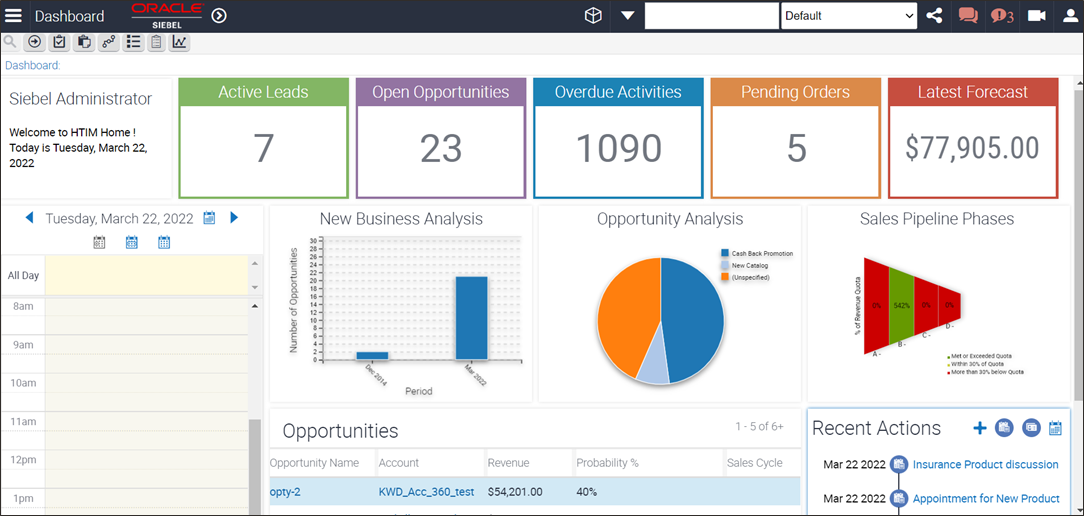
Infolets are new visual component that will enable customers to build visually intuitive dashboards. Infolets are used to display simple statistical elemens or KPIs. They are comprimsed of a Title and associated display values; with the ability to display single and multiple fields (such as Number, Text, Date) which can also be drilled down on to the relevant view. Below are the four types of infolets:
- Infolets displaying a Business Component field
- Infolets displaying aggregate values
- Infolets displaying multiple field values of a business component
- Infolets displaying a list of records
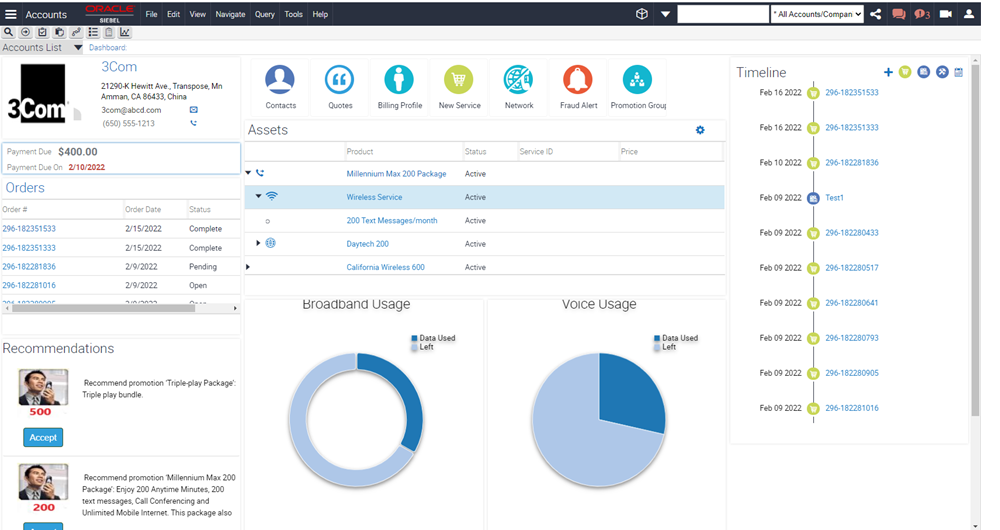
Timeline
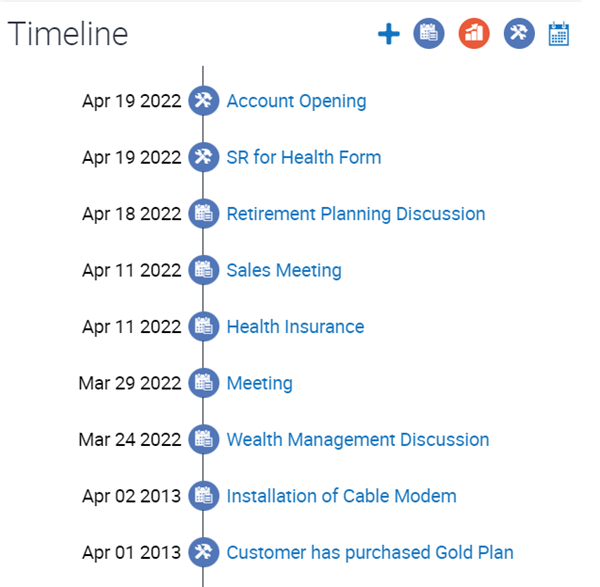
Consumers will have multiple interactions with organizations and therefore a timeline view provides a nice, intuitive snapshot of such interactions. Timeline provides the ability to see the sequence of events over a time scale. This has the ability to display events from multiple entities in a chronological order and filter events based on criteria and date range. Timeline displays data in the format: Date, Entity Icon and Description. This has the capability to directly add an activity using the add button in the timeline. By clicking on the description, the user can also drill down and navigate to the respective detailed view as well, making it easy to access underlying details.
Hierarchy
The Hierarchy component is used to show various multiple associated entities such as Opportunities, Activities, Service Requests, etc. in a single view. This component helps provide 360° view of a contact or a similar business object. It provides the ability to display linked data in an ordered four level hierarchy such as Contact à Household à Household contacts à Opportunities
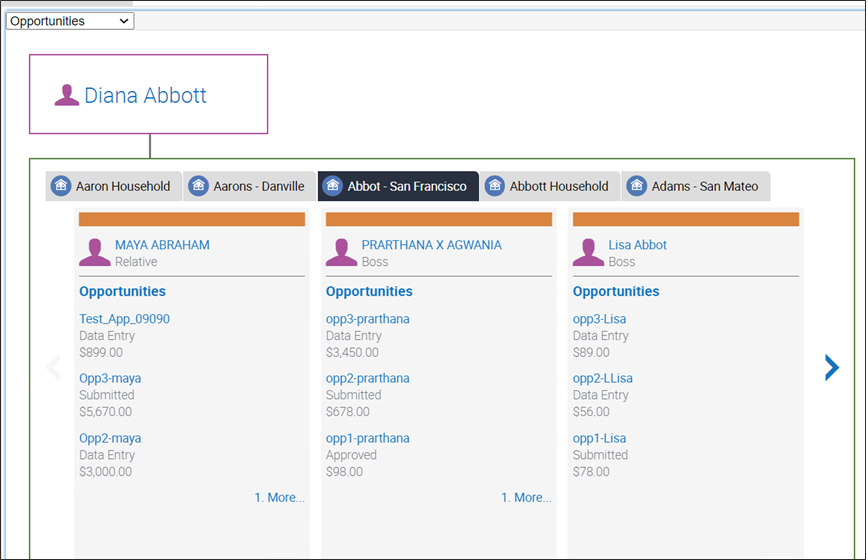
The four level hierarchy fields can be configured and displayed based on specific needs. There is a drop down to display the level four data such as Opportunities, Service Requests, etc. on selecting the drop-down value, the level four data gets updated. Users can also drilldown and navigate to different Views to see more details and the fields and data to be displayed can be configured based on business requirements.
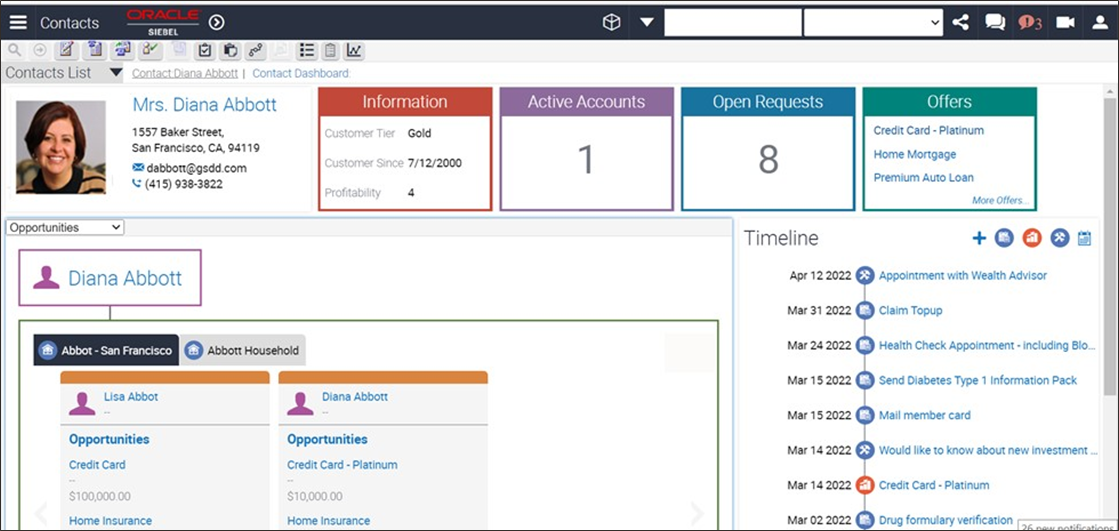
Sample Industry Dashboards
The sample industry dashboards comprise of pre-configured out of the box dashboards. These are reference dashboards built with new and existing visualization components such as infolets, hierarchy, timeline, charts and so on. They illustrate and showcase what’s possible with the new visualization components to build industry dashboards.
Sample dashboards have been developed for the following industries:
Financial Services (Customer 360° dashboard)
Hi-Tech and Manufacturing (Agent 360° dashboard)
Telecommunications (Account 360° dashboard)
As part of the 22.5 release, extensive documentation is also provided to configure the new visualization components and also the configuration details of the sample out-of-the box dashboards, which could be customized to meet specific requirements.
This post was authored by Roshan Alexander, Principal Product Manager at Oracle