A lot has already been published on the Software in Silicon innovations in the recent SPARC M8, S7 and M7 CPUs. A large part of these innovations are implemented by a small dedicated unit on these CPUs called the DAX. The DAX itself can accelerate four basic operations, namely
- “scan”, search for occurrences of a certain bit pattern in memory
- “select”, pick chunks of data from a memory area
- “translate”, apply a simple translation table to a region in memory (used in processing HASH JOINs by means of Bloom filters by the Oracle database)
- “decompress” previously compressed data in memory, used by the Oracle database to work transparently on compressed data stored in main memory
All of these functions are also available to third party developers, Solaris provides a library named libdax.so to leverage the DAX. This article will not talk about using the DAX, but I want to explain how one can monitor DAX usage and /or prove that it is being used by an application.
The DAX itself can only communicate via main memory, and any task that a DAX unit should work on is described a by a command block that is written to main memory. The physical address determines which DAX unit in a system is being addressed. Each CPU in a system has its own DAX units, a M8 or M7 CPU has eight of them while a S7 only has four. But every DAX unit in a system can addressed by any core in a system.
The complexity of the aforementioned communication is not exposed to the programmer, the hypervisor handles the lowest level of communication and exports APIs that are consumed by higher level “application” including the operating systems in logical domains on top of the hypervisor (usually it will be a Solaris kernel consuming the hypervisor APIs)
The hypervisor assigns work to each DAX in a round-robin fashion: each DAX provides four pipelines which do the actual work, the hypervisor will first assign a unit of work to one pipeline per DAX before it assigns work to any second pipeline spreading load out across all DAX units of one CPU. The following image shows a terribly simplified view of a CPU with only lightly loaded DAX units:
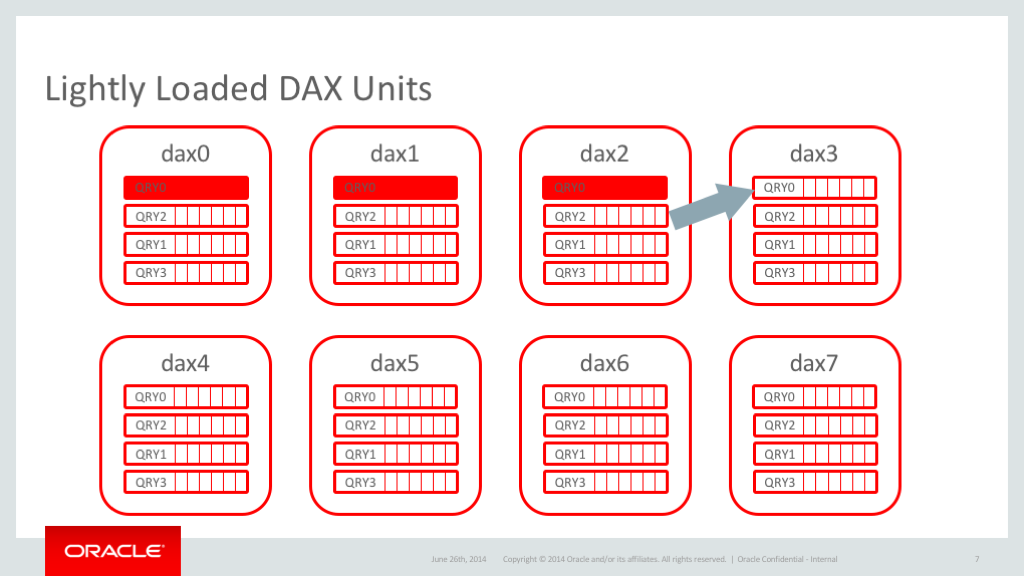
As load increases, i.e. more and more tasks are being assigned to DAX pipelines, the hypervisor will start to also use more than one pipeline of each DAX unit, each pipeline is named QRY0 to QRY3 and the order in which work will be assigned is
QRY0 → QRY2 → QRY1 → QRY3
So a situation with medium load on all DAX units would look like this:
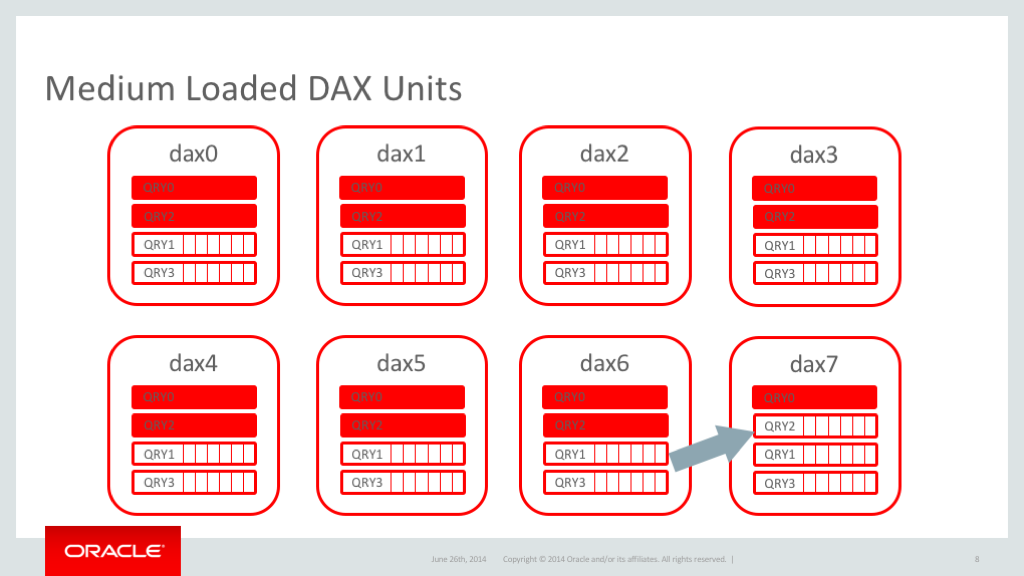
Every first and all but one second pipelines are busy.
Solaris’ busstat command
busstat works similar to its sibling command cpustat, it counts events. Its detailed behaviour is highly dependent on the platform it is being run on, usually busstat monitors peripheral events like memory accesses etc, while cpustat targets CPU internal events. The monitoring of DAX in a way breaks this rule, although DAX is an internal part of the CPU it is being monitored by a busstat event. I will not detail every possible event reported by the DAX, for the intent of this article it suffices to only highlight one: how often has work been assigned to a particular queue, it is named “DAX_QRYn_input_valid” with “n” being the number of the pipeline. There’s one gotcha with busstat (and cpustat): you cannot monitor arbitrarily many events per device and unit of time. With DAX and busstat you can only watch three events at the same time. Putting this all together the following command can help judge the amount of load handled by all DAX units:
busstat -w dax,pic0=DAX_QRY0_input_valid,pic1=DAX_QRY1_input_valid,pic2=DAX_QRY3_input_valid 5
Below you find an example of this busstat invocation on a system without any load on the DAX units.
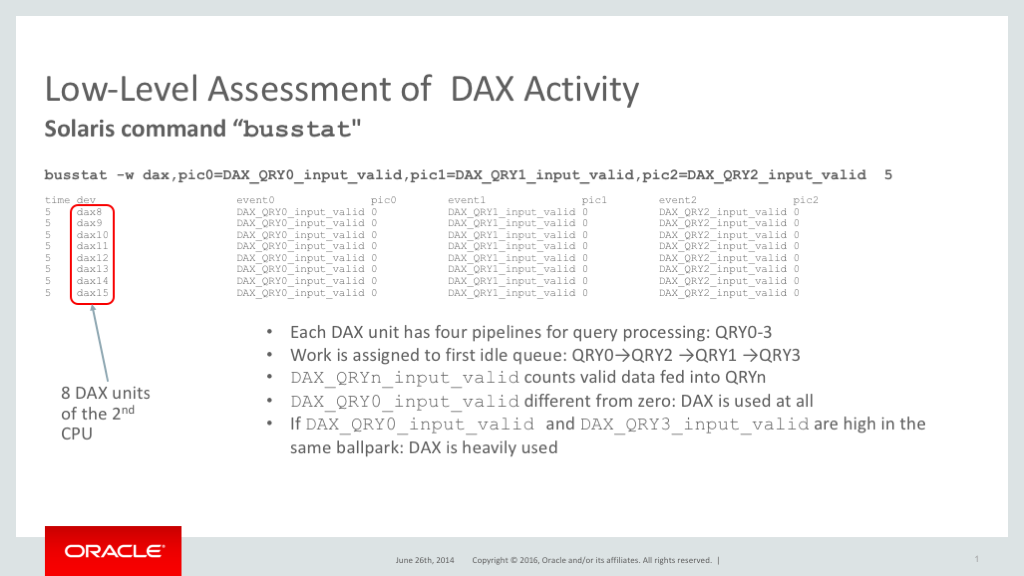
The DAX units are numbered consecutively, i.e. the eight DAXs of the first M7 or M8 will be called dax0 to dax7, the ones from the second CPU dax8 to dax 15 and so on.
So how should this output be read? You should not spent too much attention to the absolute numbers, they can easily become 6 digits. The relation of the amount of work assigned to the different pipelines of the same DAX units signals the amount of load targeting the DAXs present in the system:
- If only DAX_QRY0_… shows activity and all others are zero there’s only light load
- If DAX_QYR0_… is active and also all DAX_QRY2_… (or DAX_QRY1_…) show activity the DAX units are under medium load
- As soon as DAX_QRY3_… shows the same activity as DAX_QRY0_… the DAX units are under high load
Attached is a PDF of the last diagram which can serve as a cheat sheet when working busstat to assess the load on DAX.