Announcing Oracle Machine Learning Model Monitoring UI—an easy-to-use no-code user interface on Oracle Autonomous Database that helps you maintain the accuracy of your models and the effectiveness of your applications. OML Model Monitoring UI makes getting started simple so you can gain insight into how your machine learning model performance changes over time as well as possible causes of those changes. It’s built into Autonomous Database so you can get started right away.
Model monitoring detects concept drift and quality drift. Tracking and reporting on changes in model prediction patterns and accuracy helps you know when models need to be rebuilt, as well as when other causes such as data drift need to be investigated. With the Model Monitoring UI, you can also specify data monitoring with a single click.
Monitoring enables you to take corrective action before changes in model behavior and data changes have a significant negative impact on your enterprise. OML Model Monitoring UI complements the no-code OML Data Monitoring UI, along with the OML Monitoring REST endpoints that enable programmatic data and model monitoring.
Why model monitoring is important
Often, the final step in machine learning solution deployment goes unfinished – monitoring. There are two aspects: data monitoring and machine learning model monitoring. Data monitoring helps ensure data integrity for your enterprise applications and dashboards by quickly and reliably identifying data drift and providing insight into data feature changes. Model monitoring helps identify changes in model accuracy which can result from changes in data patterns, e.g., customer behavior, as well as data quality issues, e.g., erroneous upstream data feeds. Detecting issues early enables you to take corrective action before these issues significantly impact your enterprise.
Model monitoring is an essential phase in the machine learning model lifecycle – supporting MLOps. Once deployed, models need to be monitored to identify performance issues, reveal biases in data, uncover data errors, and even meet regulatory and compliance requirements for transparency and accountability rules.
Over time, shifting data distributions – or concept drift –can result in less accurate predictions. Moreover, “bad” data defined by erroneous upstream input can also result in lower quality predictions. Without monitoring, these issues remain hidden and can lead to silent failures and reduced predictive accuracy. Monitoring models as part of solution deployment helps you determine when a model needs to be retrained or even redesigned.
Consider two common use cases: fraud detection and customer churn. Fraud tactics change over time and the patterns that machine learning models learn from data last quarter may no longer be as accurate today. This results in possibly more fraudulent transactions going unidentified. Similarly, customer churn behavior may change over time as new competitive offers become available or the economy changes. Churn models, which predict a customer’s likelihood of terminating a service or using a product, that perform poorly could cause enterprises to waste resources targeting the wrong customers or entirely missing certain high-risk customers. Catching degradation in model accuracy helps data science teams know when a model no longer meets business objectives.
Monitor your models with a few clicks
With OML Model Monitoring UI, you can quickly and reliably identify model concept drift and gain insight into the impact individual data features (columns) have on model predictions. You can also combine model monitoring with data monitoring in the same monitor.
OML model monitoring is supported for in-database classification and regression models, and performance is tracked using various model metrics. For classification, model quality metrics include accuracy, balanced accuracy, AUC, F1, precision, and recall. For regression, model quality metrics include R^2, mean squared error, mean absolute error, and median absolute error. Prediction statistics include population stability index, mean, minimum, maximum, and standard deviation.
The workflow is simple. Prepare your data for modeling and build your in-database model. Deploy that model to OML Services. Select your baseline data against which you’ll measure changes in the “new” data. Then, create the model monitor.
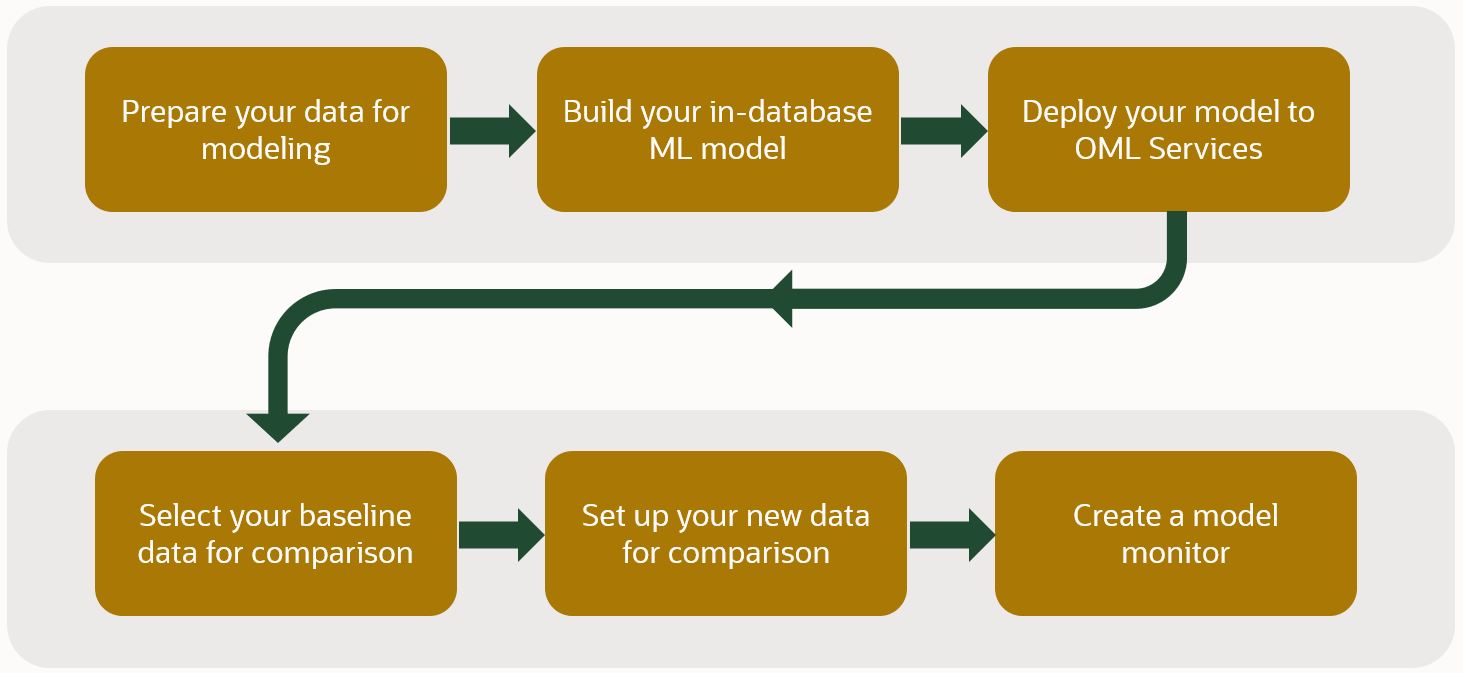
Figure 1: Model monitoring workflow
OML Model Monitoring UI makes it easy to set up monitors on a recurring schedule to assess model quality by comparing and tracking changes in metrics over time.
Note that if you prefer to integrate monitoring programmatically into your existing tools using REST endpoints, you can use OML Services REST API for model and data monitoring.
With OML Model Monitoring UI, you define a model monitor by specifying a monitor name, baseline data and new data, repeat frequency, starting time, among other options, as shown below.
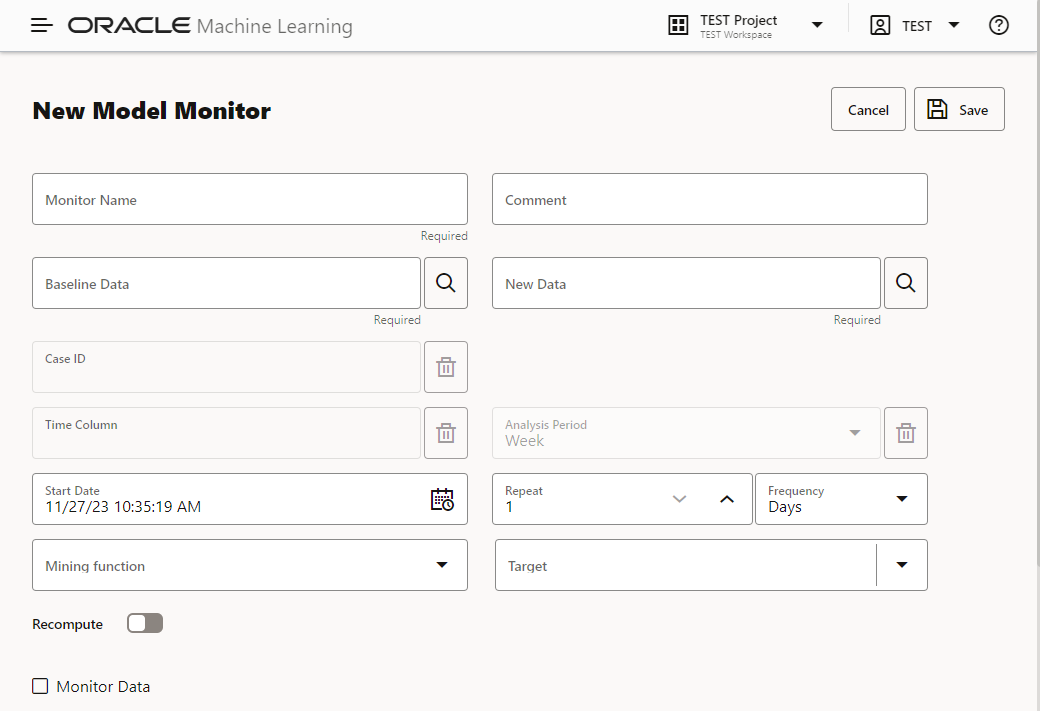
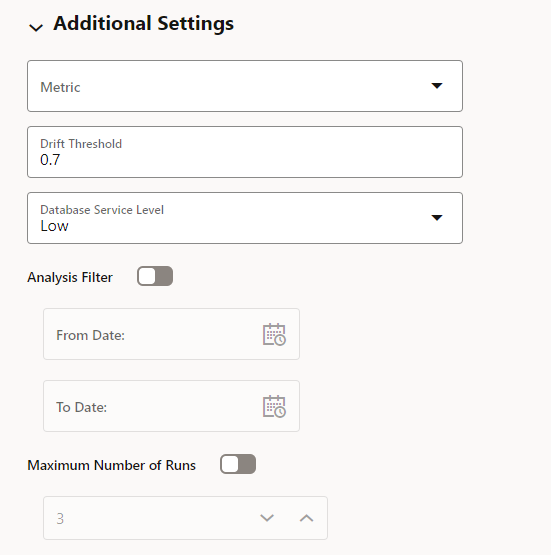
Figure 2 – Model monitor specification interface with additional settings
You can start a monitor immediately or wait for its scheduled run time. You can choose to recompute all previous results or evaluate only new data. After each run, review changes in model statistics through easy-to-interpret charts. Drift detection can be calculated over multiple time periods. For example, monitoring for drift each week in a dataset that contains multiple weeks of data. Each week of data is compared independently against the baseline data to identify potential drift. Additionally, data can be added dynamically to the new data, so as data grows over time new observations are monitored.
Shown below is a chart of the model drift metric for a selected monitor and its corresponding models. Your specified threshold is plotted to easily assess if model drift is a concern.
Figure 3 – Model drift time series across multiple models
Next, you can view the model metric and prediction statistics charts. Each are computed per model and immediately available. Here’s a composite view of each. See the documentation for full details on monitor results.
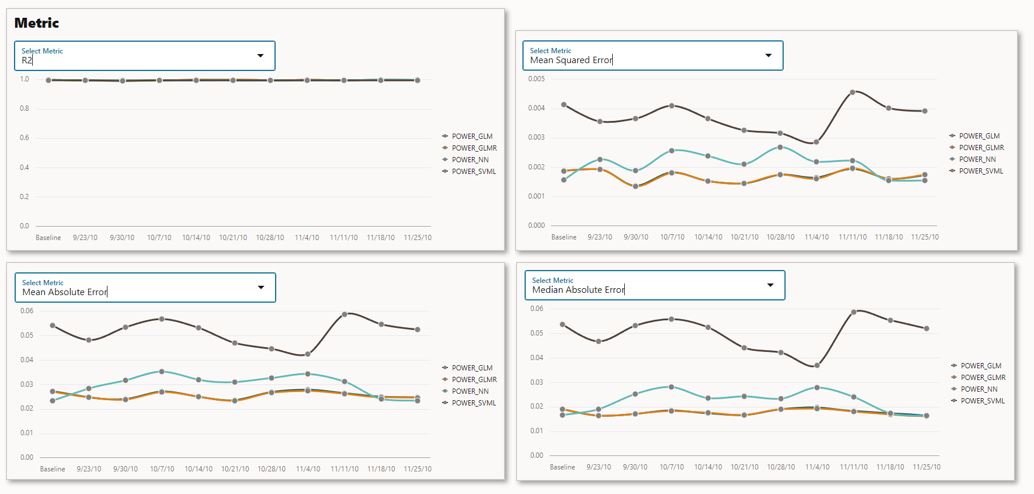
Figure 4 – Model metrics for each model and time period (composite image)
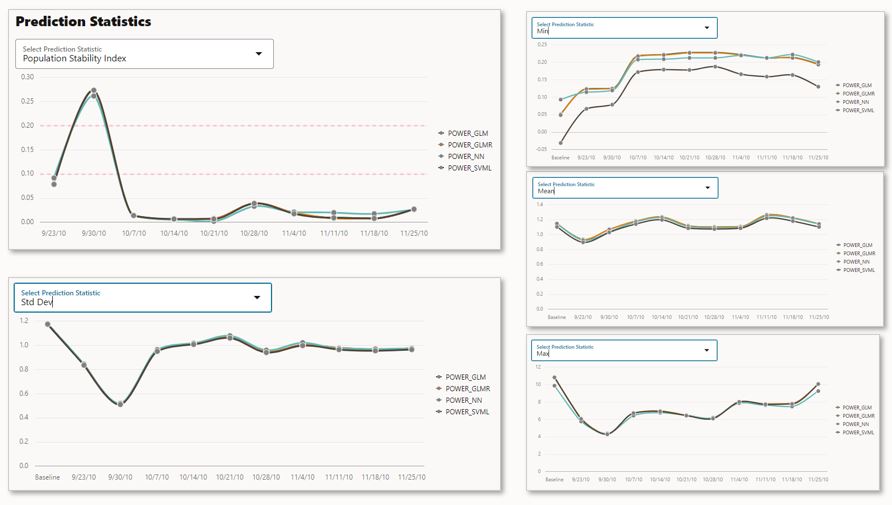
Figure 5 – Model prediction statistics for each model and time period (composite image)
Diving deeper, you can access other details on each model. In the figure below for the neural network model that predicts global active power, you see the feature impact graph for each predictor used by the model and how it changes over time. For ease of interpretation, you can toggle the log scale on the y-axis. Below, we see that GLOBAL_INTENSITY has the most impact for the neural network model.
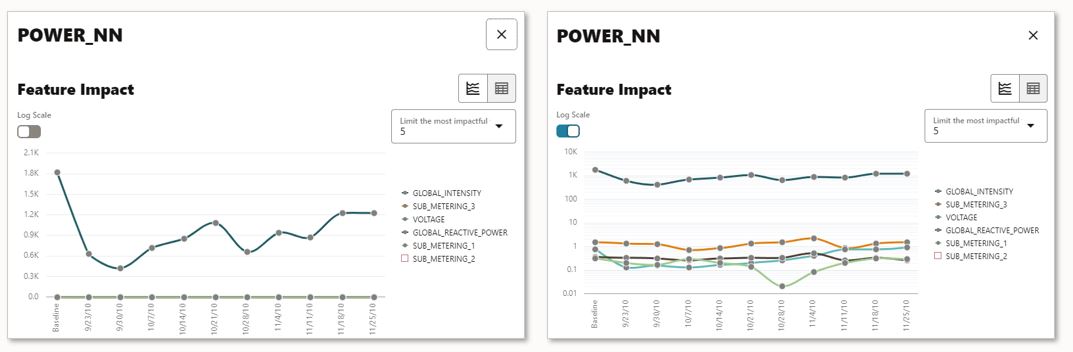
Figure 6 – Selected model (neural network) feature impacts per time period (linear and logarithmic scales)
Next, compare prediction distribution for specific time periods. For regression, the predictions are binned and the count of predictions in each bin provided for ease of comparison across time periods. Below, we see that data from the more recent time periods show an increase for the lowest binned valued.
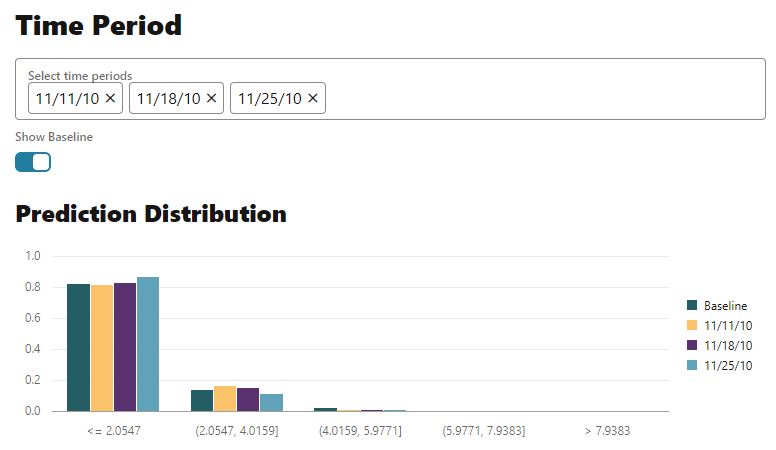
Figure 7 – Selected model (neural network) prediction distribution per selected time periods
If data monitoring was specified, you will also see a chart comparing predictive impact against drift importance. This helps you understand which features are most impactful and how these drift over time by selecting data from different time periods. In the following, you can see that the feature GLOBAL_INTENSITY has the maximum impact on the selected model compared to the others.
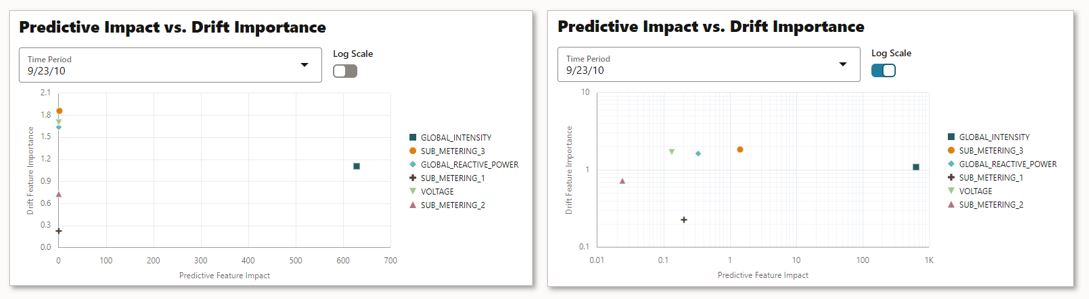
Figure 8 – Selected model (neural network) predictive impact versus drift importance per feature (linear and logarithmic scales)
Each of these capabilities enables you to gain insight into potential model quality issues that may require additional investigation or rebuilding models.
OML Services supports MLOps
The OML Model Monitoring UI is built using OML Services monitoring REST API on Autonomous Database. OML Services makes it easy to manage and deploy machine learning models using asynchronous REST endpoints. OML Services supports key elements of your MLOps requirements with model management, deployment, and monitoring, while benefiting from system-provided infrastructure and an integrated database architecture. In addition, both data and model monitor jobs produced using REST endpoints can be explored using no-code user interfaces.
The model management and deployment services enable you to deploy in-database machine learning models built using Oracle Database and Autonomous Database. OML Services supports models from the in-database classification, regression, clustering, and feature extraction ML techniques. OML Services also enables deploying third-party models exported in ONNX format, which may have been produced separately from packages such as TensorFlow, PyTorch, and scikit-learn, among others.
OML Services enables scoring/inferencing for streaming and real-time applications. And, unlike other solutions that require provisioning, configuring, and managing VMs for 24-by-7 availability with corresponding container configuration and maintenance, OML Services is included with Oracle Autonomous Database, so users pay only for the additional compute when producing actual predictions.
For more information
- OML Model Monitoring documentation
- OML Data Monitoring documentation
- OML Services documentation
- Oracle Machine Learning home page
- ADB Getting Started
Try the new Model Monitor UI on Oracle Autonomous Database using your own tenancy, Always Free access, or via the OML Fundamentals hands-on workshop on Oracle LiveLabs.