We are pleased to announce the availability of Oracle Machine Learning Data Monitoring User Interface on Oracle Autonomous Database. OML Data Monitoring UI is a no-code user interface that provides insight into how your enterprise data evolves over time. Data monitoring is a powerful tool to help ensure data integrity for your enterprise applications and dashboards. Quickly and reliably identify data drift and gain insight into individual data features (columns) and their interactions. This enables data stewards to take corrective action before data issues have a significant negative impact on the enterprise.
What is data monitoring and why is it important?
In data-driven enterprises, you need to know if there are significant changes in your data over time—or “drift”— as this can impact analytical dashboard correctness, data and result interpretability, and machine learning model accuracy. At one level, data drift is simply a change in the properties of your data, which can occur abruptly or gradually and be persistent or transient. Drift can result from a variety of reasons: changing business environment such as legal or governance changes; evolving customer behavior and interests such as changes in customer preferences and regional trends; modifications to data from third-party sources such as changes or extensions to content; data quality issues such as incorrect or missing data; and issues in upstream data processing pipelines such as sensor mechanical wear and tear. Additionally, data monitoring is also useful in a machine-learning context, where significant changes in data may warrant rebuilding machine learning models to address loss in predictive accuracy. Data monitoring is based on the idea that a business task relies on well-understood data referred to as the baseline dataset and periodic subsequent test datasets that are compared against that baseline.
Introducing OML Data Monitoring UI
OML Data Monitoring UI uses machine learning approaches to identify changes in data as well as features that contribute to that change. In part, this alerts users when the properties of a given dataset deviate beyond a user-specified threshold. It can also identify changes in a dataset such as non-stationary data (unforecastable data) or shifts in interactions between columns or data features. When OML Data Monitoring UI identifies significant differences, these are flagged for you to investigate possible causes and whether they are a cause for concern.
OML Data Monitoring UI makes it easy to set up monitors on a recurring schedule to assess data quality by comparing and tracking data changes over time. Designed as an easy-to-use no-code user interface, it’s built using the REST data monitoring API of OML Services. With OML Data Monitoring UI, you define a data monitor by specifying a monitor name, the baseline data and new data, repeat frequency, starting time, among other options, as shown below.
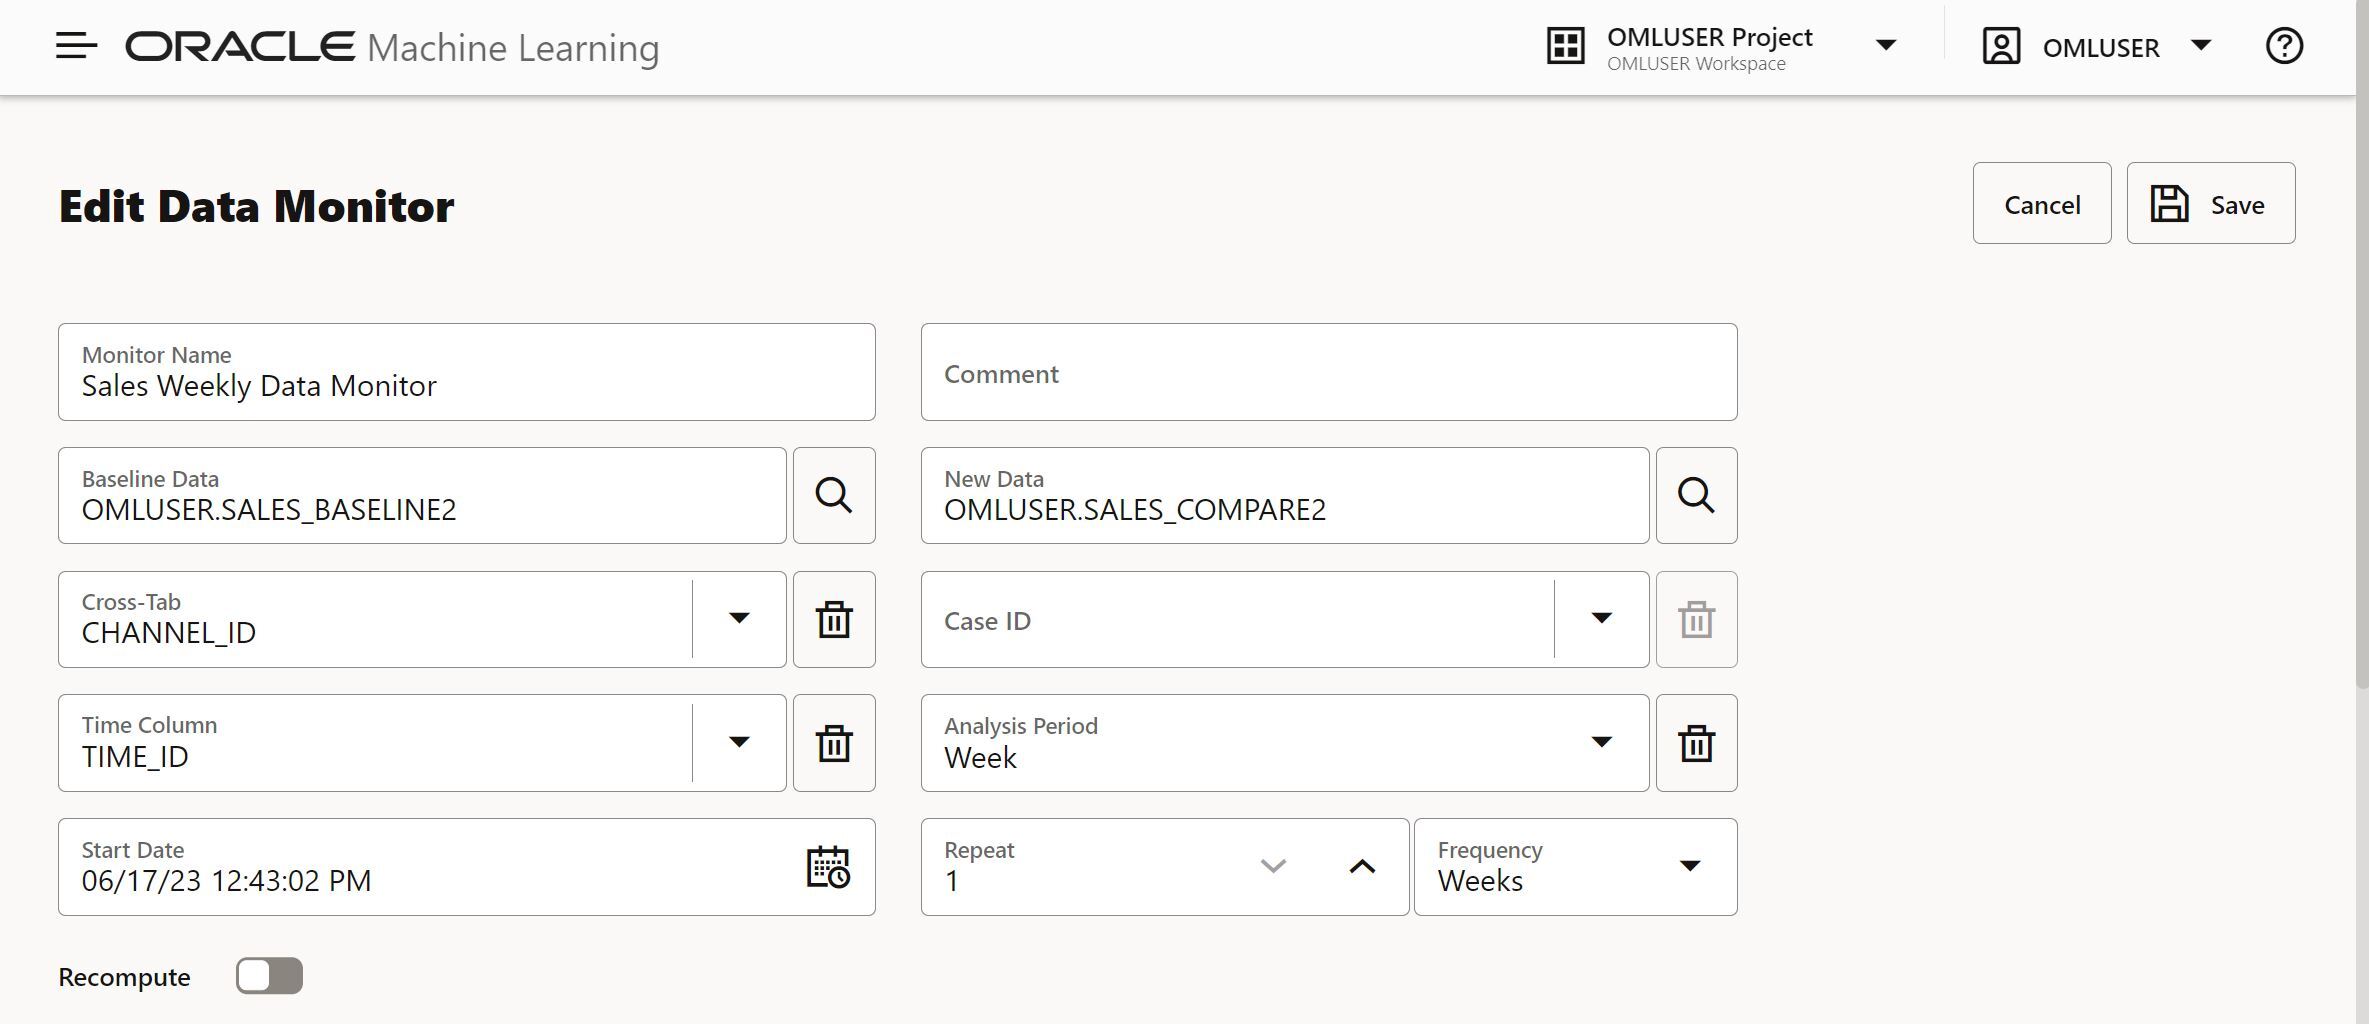
You can start a monitor immediately or wait for its scheduled run time. You have the option to recompute all previous results or only assess the new data. After each run, you have access to visualizations that highlight changes in data statistics through simple and easy to interpret charts. Drift detection can be calculated over multiple time periods at once, for example, monitoring for drift each month in a dataset that contains multiple months of data. Each month of data would be compared independently against the baseline data to identify potential drift. Additionally, data can be added dynamically to the new dataset, so as data grows over time new observations can be included in the monitoring.
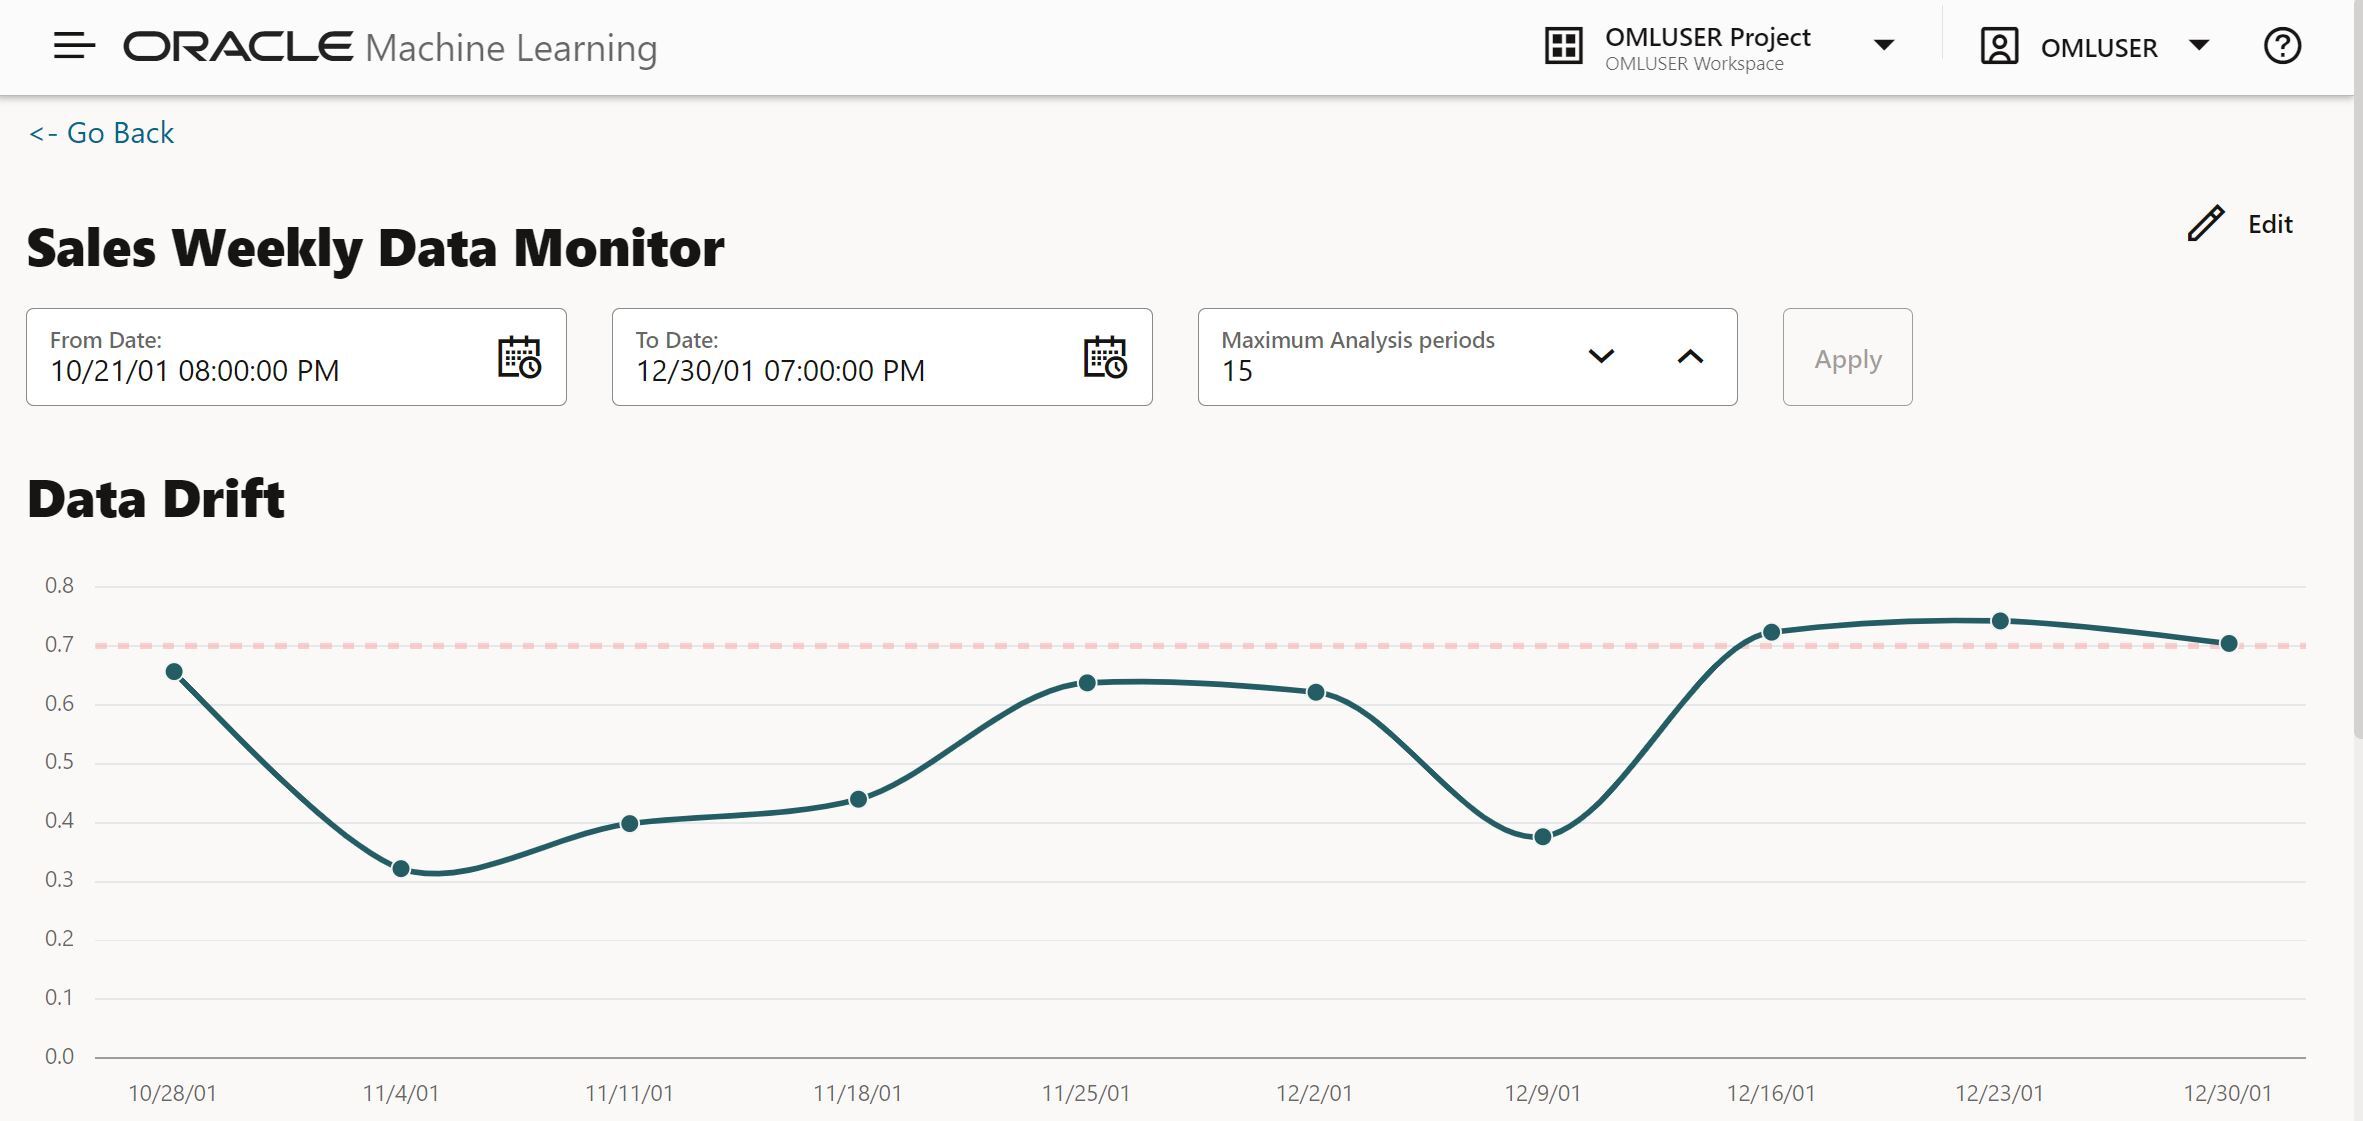
As shown below, you have an easy-to-interpret visualization of the drift metric, which is measured on a 0-1 scale, and whether it surpasses your specified threshold. A zero score means that the model cannot discriminate at all between the datasets, and a score of 1 means that it can perfectly discriminate.
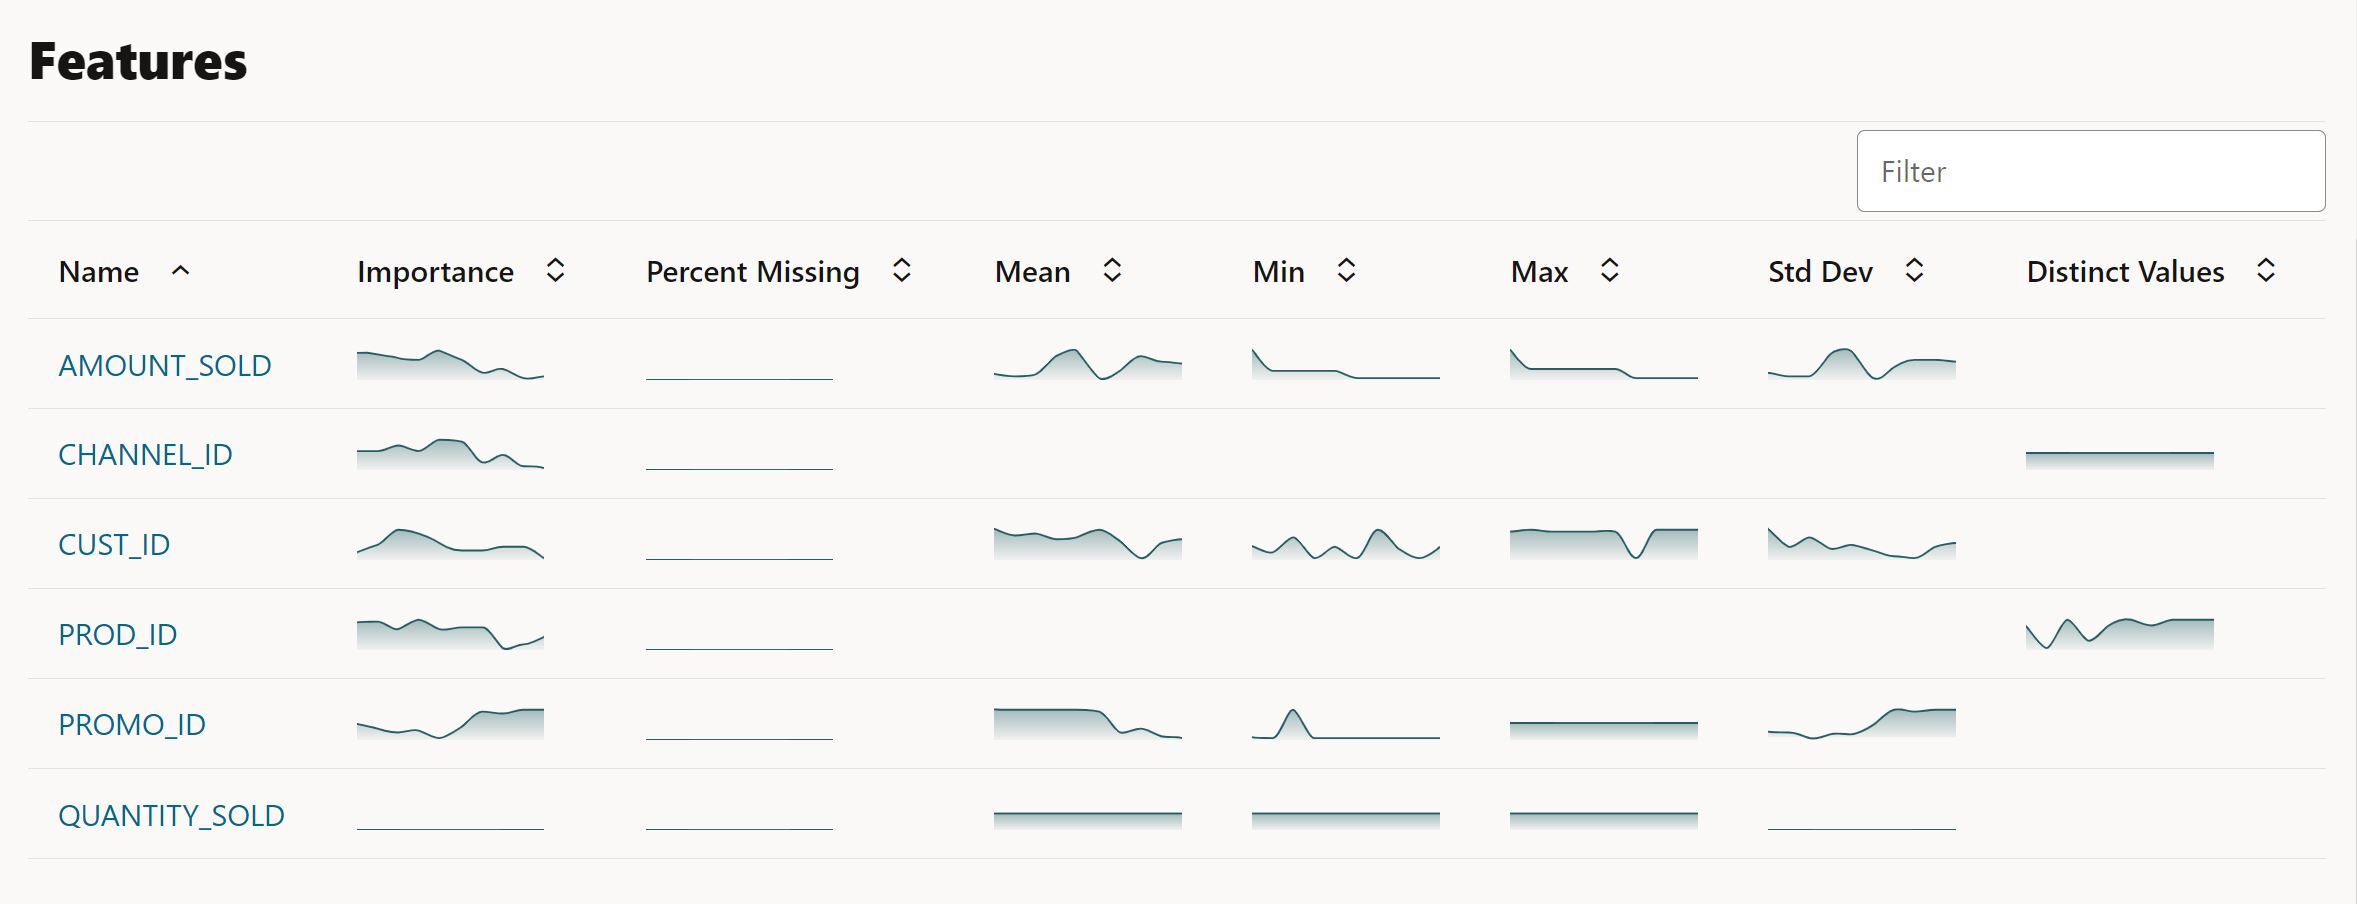
On the same page, you also see plots of individual columns statistics such as mean, standard deviation, min, max or, for categorical columns, the number of distinct values. There is also an importance value, which conveys the impact that changes in each column have on predictive model that’s built on the data.
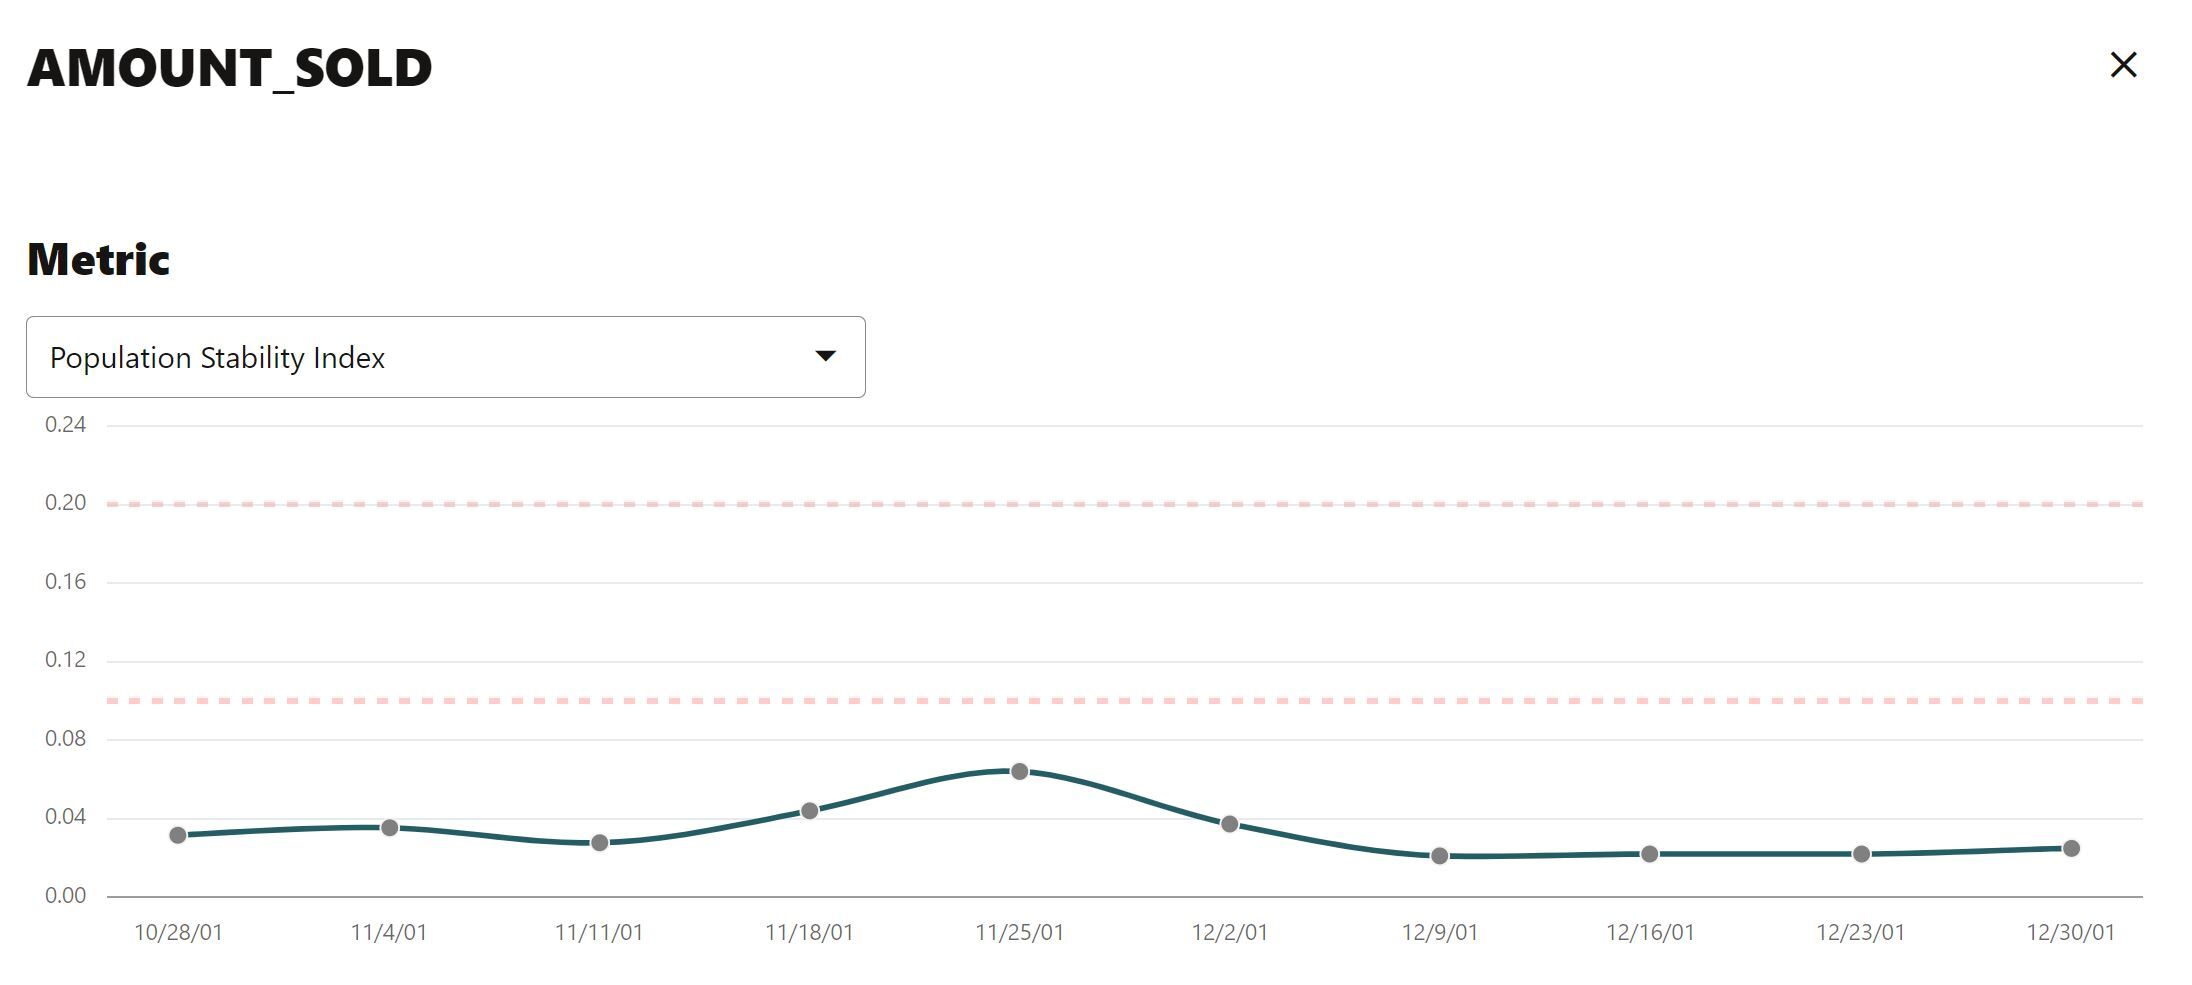
Diving deeper, you can access other details such as measures of distribution comparisons like the population stability index (PSI) and Jenson-Shannon distance (JSD), binned crosstabulations, and distribution visualizations. Below, we’re showing the population stability index for column AMOUNT_SOLD over time, along with a numeric summary of statistics and visual display of the statistics from the baseline and recent test data. If you specify a crosstab column—like the PRODUCT_ID shown here—you get a crosstab table containing the fraction of the distribution across the two columns—depicted as a bivariate heatmap.
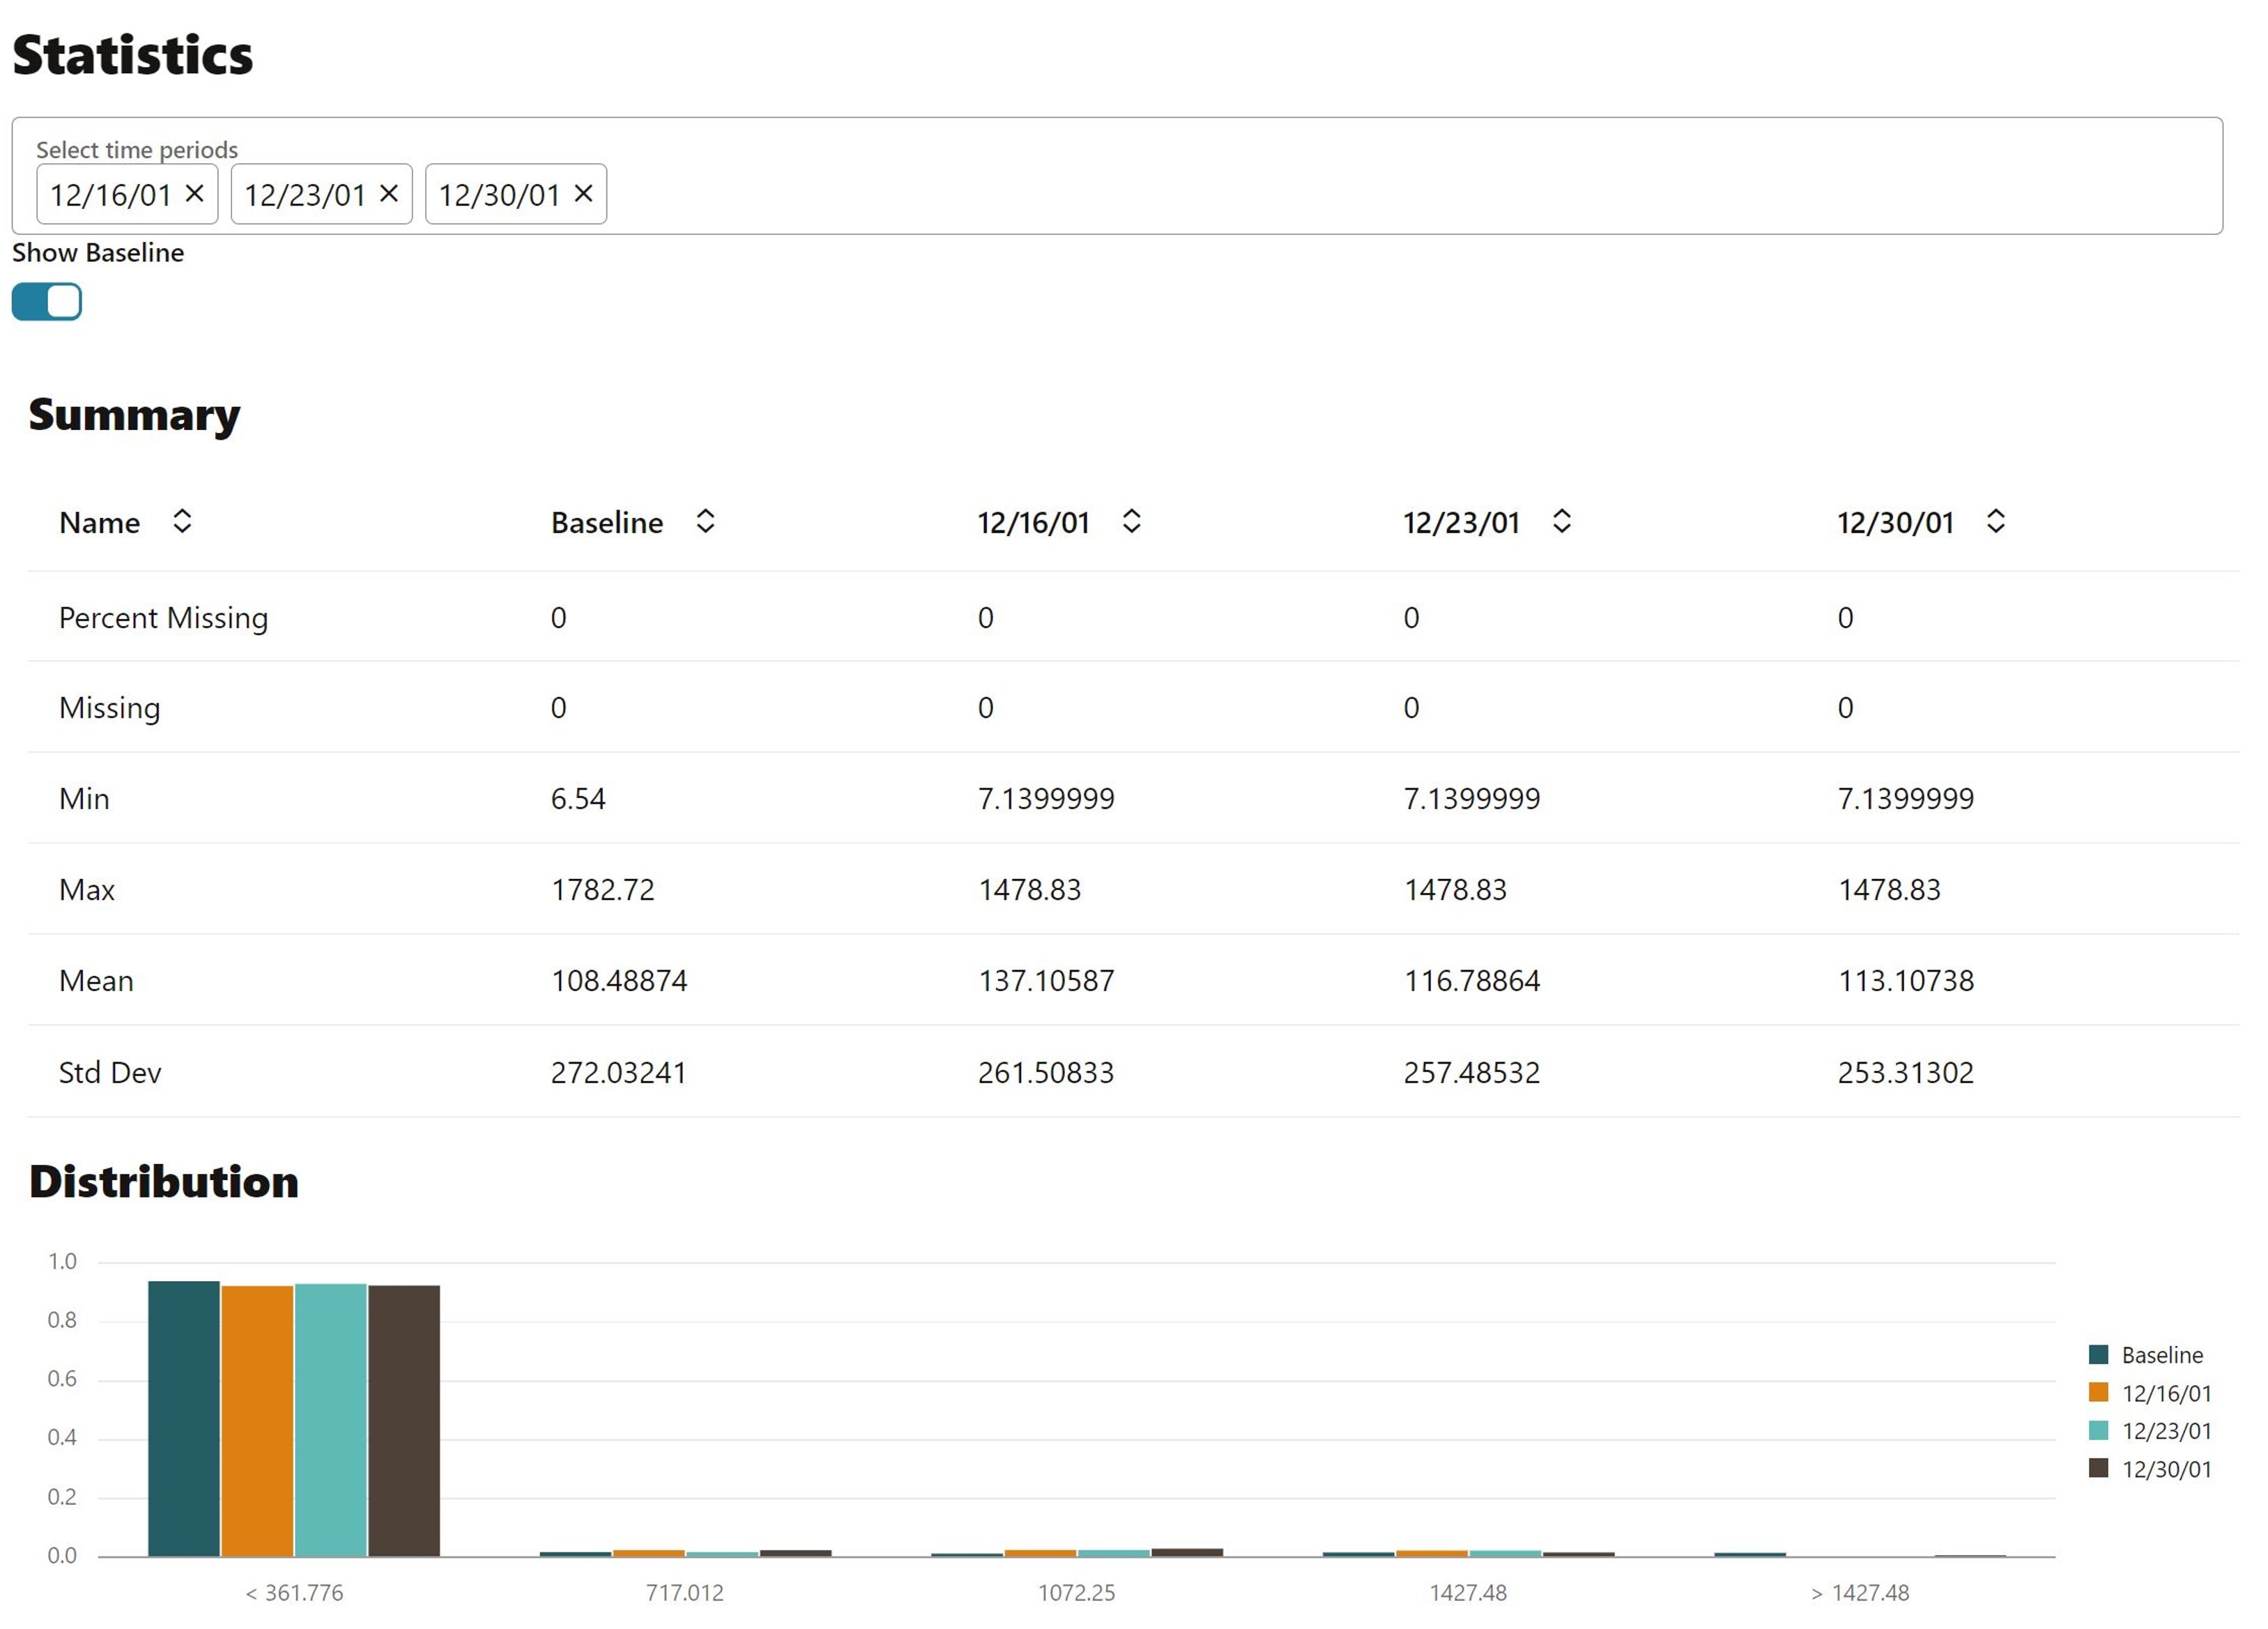
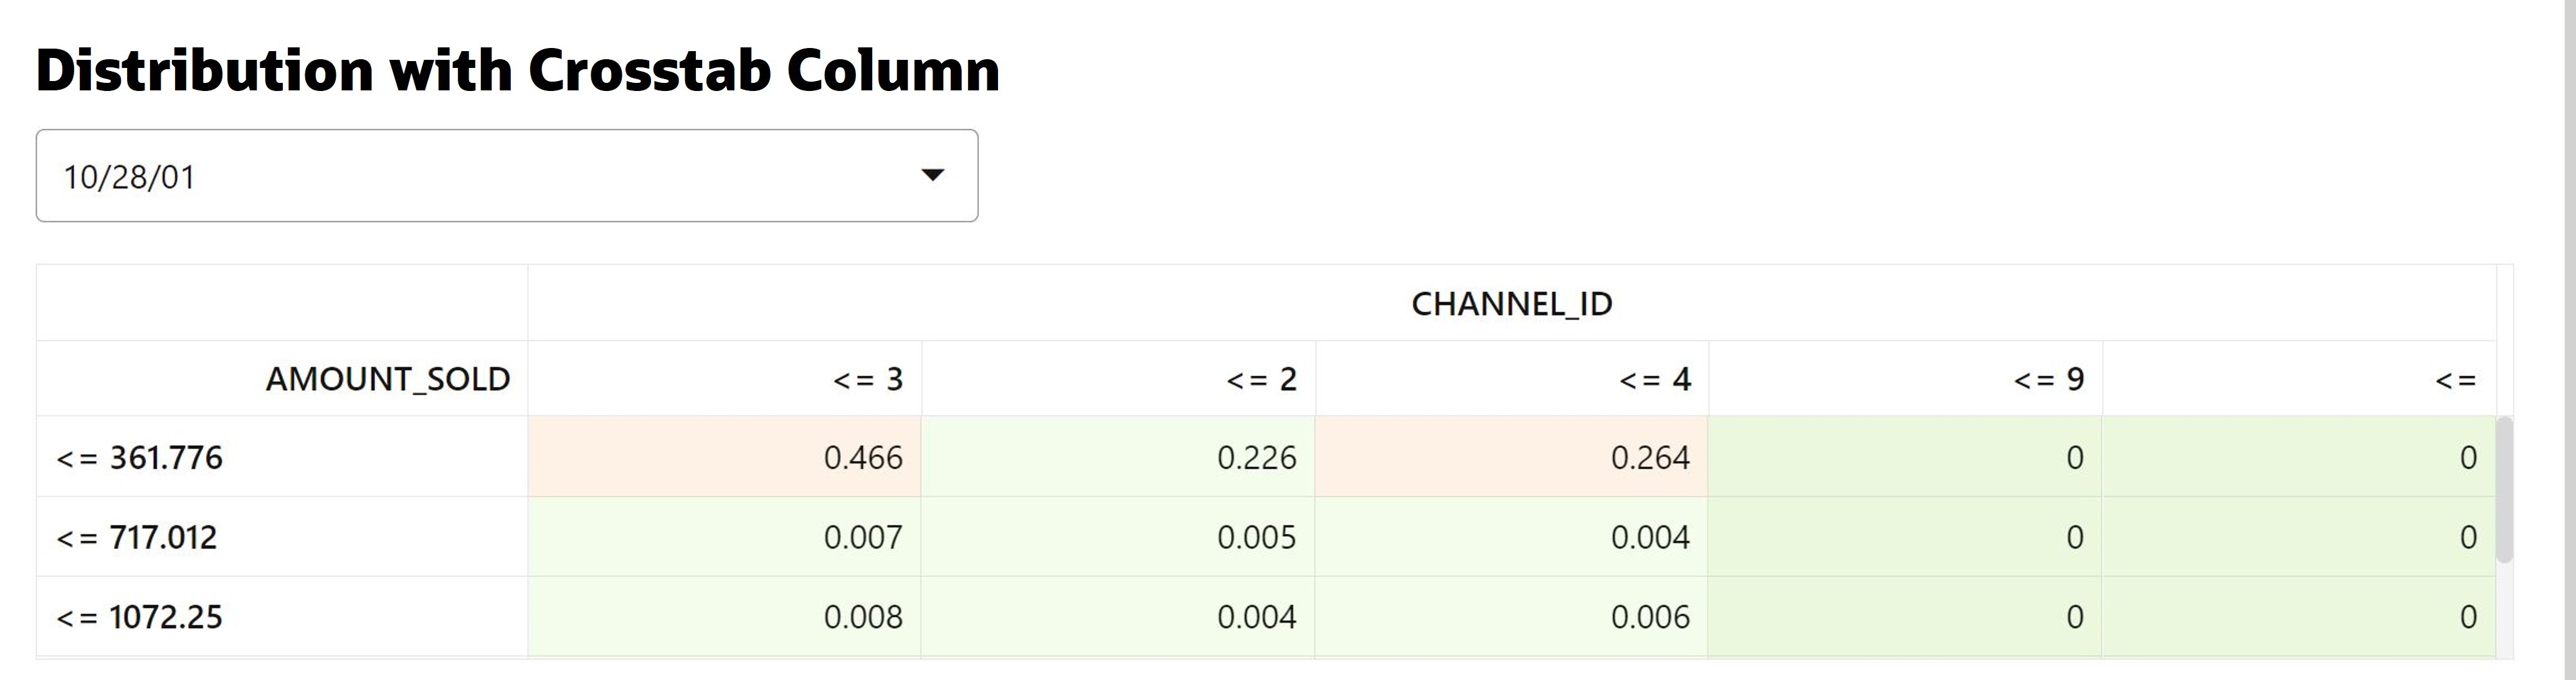
Each of these capabilities provides valuable insights into potential data quality issues that may require additional investigation.
Building on OML Services
The OML Data Monitoring UI is built on top of OML Services on Autonomous Database. OML Services makes it easy for data science teams and application developers to manage and deploy machine learning models using a REST API for ease of application integration. OML Services supports key elements of your MLOps needs with model management, deployment, and monitoring while benefiting from system-provided infrastructure and an integrated database architecture.
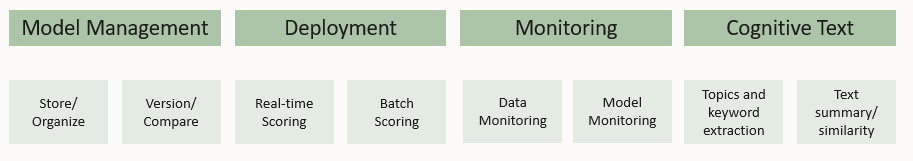
The model management and deployment services enable users to deploy in-database machine learning models built using on-premises Oracle Database and Autonomous Database. It supports models from the in-database classification, regression, clustering, and feature extraction ML techniques. OML Services also enables deploying third-party models exported in ONNX format, which may have been produced separately from packages such as Tensorflow, PyTorch, scikit-learn, among others.
OML Services enables scoring/inferencing for streaming and real-time applications. And, unlike other solutions that require provisioning a VM for 24-by-7 availability with corresponding container configuration and maintenance, OML Services is included with Oracle Autonomous Database, so users pay only for the additional compute when producing actual predictions.
Additionally, OML Services supports cognitive text analytics, like extracting topics and keywords, sentiment analysis, and text summary and similarity.
For more information
See the OML Data Monitoring documentation for additional details. Learn more about Oracle Machine Learning and try OML Services along with this new interface on Oracle Autonomous Database using your own tenancy, Always Free access, or via the OML Fundamentals hands-on workshop on Oracle LiveLabs.