What is data monitoring?
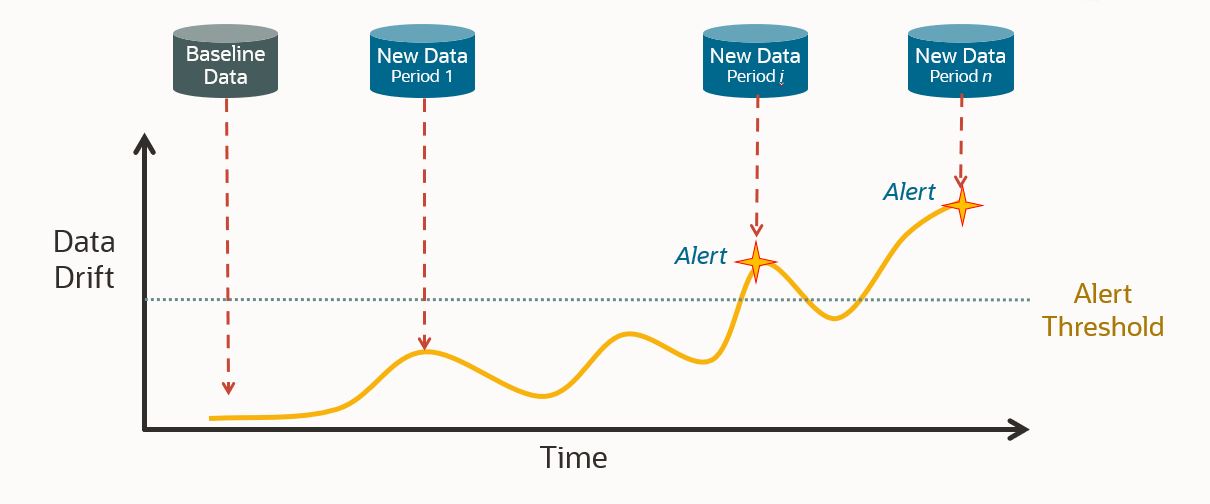
Data monitoring provides insight into and improves our understanding of data as it evolves over time – looking for potential data drift. So, what is data drift? It is simply a change in data, which can occur abruptly or gradually. The world is dynamic, so data can change at any time and for any number of reasons. Possible causes of data drift include a changing business environment, changing consumer preferences, or data quality issues. As a business, understanding when and how your data changes is key to making properly informed decisions and making sure that your business runs smoothly.
Why is data monitoring important?
Data monitoring can alert users to perform an action when the statistical properties of a given dataset drift. There are several use cases that make data monitoring a powerful tool. It can be used to uncover data quality issues. It can also identify changes in a dataset such as non-stationary data (unforecastable data) or shifts in interactions between features. Additionally, data monitoring is useful in a machine-learning context. Model monitoring is a task that tracks the degradation of model prediction quality over time. By pairing data and model monitoring, a user can understand how changes in data are impacting model prediction quality. This makes data monitoring a prerequisite to effective model monitoring, but it also has extensive utility outside of a machine-learning context.
How does OML Services record data drift?
Luckily for Oracle Machine Learning users, data monitoring is a new feature available through Oracle Machine Learning Services. So how exactly does this new feature calculate data drift? It does so by comparing a baseline dataset to new data. The data monitoring algorithm creates a machine learning model to try and identify differences between the baseline and new data. The amount of drift that has occurred is measured by the accuracy with which the model is able to discriminate between the two datasets, that is, tell which dataset a given record belongs to. This ability is interpreted as drift, which is measured on a 0-1 scale. A zero score means that the model cannot discriminate at all between the datasets, and a score of 1 means that it can perfectly discriminate. Drift detection can be calculated over multiple time periods at once, for example, monitoring for drift each month in a dataset that contains multiple months of data. Each month of data would be compared independently against the baseline data to identify potential drift. Additionally, data can be added dynamically to the new dataset, so as data grows over time new observations can be included in the monitoring.
On top of the data drift measurement, data monitoring provides further information about the data. This includes an importance value that tells how impactful changes in each column would be to a predictive model built on the data. Additionally, data monitoring results include feature metrics for each column that describe a variety of information about it. These metrics include numerical statistics like mean, standard deviation, min, max, or number of unique values for categorical columns. It also includes histograms of the data to aid in visualization. It includes measures of distribution comparisons like the population stability index (PSI) and Jenson-Shannon distance (JSD). All this information that is given in addition to the drift measure gives users a more complete picture of exactly how their data is drifting.
Walkthrough of Data Monitoring with OML Services
Now we are going to walk through an example using this new data monitoring feature in OML Services. The example will look for drift in a dataset of electricity consumption over 4 years. OML Services supports a REST interface, and it is helpful to use an API platform, like Postman. We use Postman in this blog, and it’s available for download here. A collection of Postman requests for data monitoring can be found in our Github repository. If you prefer to use a terminal, a collection of cURL requests for data monitoring can be found in our data monitoring example notebook in the examples section of OML, or in our GitHub repository. We recommend you use these collections when you create your own requests, as using them will be much easier than building requests from scratch. Once you have gained familiarity with these requests, you will likely want to make these calls from code. Conveniently, Postman allows you to export your request in many common coding languages and frameworks.
Postman gives you the ability to store environment variables for use in your requests. When setting up the environment, store the following values before using the provided Postman requests:
- Omlserver is the base url of your OML instance. This is the url you use to access the notebook environment excluding the path.
- Username is the username used to log into your OML instance.
- Password is the password used to log into your OML instance.
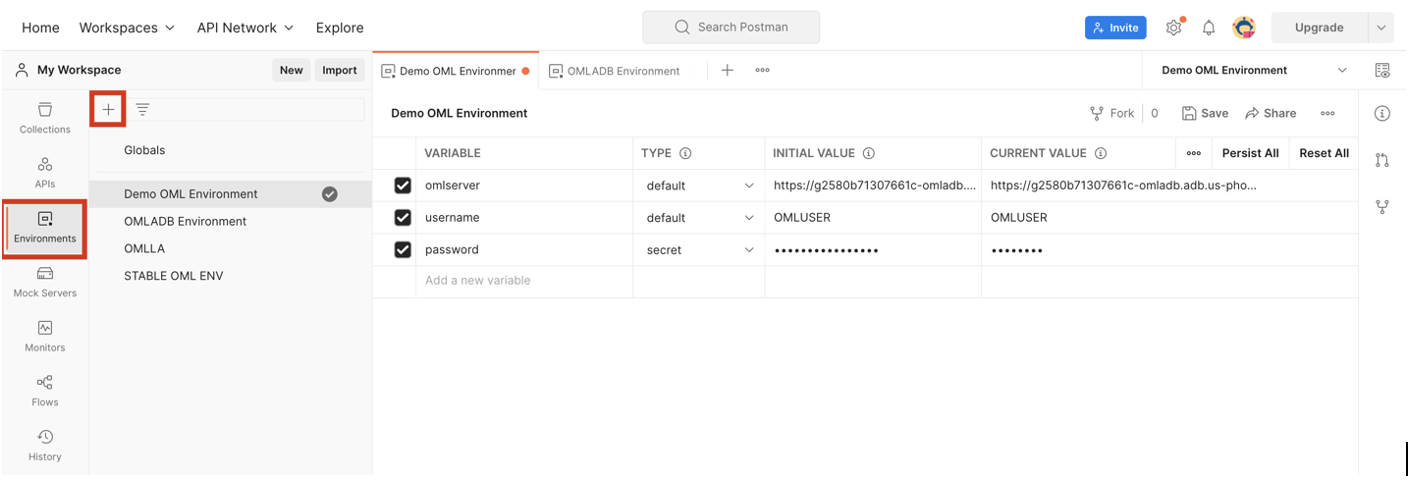
These variables can be used in your Postman requests by placing the variable name in double brackets. You will note that throughout this blog, requests will include these bracketed variables. If you choose not to use variables, replace these with their actual values. If you are using a terminal instead of an API platform, it’s helpful to store these values as environment variables.
Step 1: Get Access Token
Before sending requests to create your data monitoring job, we need to get an access token from OML Services. To do so, we send a request to the /omlusers/api/oauth2/v1/token endpoint. The omlserver, username, and password variables are used here.
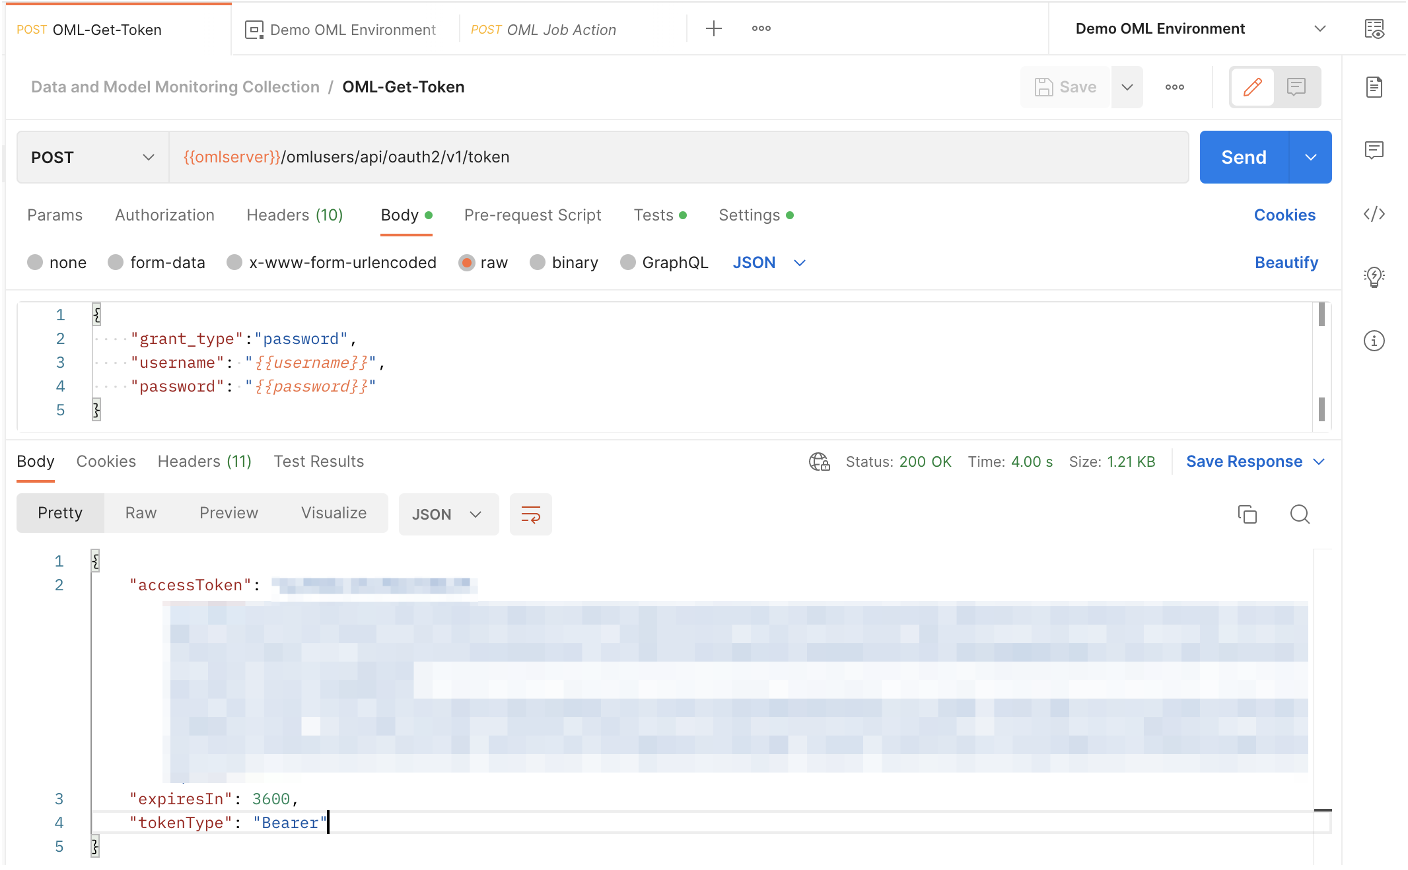
Note the response at the bottom of the image, which includes the access token (blurred in image). This token is another value that is convenient to save as an environment variable. In all requests that use this token for authentication, you must go to the Authentication tab, set the type as Bearer Token, and specify this as the token being used. If you are using the Postman collection provided for this blog, then all requests in that collection will automatically use this token for authentication.
Step 2: Create a data monitoring job
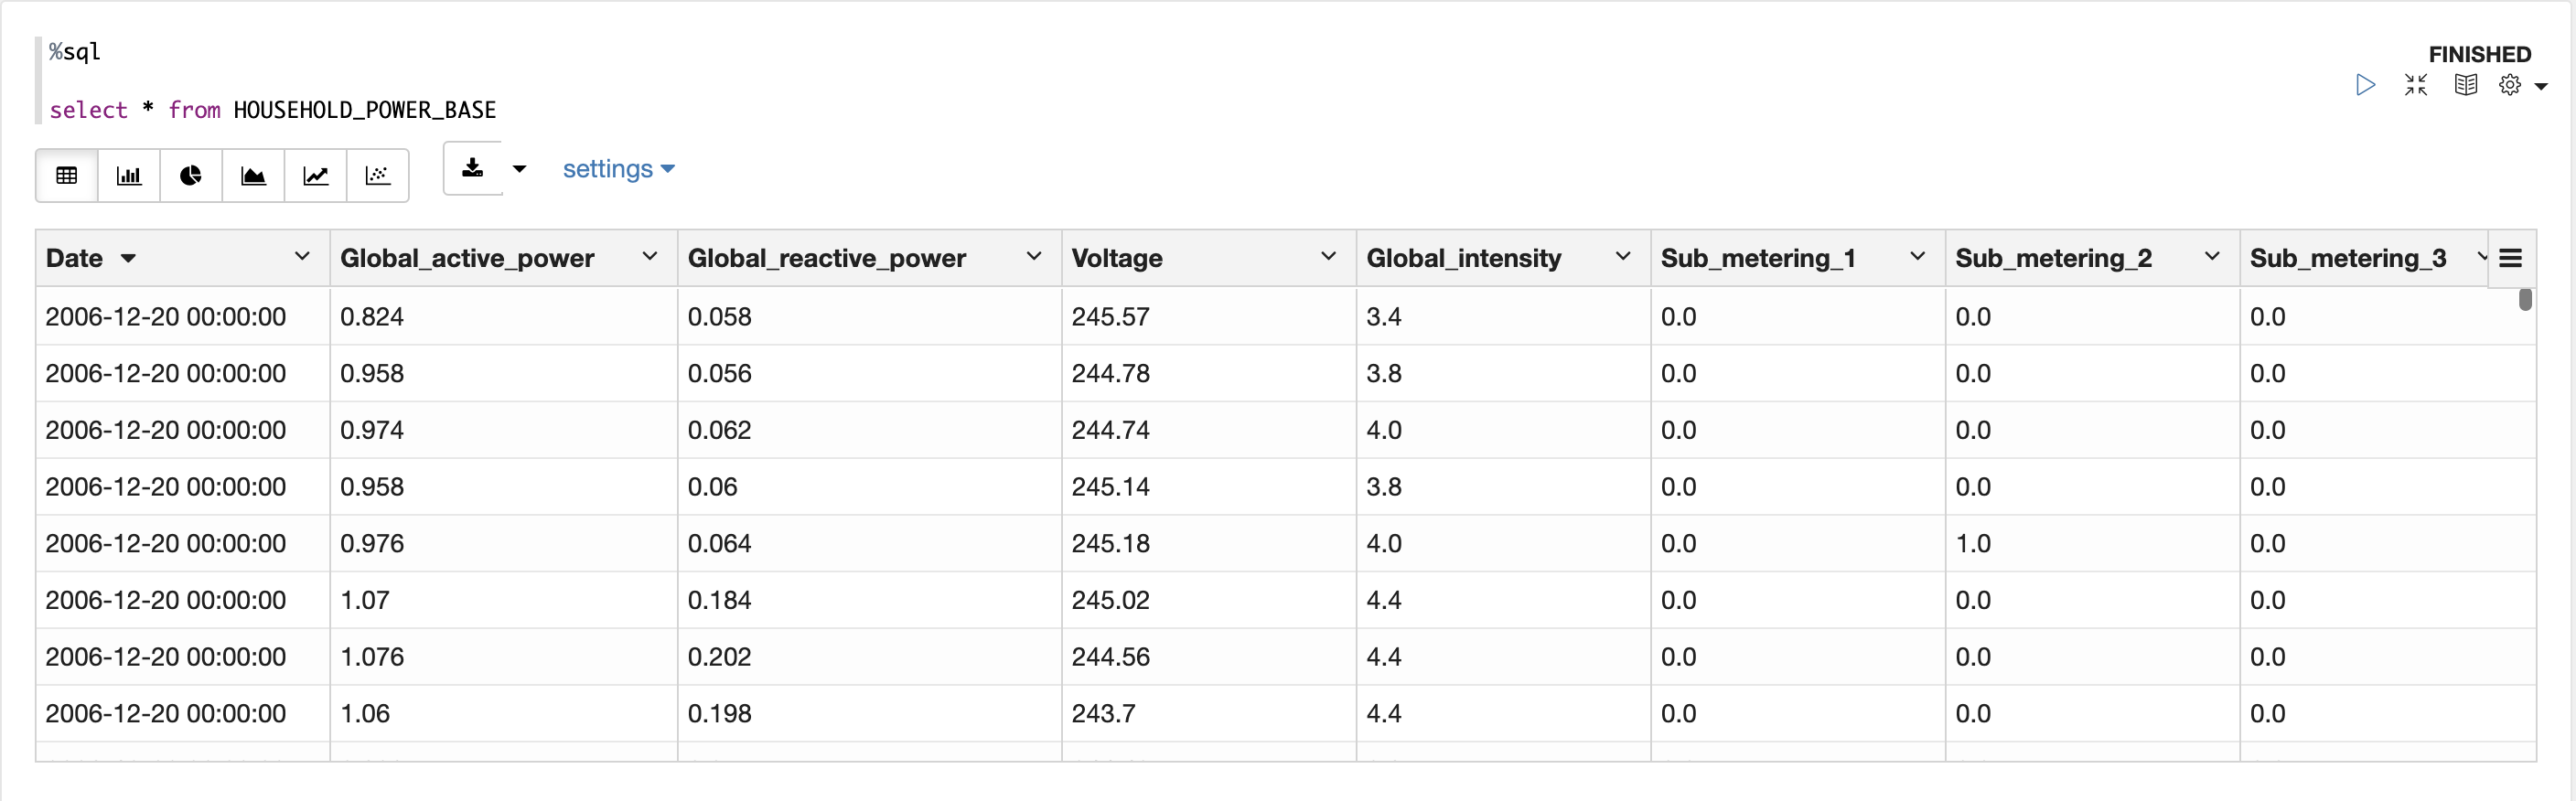
Now that we have an access token, we can send requests to OML Services. Let’s look at the data we are going to monitor. This household electricity consumption dataset includes various consumption metrics of a household from 2006 to 2010. SUB_METERING_1 corresponds to the kitchen, SUB_METERING_2 to the laundry room, and SUB_METERING_3 to an electric water heater and air conditioner. Our goal is to understand if and how household consumption has changed over the 4 years.
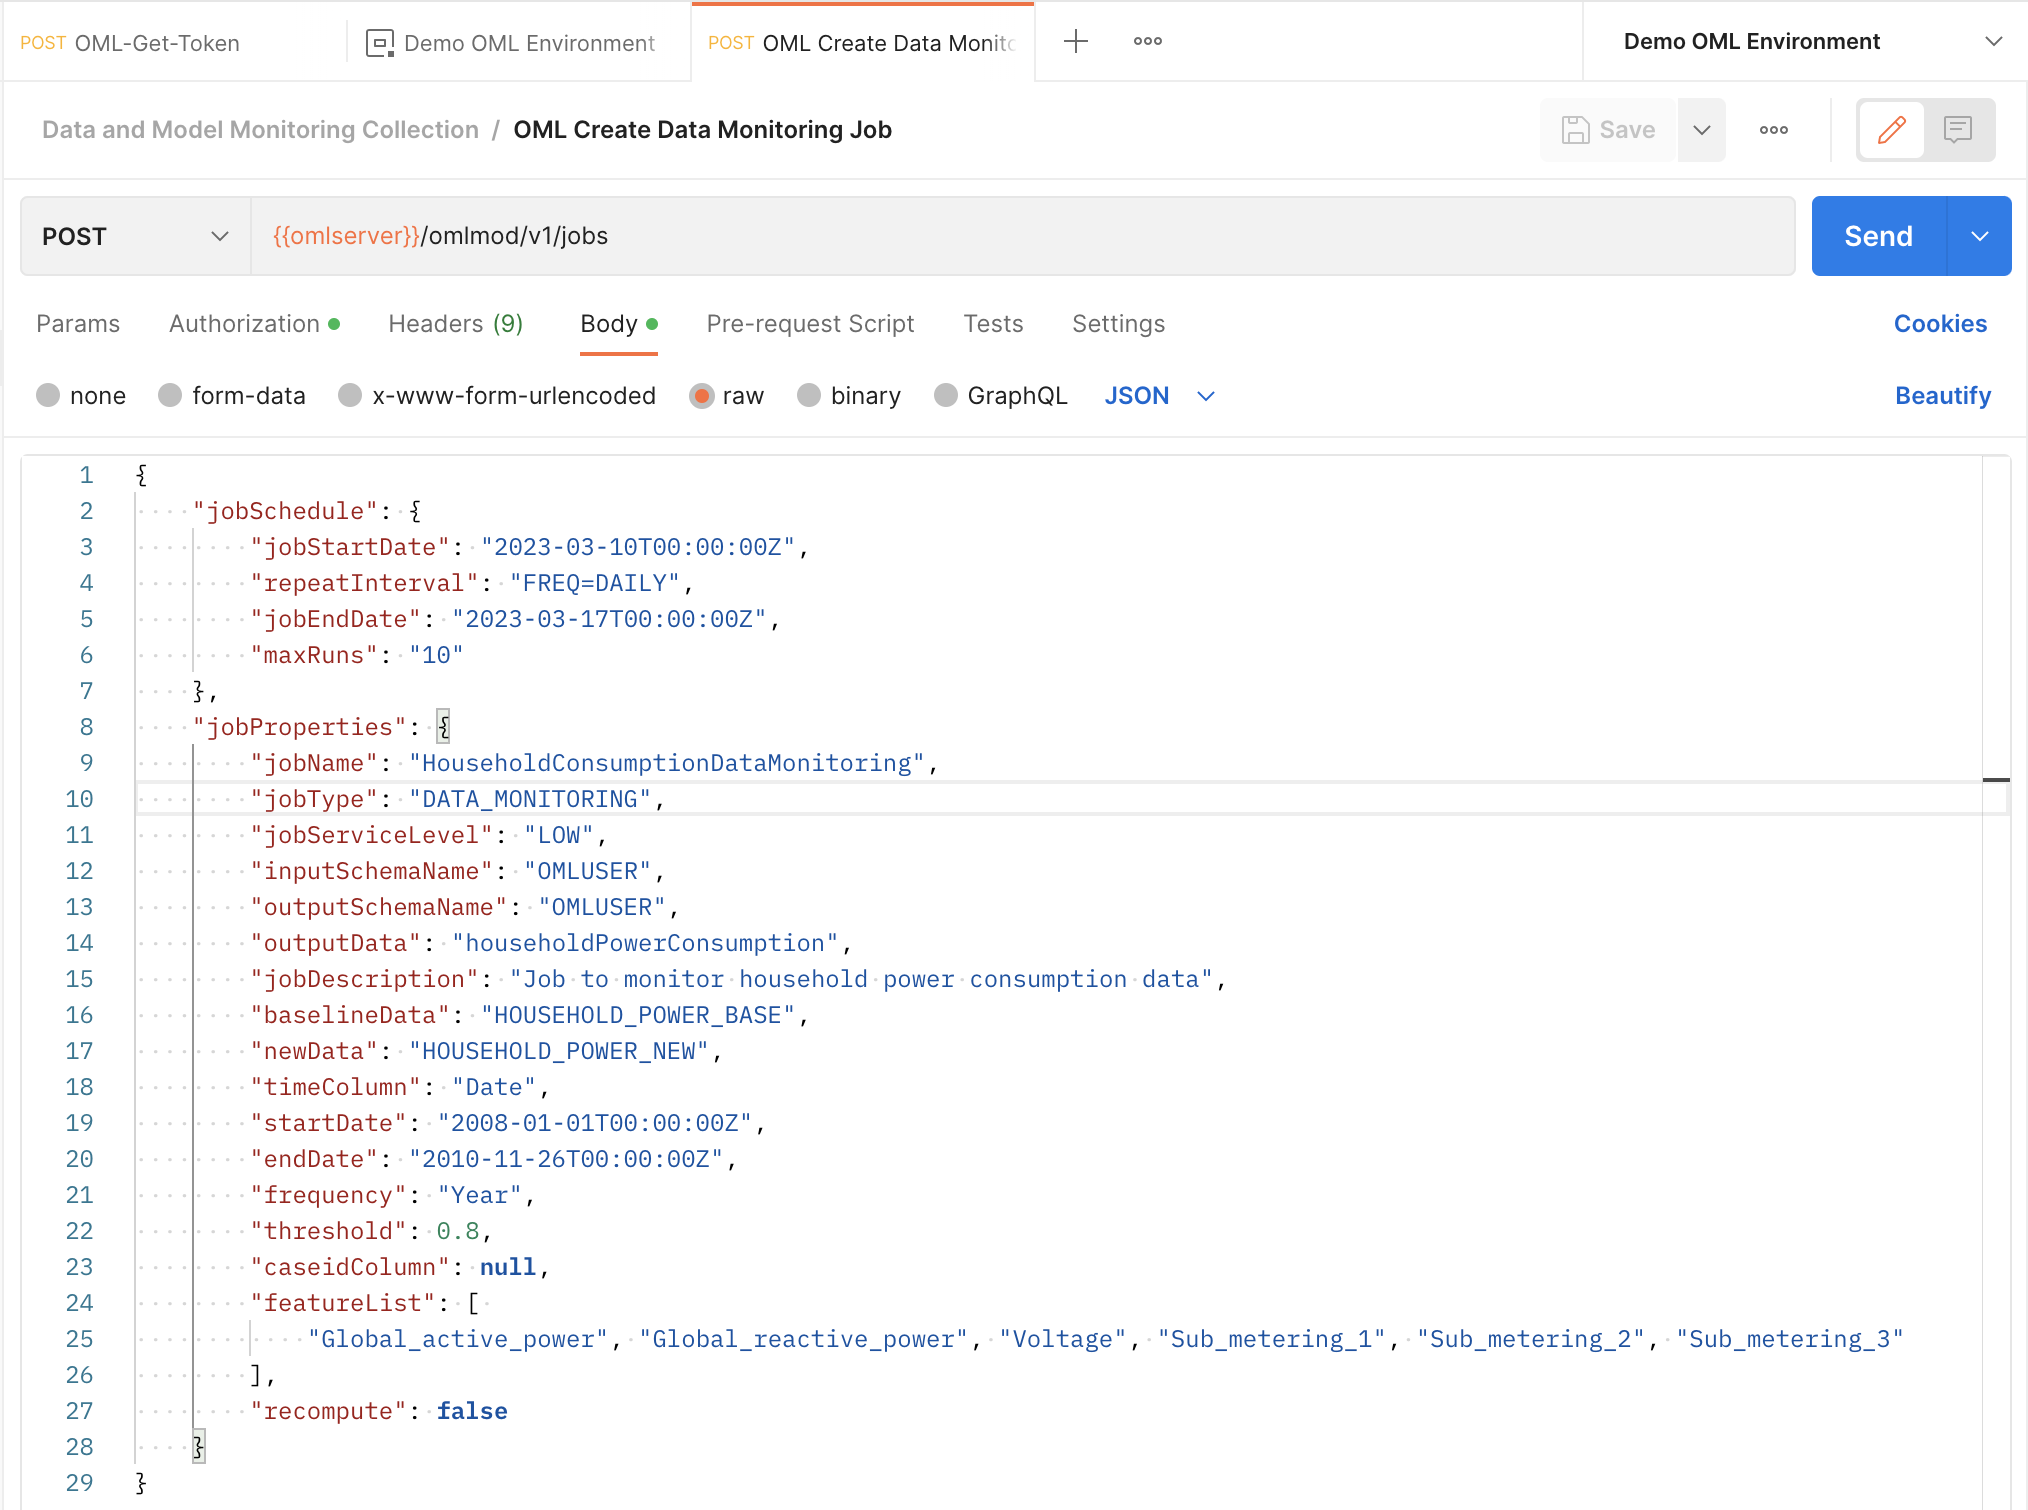
Now let’s create the data monitoring job request. This request will be sent as a POST request to the /omlmod/v1/jobs endpoint. There are many parameters that can be specified for a data monitoring job. Below is a listing of the required parameters. To learn about all the optional parameters, check out the documentation.
Required:
- jobName specifies the name of the job.
- jobType specifies the type of job to be run and is set to DATA_MONITORING for data monitoring jobs.
- outputData is the output data identifier. The results of the job will be written to a table named {jobId}_{ouputData}.
- baselineData is A table or view name that contains baseline data to monitor. At least 50 rows per period are required for monitoring, otherwise analysis is skipped.
- newData is a table or view name with new data to be compared against the baseline. At least 50 rows per period are required for monitoring, otherwise analysis is skipped.
For this request, we must divide our data into a baseline dataset and a new dataset. We will use data from 2006 and 2007 as our baseline and monitor data from 2008 to 2010. The time column is irrelevant in the baseline data, but in the new data it will be used to segment our monitoring by year. Here is what the request looks like:
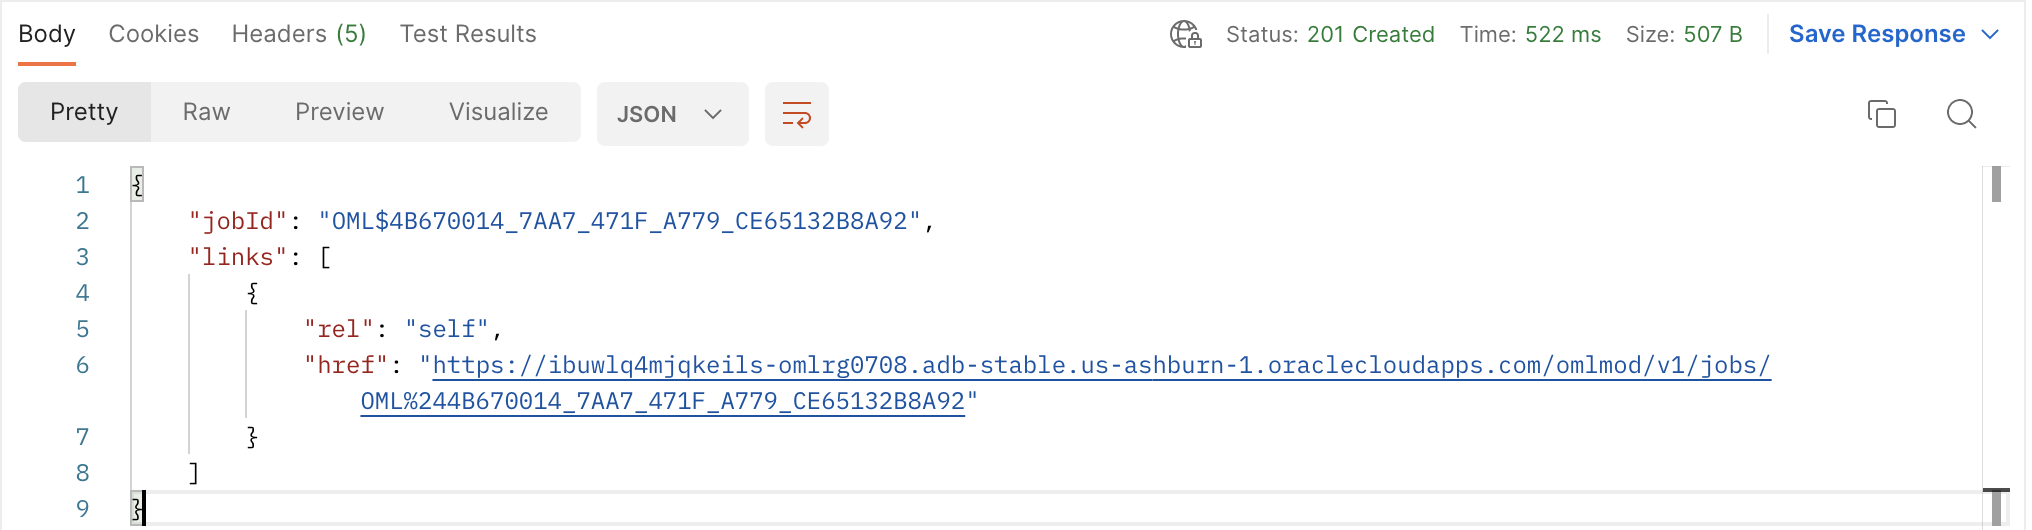
Upon successful submission of your job request, you will receive the following response. Take note of the jobId as you will need to use it to interact with the job, like viewing its details or updating it. We suggest you save it as an environment variable.
Step 3: View your job details
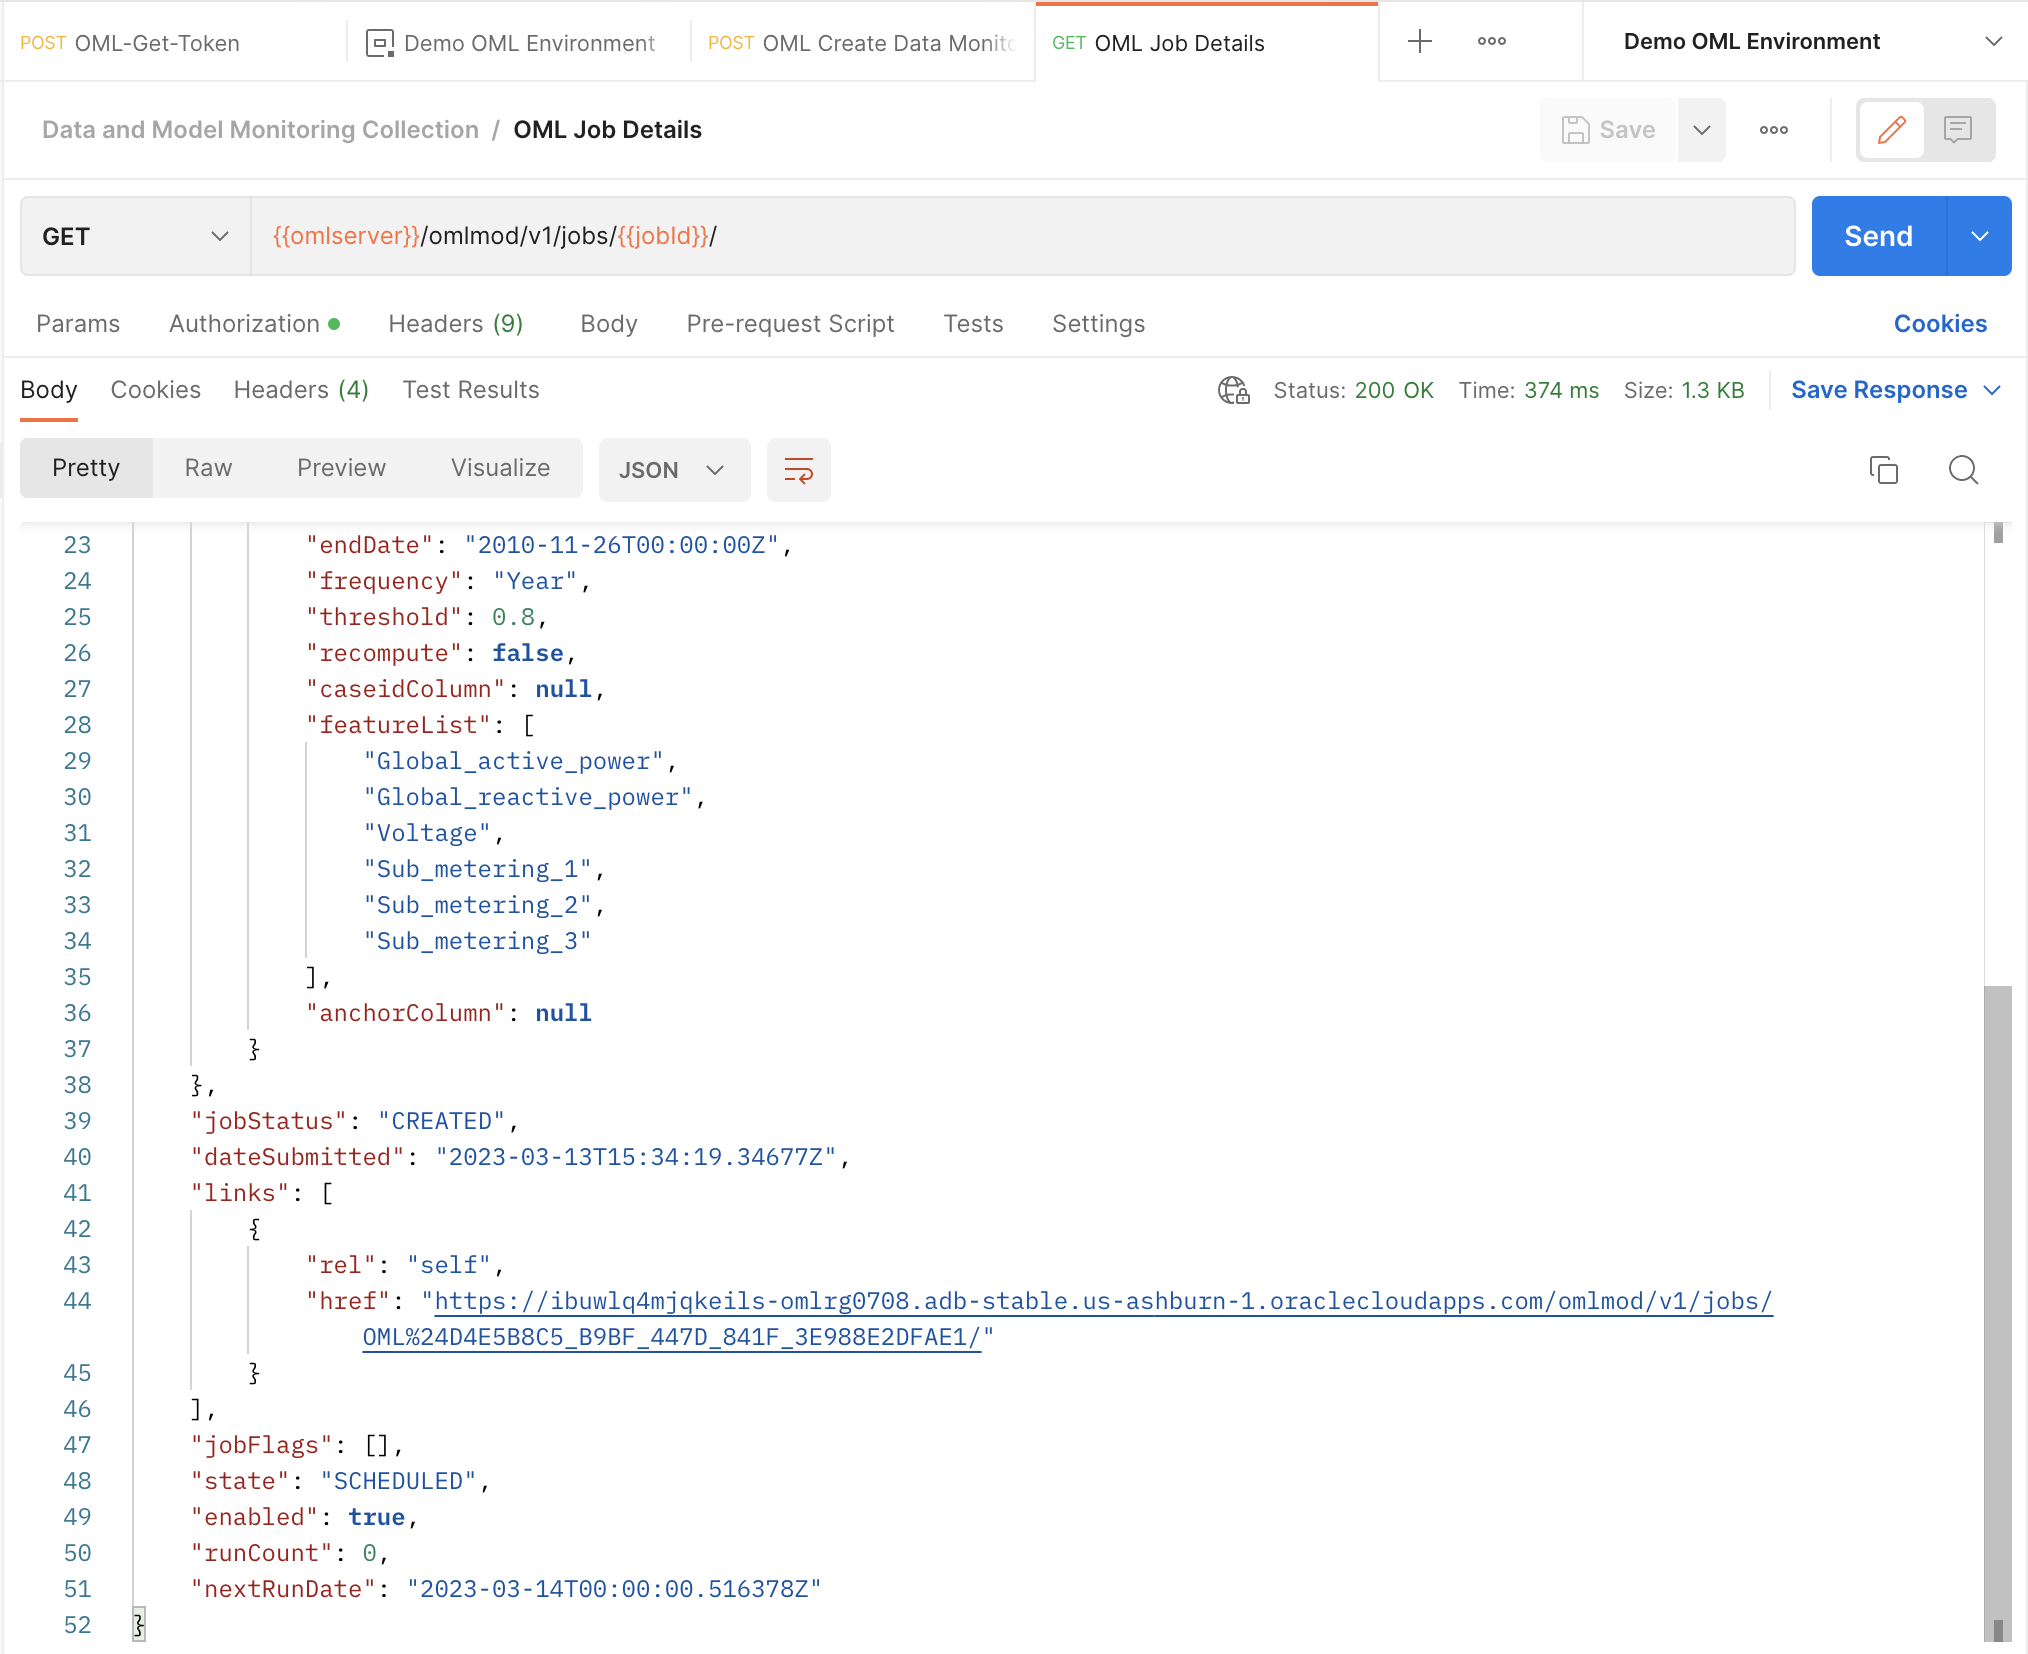
Once the job has been created, we can view its details by sending a GET request to the /omlmod/v1/jobs/{{jobId}}/ endpoint. This shows us the parameters we set in our job request, as well as information about the job’s last run if it ran at least once. By default, the job status is set to ENABLED. This means that the job will run according to the schedule we defined in the request.
Step 4: Update your job
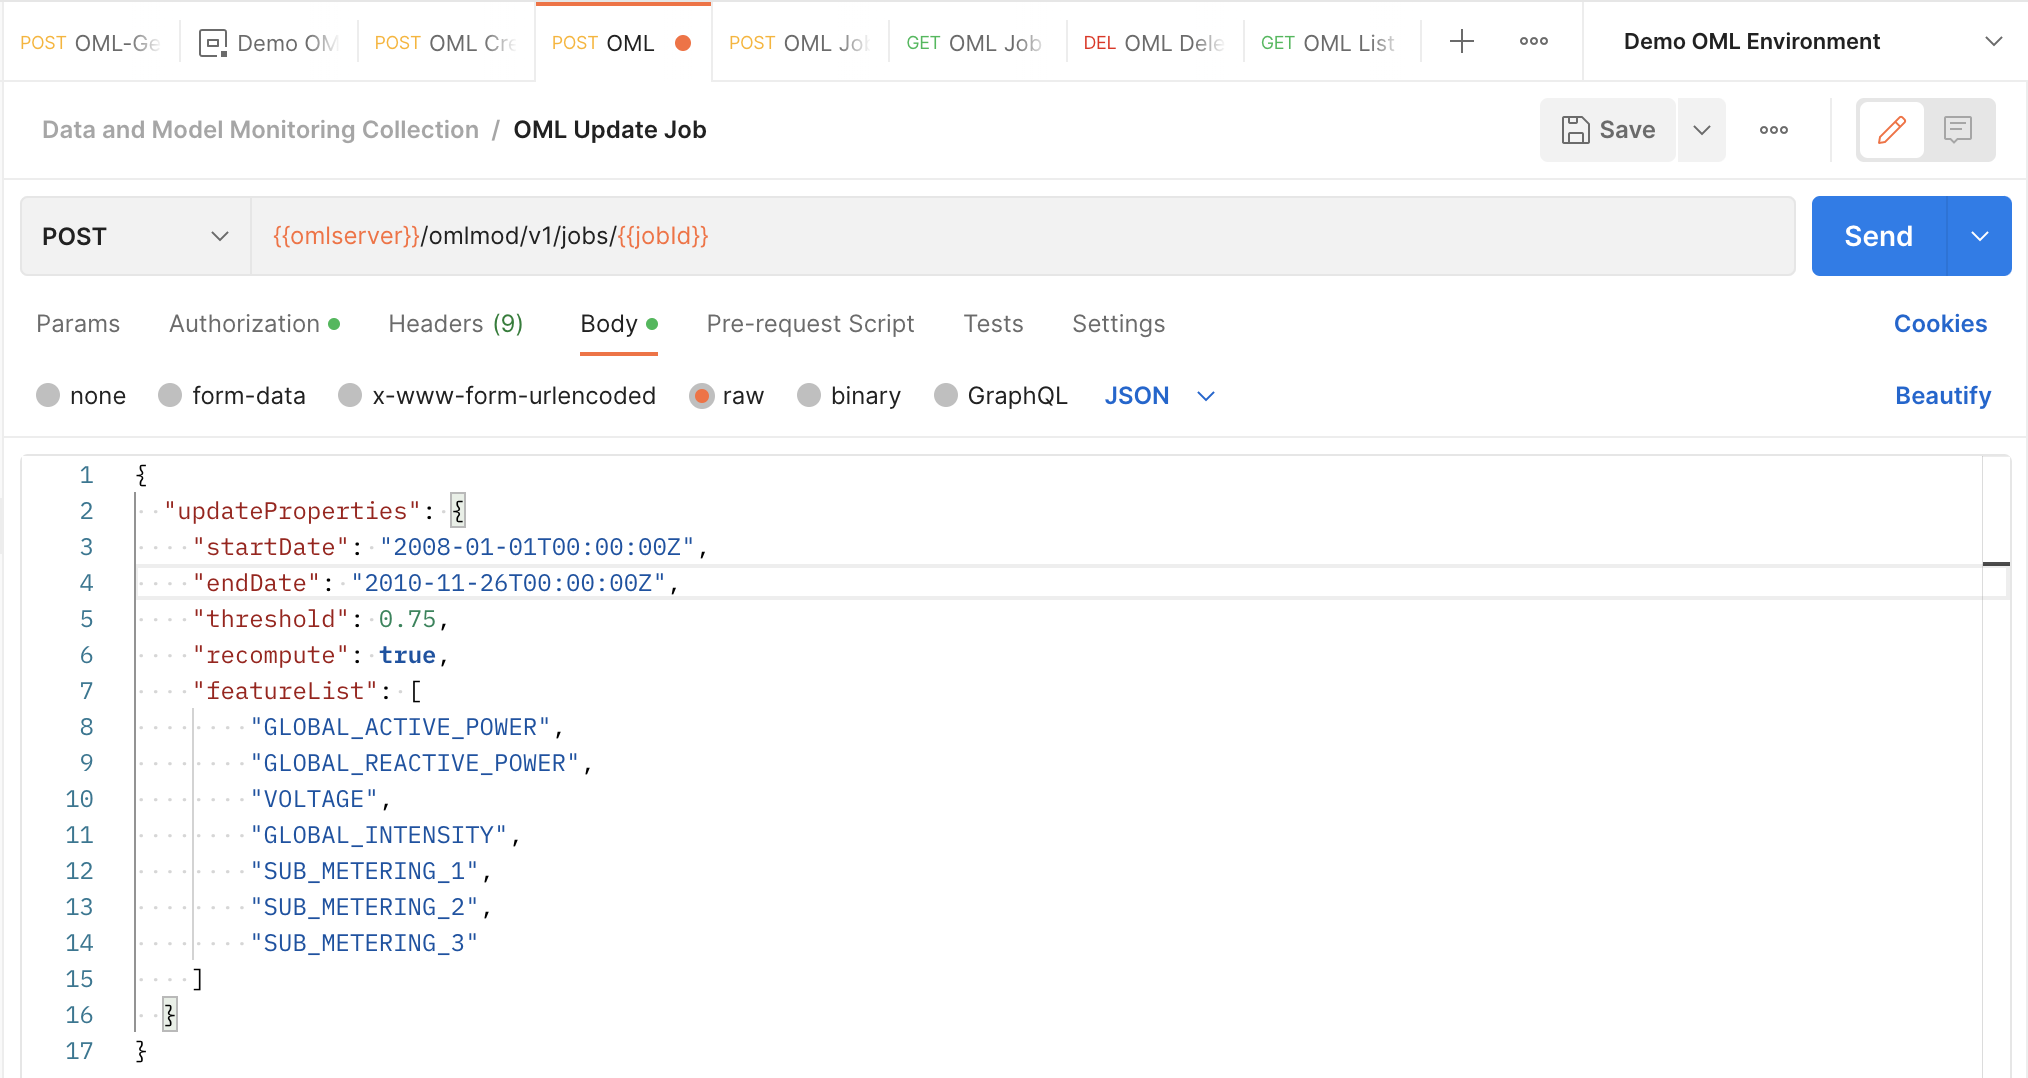
Users have the option to update certain parameters of jobs after submitting a job request. For data monitoring jobs, the following parameters can be edited:
- startDate
- endDate
- threshold
- recompute
- featureList
We want to change a few of the parameters of the request, so we send a POST request to the /omlmod/v1/jobs/{{jobID}} endpoint. A successful request will get a 204 response with no body. This is what the request looks like:
Step 5: Perform a job action
Users can also perform actions on their jobs. The following actions can be performed on a data monitoring job:
- RUN will immediately run the job once. Good for testing job behavior.
- DISABLE will change the job state from ENABLE to DISABLE. This means that the job will no longer run according to its schedule but can still be run using a RUN action request.
- ENABLE will change the job state from DISABLE to ENABLE, allowing it to run according to its schedule again.
- STOP will stop a currently running job. An error will be returned if the job is not running.
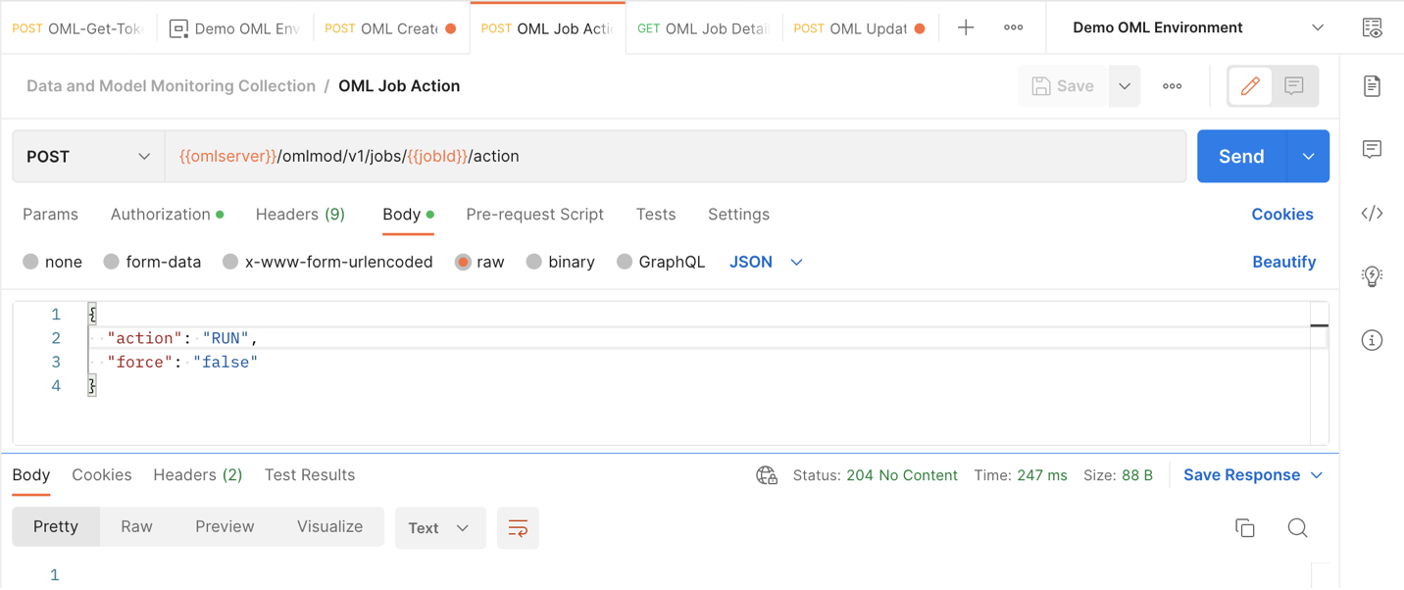
These requests are sent as POST requests to the /omlmod/v1/jobs/{{jobID}}/action endpoint. Since we want to see the results of the data monitoring job without waiting for it to run according to its schedule, we send a request to this endpoint to run the job. A successful request will get a 204 response with no body.
Step 6: View data monitoring job output
We now know that the data monitoring job ran since we successfully sent the request to perform the RUN job action. If we wanted to ensure that the job ran successfully, we could check its details again as we did in step 3.
To finally view the data monitoring results, let’s return to OML Notebooks to run a database query and view the table holding the results. This table is called <jobId>_<outputData> where jobId is the id associated with the job and outputData is defined by the user in the job request.
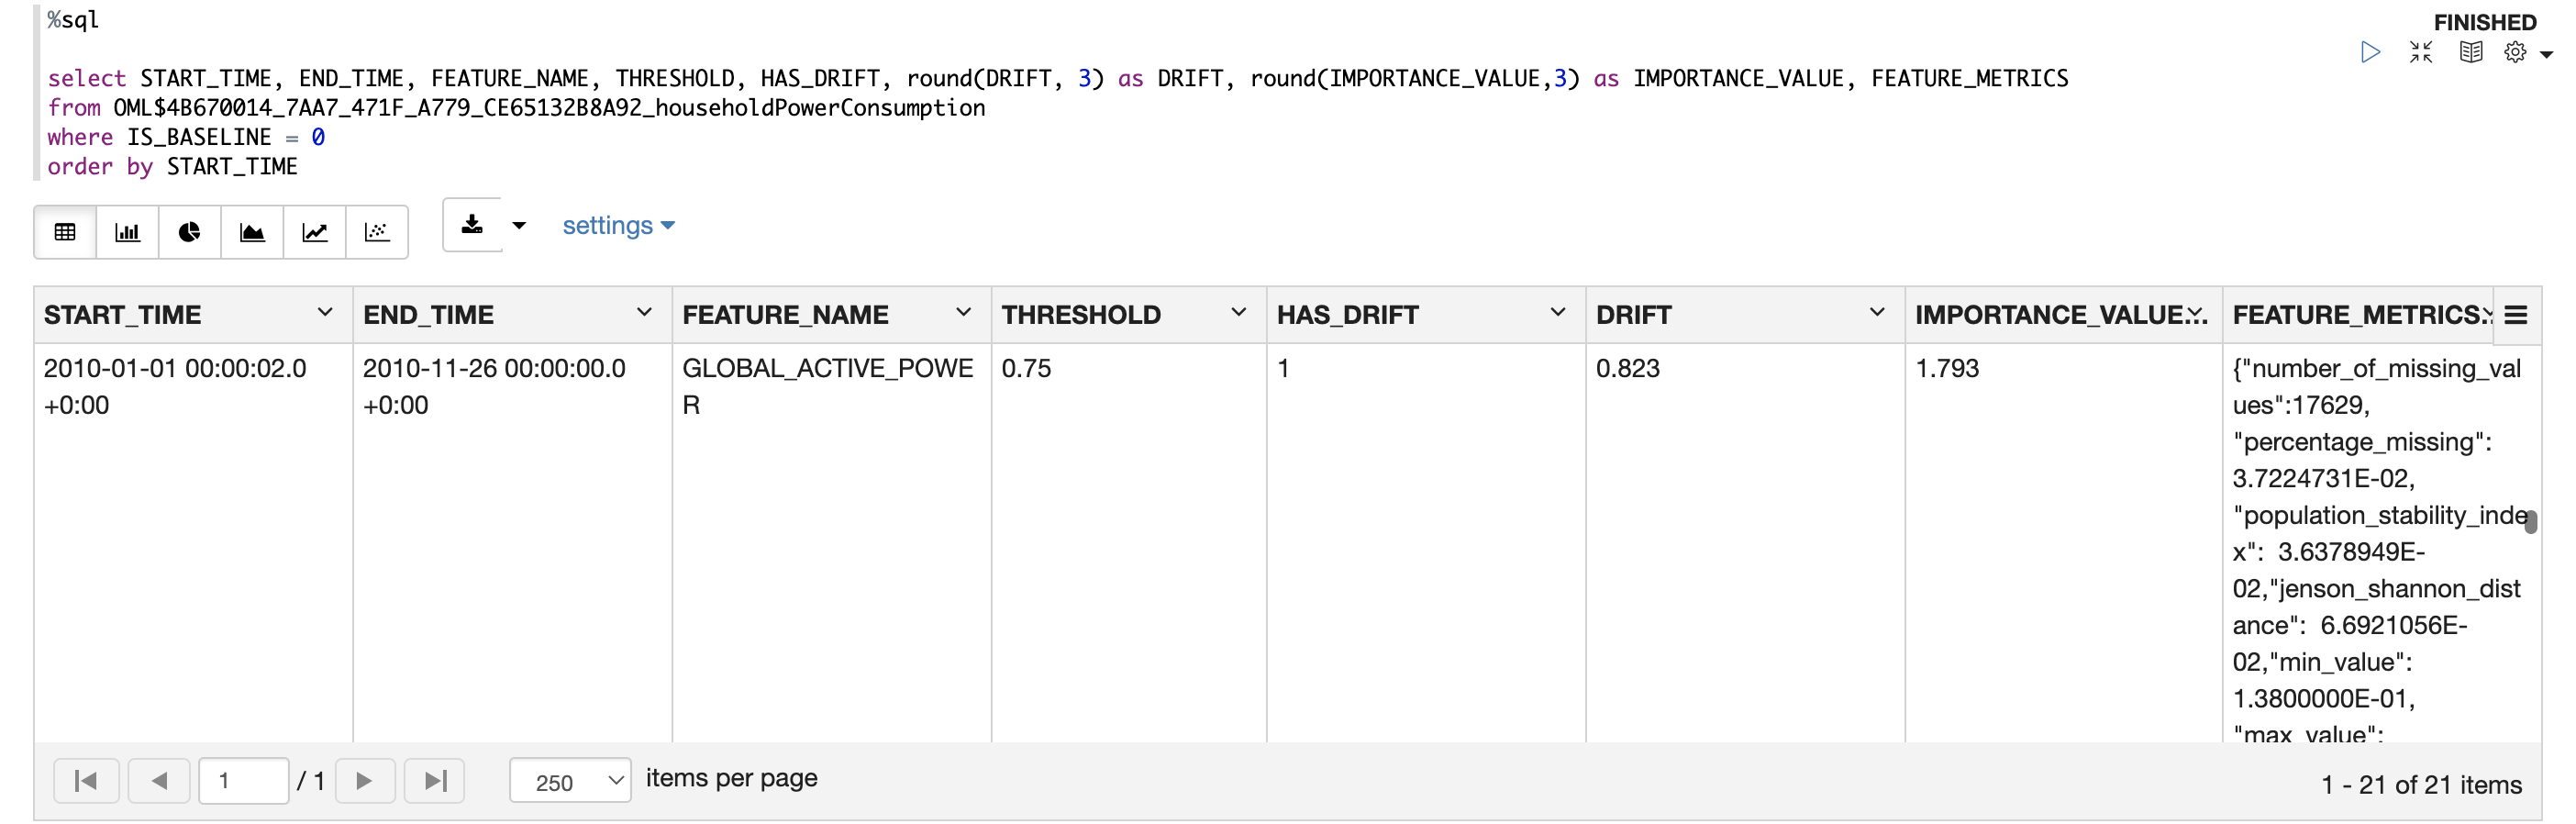
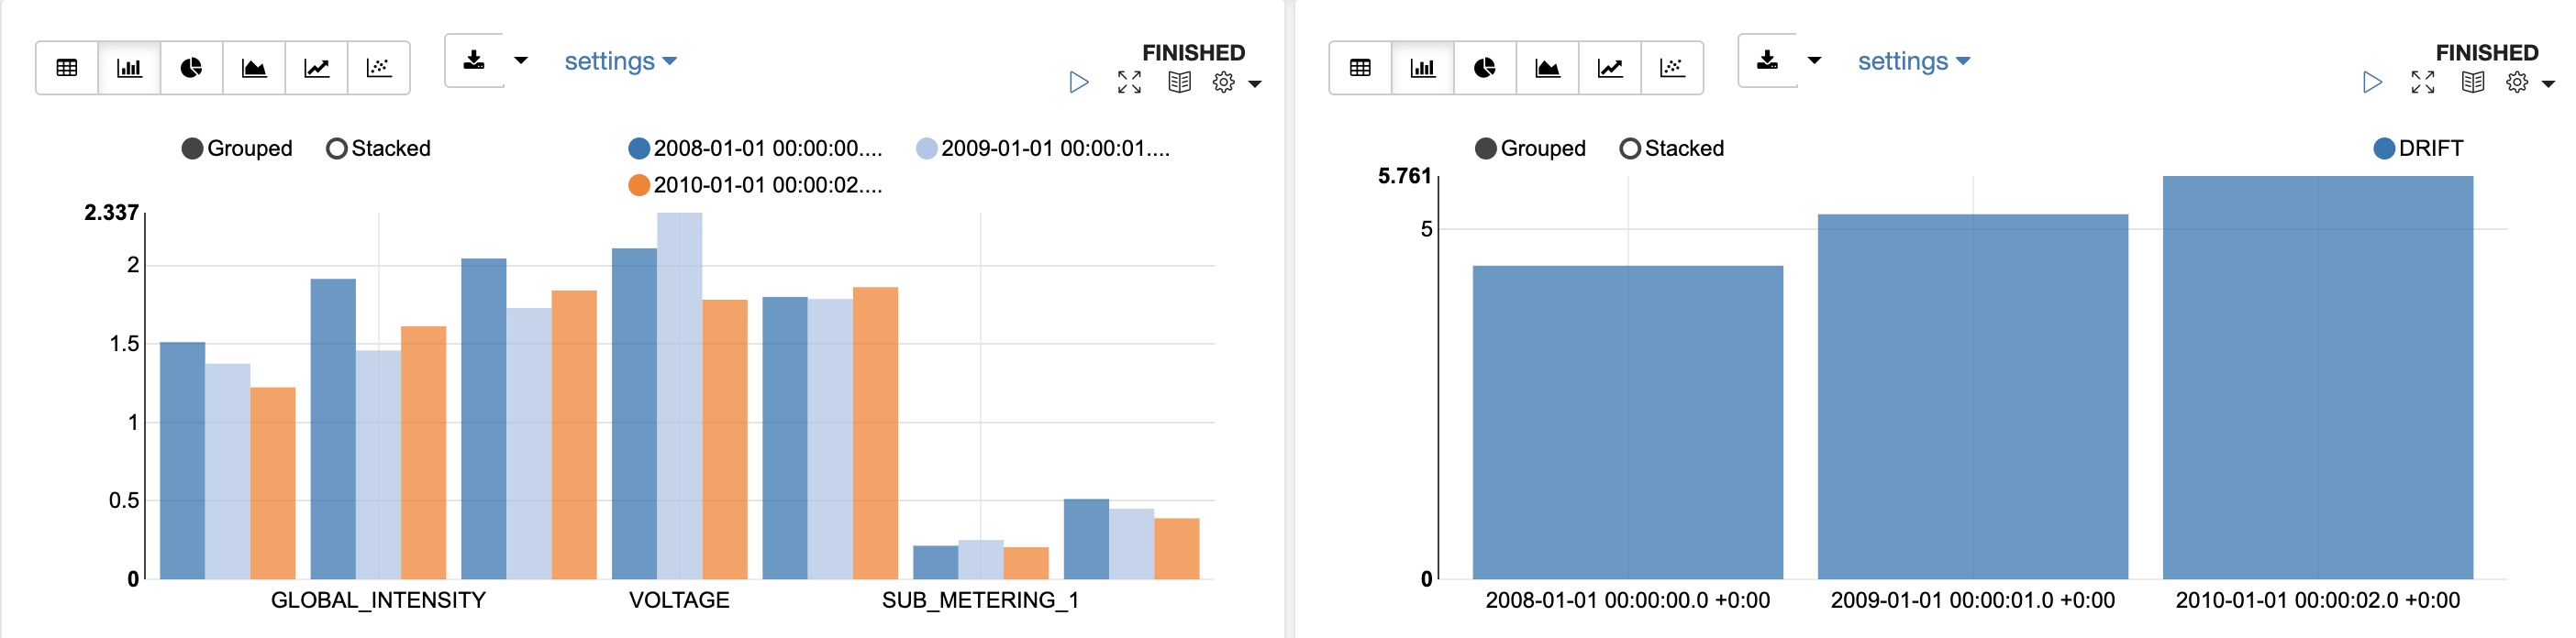
In the first image we are looking at a row of output for the GLOBAL_ACTIVE_POWER column over the last year that was monitored, 2010. The results find that drift did occur in this column, since its drift value of 0.823 is above the threshold of 0.75. The IMPORTANCE_VALUE of 1.793 tells us that this column would be quite an important predictor on a model on this dataset over this period, and we see can some of the extensive information of the FEATURE_METRICS. The second and third images are examples of how we can visualize these monitoring results in the OML Notebooks environment. The second image shows the IMPORTANCE_VALUE for each column across the monitored periods. This tells us which columns are the most important predictors, and how that importance changed over time. The third tells us how the drift value changed over the 3 years monitored, showing that our data drifted further and further each year. For an in-depth explanation of monitoring results, check out the documentation
Further reading
After reading this blog and getting your hands on the new data monitoring feature check out my companion blog on model monitoring. This concept goes hand in hand with data monitoring and is also a new to OML Services.
Here are other some useful links: