Background
OCI provides various billing and cost management tools that make it easy to manage your service costs. You can estimate costs, create budgets to set spending thresholds, view usage, and visualize your spending with charts and reports. Not only this, but you can also view your subscription details, invoices, payment history, manage your payment method, and earn rewards.
A usage report is a comma-separated value (CSV) file that can be used to get a detailed breakdown of resources in OCI for audit or invoice reconciliation.
A cost report is a CSV file that is similar to a usage report, but also includes cost columns. The report can be used to obtain a breakdown of your invoice line items at resource-level granularity. As a result, you can optimize your OCI spending, and make more informed cloud spending decisions.
Overview
Usage2adw is a Python based tool to extract usage and cost reports from OCI tenancy and load them to Oracle Autonomous Database. Using Autonomous Data Warehouse (ADW) and OAC features, this solution can provide high-level overview, in-depth spend analysis and trends in resource utilization, as well as forecast.
Required technical skills
- Python scripting
- Oracle SQL
- Oracle Analytics Cloud (OAC)
- Application Express (Apex)
Availability
Usage2ADW setup – https://github.com/oracle-samples/usage-reports-to-adw
OAC catalogue – https://github.com/karthik-kamisetty/oac/blob/7e9425c123885cca5e168f396e3449dfb6fde952/OCI_Cost_Usage_Analysis.catalog
OAC RPD model – https://github.com/karthik-kamisetty/oac/blob/7e9425c123885cca5e168f396e3449dfb6fde952/Cost_Usage_OACreports.rpd
OCI Resources Used
- Compute VM: The compute VM houses install script to create the required data structures and installs the package and Apex application. All data integrations to retrieve OCI information and load into ADW tables are run on the compute VM.
- Oracle Analytics Cloud: OAC instance will contain Dashboards and Visualization of the cost and usage reports.
- Autonomous Data Warehouse: ADW instance will be used to store and process the cost and usage data and effectively support a data mart that will provide usage and cost visibility of the tenancy and different dimensions like tenancy, region, project, environments.
- ADW Private Endpoint: PE is used in order that ADW to be deployed on a private subnet and hence be only accessible from private connection and not from the internet.
- OAC Private Access Channel: PAC provides the connectivity to private database from Oracle Analytics Cloud. It will enable a private endpoint in a private subnet of the Virtual Cloud Network (VCN) of OCI that will let OAC query the private ADW using the private endpoint of ADW.
Steps to implement
- Provision ADW, OAC and a VM on Oracle cloud
- Deploy Usage2adw scripts on VM
- Upload and restore catalog and RPD on OAC.
- Create necessary connections between OCI, ADW and OAC
- Refresh OAC dashboard to retrieve your tenancy usage and cost details
Main features
- Load Usage Report to ADW
- Load Cost Reports to ADW
- Load Public Rates to ADW
- Report Usage Analysis
- Report Usage Over Time
- Report Cost Analysis
- Report Cost Over Time
- Report Rate Card for Used Products
The implemented solution satisfies a broader set of functional requirements, such as:
- Giving the cost of a specific instance
- Following the cost evolution of a specific project over 1, 3, 6, 12, 24 months
- Following the usage evolution of a specific instance per days & months
- Visibility of current global consumption
- Predicting consumption
- Ability to better plan budget
The solution can also be extended with the following set of capabilities using OCI Tags and drill-down features:
- Extract and Load OCI Tags and Resource Identifiers into the database
- Define metadata information about OCI Tags on OCI Resource Identifiers
- Data model for OAC with extended tables for Tags, Meta-Data and Resource Identifies tables
- Custom Canvas/Report in OAC based on the Data Model with drill-down capabilities
Sample visualizations
Below are few visualizations that can be derived out of OCI usage data, using Usage2ADW.
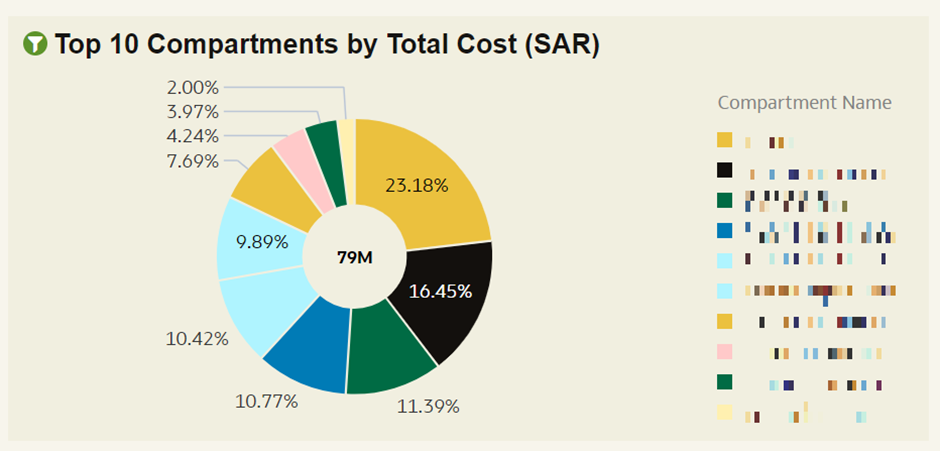
Representation of total cost consumed by compartments over period of time

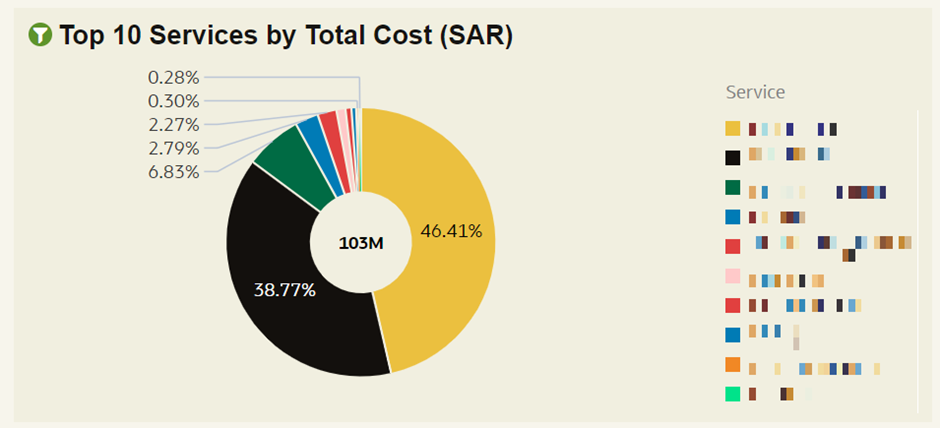
Representation of total cost consumed by services over period of time

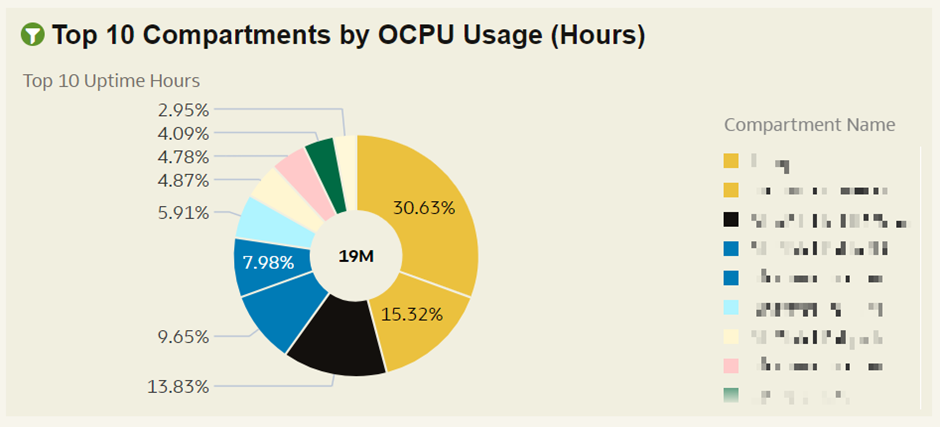
Representation of Oracle CPU usage in hours by compartments

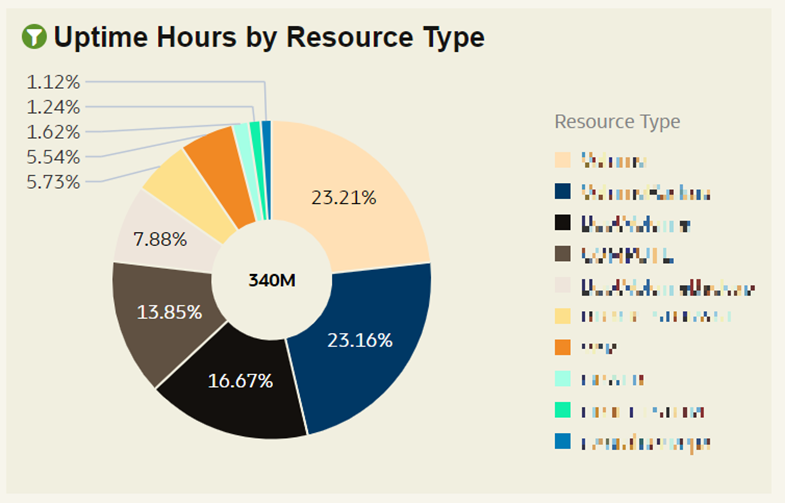
Representation of running hours of each resource

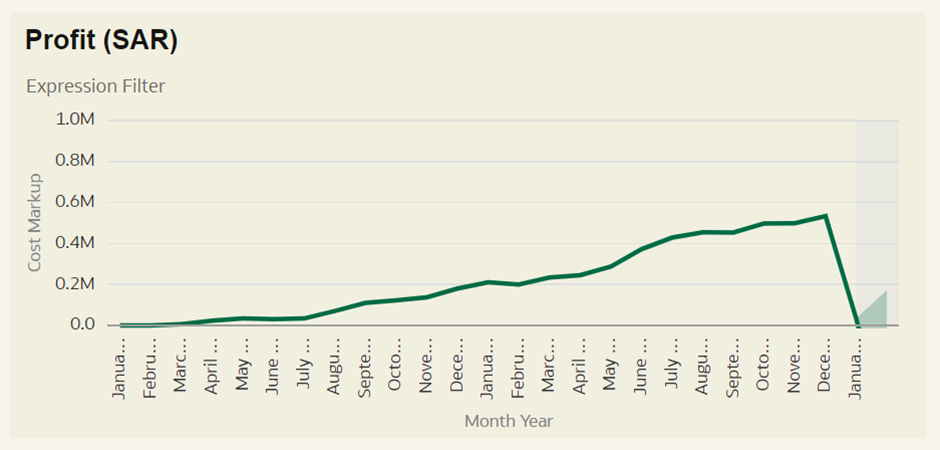
Representation of profit earned each month and forecast for future months

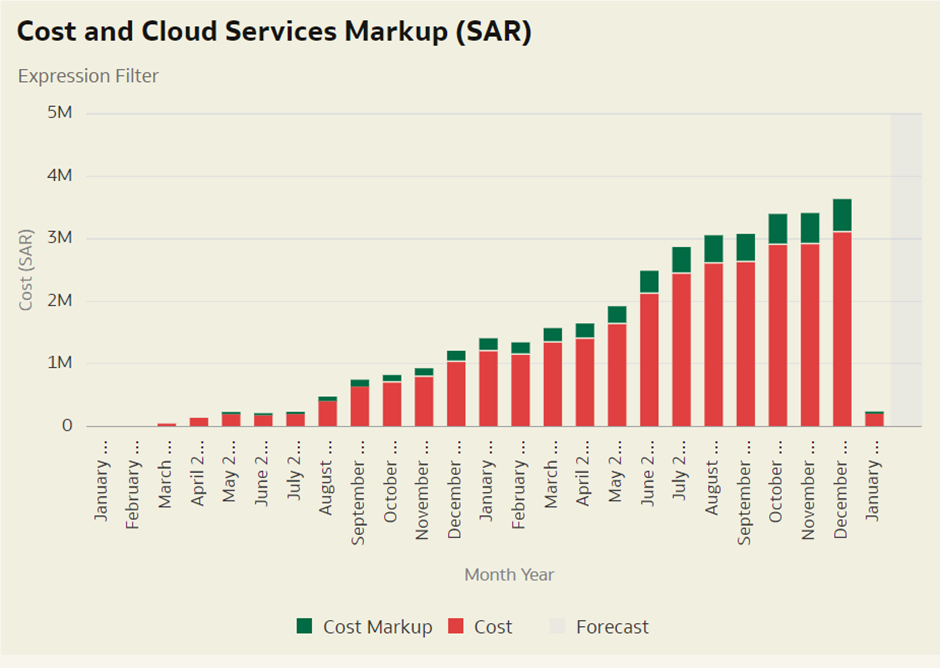
Representation of cost incurred each month
Conclusion
This blog provided steps to extract cost & billing data from OCI, feed it to ADW and create new visalizations in OAC from a working data model. Applying powerful analytics tool OAC over data from OCI billing & cost management, enables the creation of new points of view to analyse cost incurred in the tenancy and budget planning for future usage. With new features of AI & ML adding to OAC, the possibilities to analyse this data will increase multi-fold.