In this article we will discuss the subject areas available for monitoring usage and performance in OTBI. This is a continuation of the ‘Streamline Reporting Operations with BI Auditing in Cloud HCM’ which provides details on using BIP audit reports for self-service monitoring.
The OTBI Usage Real Time and Performance Real Time subject areas provide report authors and administrators real-time insight into usage and performance.
- OTBI Usage Real Time: Monitors OTBI usage, including user, analysis and dashboard, and subject area usage trends
- OTBI Performance Real Time: Monitors usage trends and OTBI analysis execution time, execution errors, and database physical SQL execution statistics
The subject area provides the below information
- User pattern
- Analysis and dashboard usage pattern
- Subject area usage pattern
- Common errors
- Reporting data load
- Reporting performance
Role Required
The OTBI usage subject areas are provisioned for two job roles IT Security Manager and Application Implementation Consultant. To use them for other job roles, grant OTBI Usage Transactional Analysis Duty and OTBI Performance Transactional Analysis Duty to custom job roles in Security Console.
OTBI Usage and Performance Dashboard
The following section provides details on the OTBI Dashboard used for usage and performance monitoring. The sample reports can be downloaded from Customer Connect or Doc ID 2731495.1
Analyses and User Usage
This section displays the usage summary for the selected period. It provides insight on the number of reports run, user count, total reports execution counts and top 10 users and reports
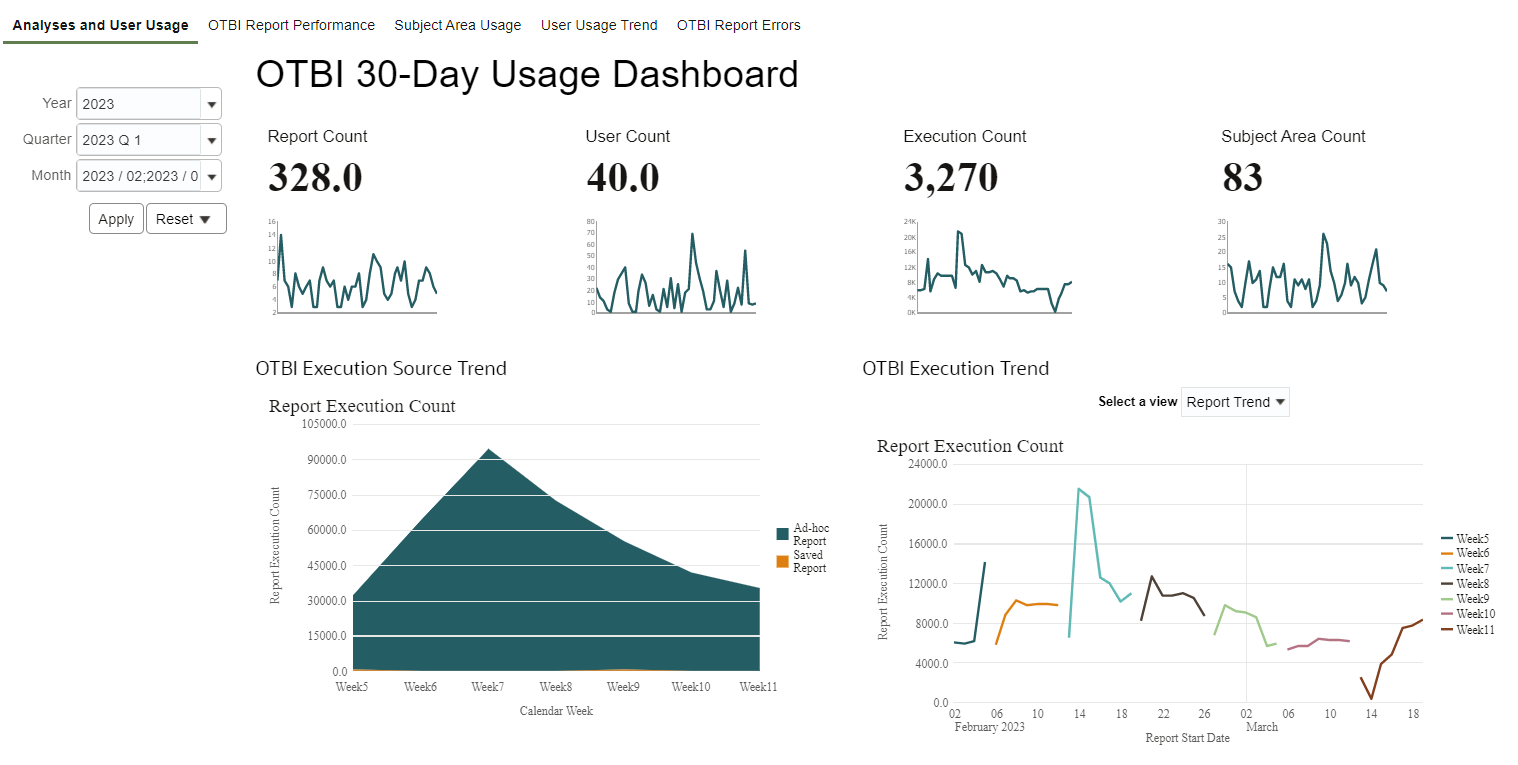
Fig 1. Analyses and User Usage
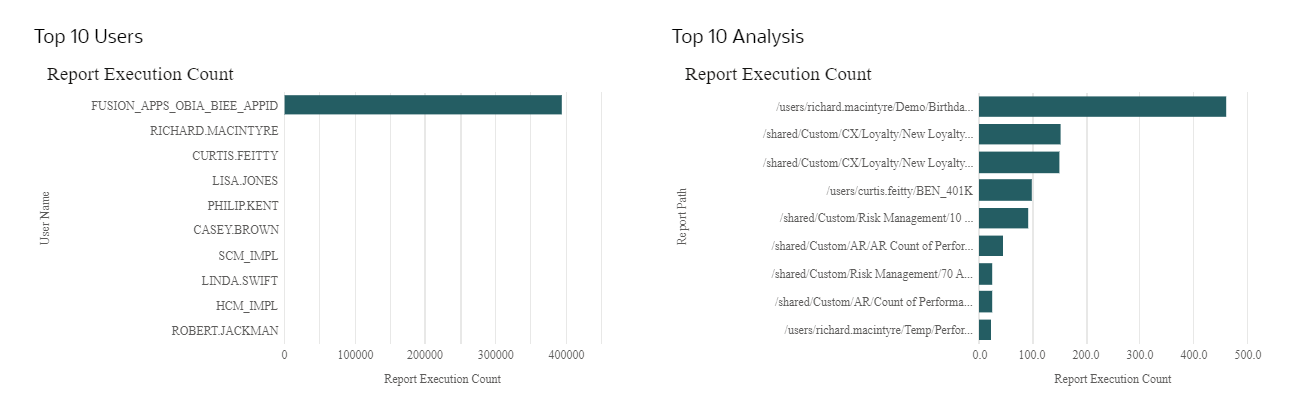
Fig 2. Top 10 Users and Analysis
Subject Area Usage
This report provides insights on the subject area usage.
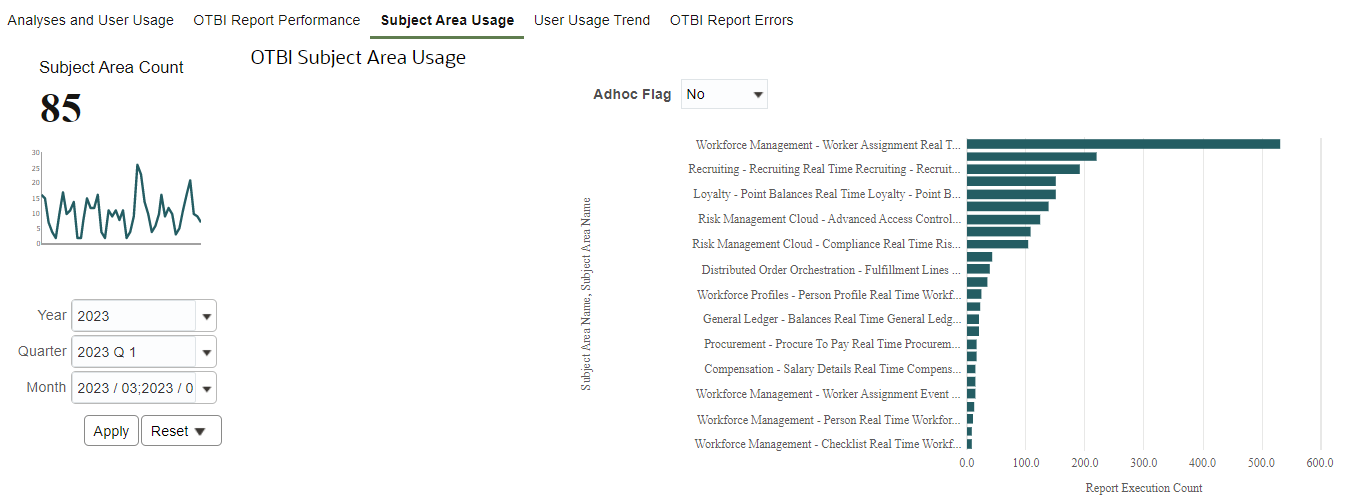
Fig 3. Subject Area Usage
User Usage Trend
This report provides insights on the report execution details by user.
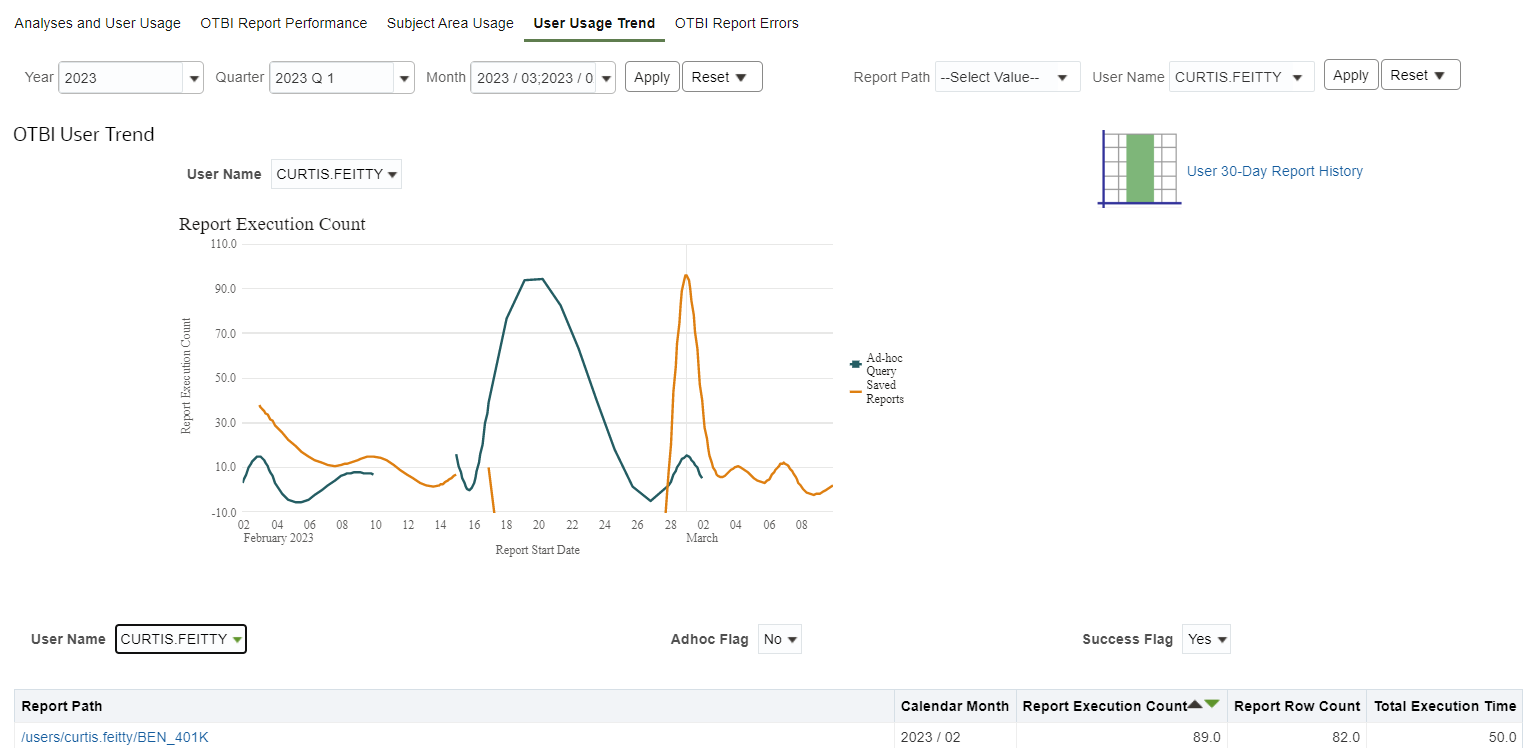
Fig 4. User Usage Trend
OTBI Report Errors
This report provides insights on various errors encountered during the report execution. Admins can review the report to identify the top errors and take necessary action to correct them or provide additional assistance to users
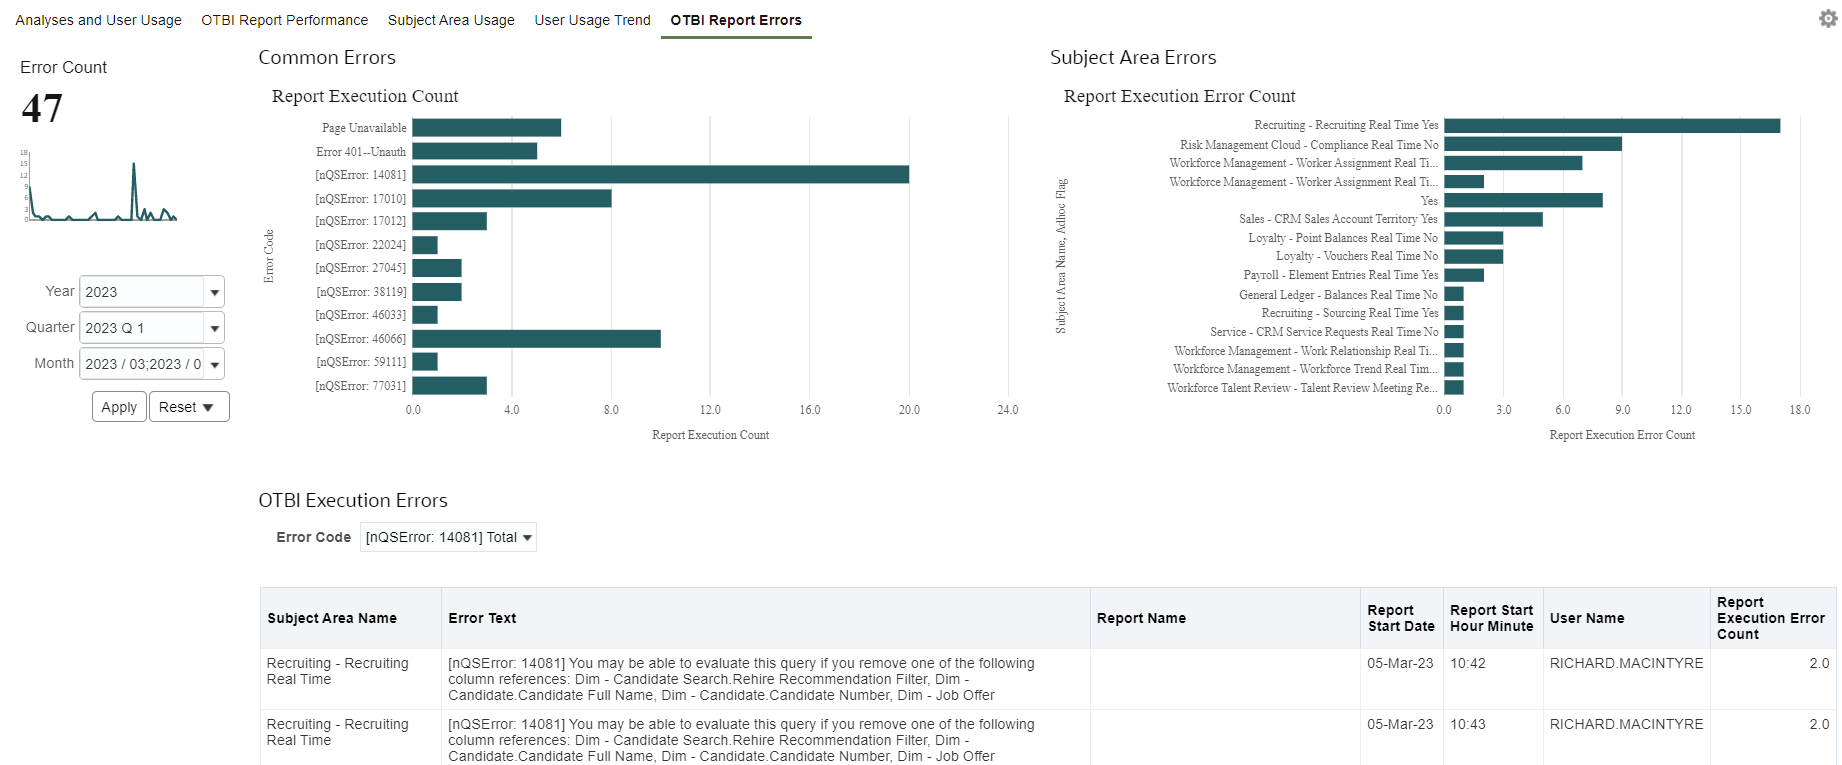
Fig 5. OTBI Report Errors
OTBI Report Performance
The report classifies reports into different time interval. This will help users to review the report executions and runtimes to proactively manage reporting performance, diagnose performance bottlenecks, and design better-performing analyses and dashboards.
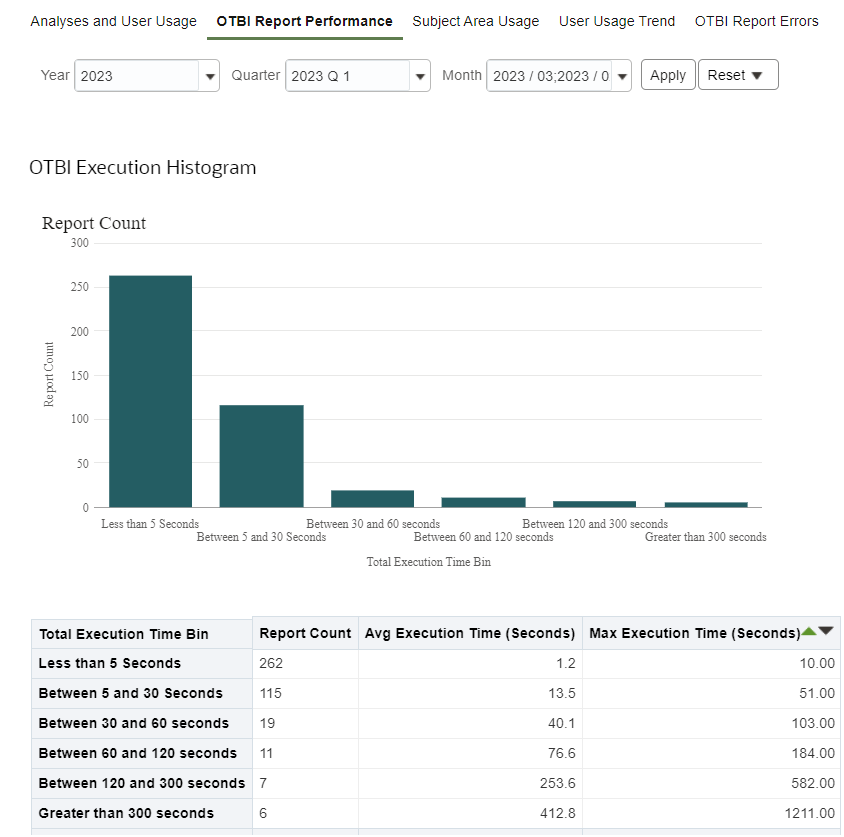
Fig 6. OTBI Execution Histogram
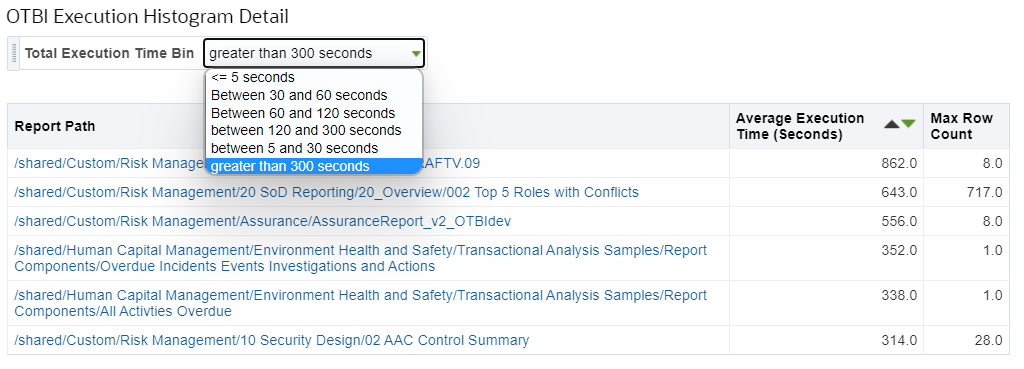
Fig 7. OTBI Execution Histogram Details
Note:
- Data retention period is six months. Data older than six months is purged weekly
- Subject areas are secured by duty roles. There’s no data security
With these subject areas users can create new or use the sample reports to review the usage patterns and review run-time execution statistics, row counts and errors to proactively manage reporting performance, diagnose performance bottlenecks and design better-performing analyses and dashboards.