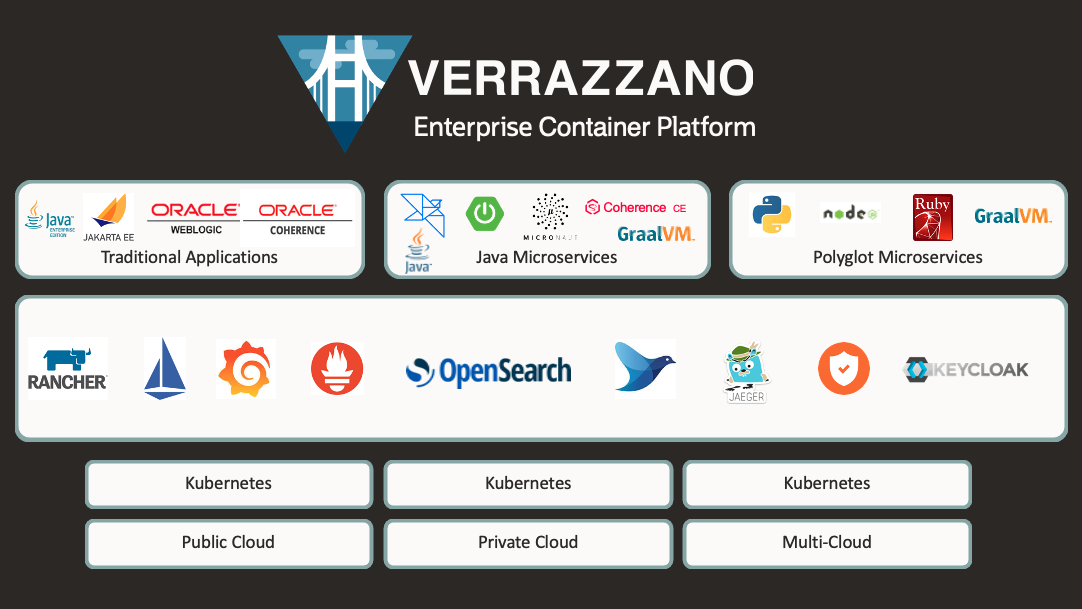
I’m happy to announce that we released Verrazzano 1.2.0 on March 14, 2022. As usual, the software is available on GitHub at https://github.com/verrazzano/verrazzano/releases and on Oracle Software Delivery Cloud. In this release, we focused on making applications easier to operate. That is, we focused on the “Ops” side of DevOps. Here are the highlights of what’s new in this release:
- OpenSearch replaced ElasticSearch
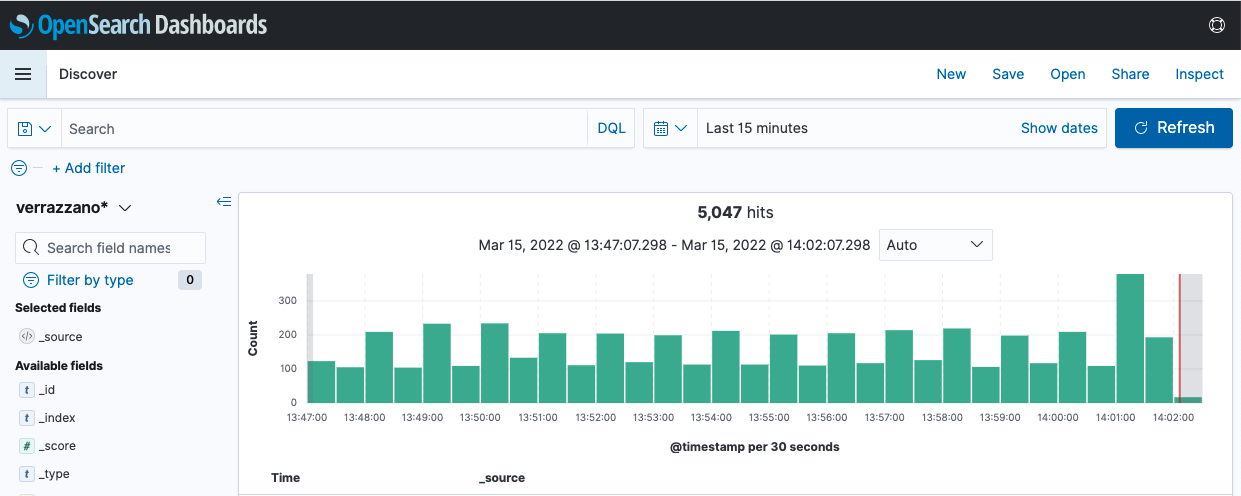
- OpenSearch Dashboards replaced Kibana
- OCI Logging Service integration
- Automatic metrics capture for “plain Kubernetes” deployments
- Continued updates to key components in the platform
I also want to note that Helidon, a sister technology to Verrazzano, recently released a milestone in their latest version. Take a look at https://medium.com/helidon/helidon-3-0-0-m1-release-7dad655cd469!
To see Verrazzano and Helidon in action, register for the Java Innovations Developer Live event.
So what about OpenSearch?
A little less than a year ago, the OpenSearch project was created with an eye towards a “more open” open source for search and analytics. The group released its 1.0 offering in August of 2021. Since then, the community around it has taken hold, and there are more companies and individuals participating, including Oracle. In an effort to avoid proprietary code, and in the spirit of Verrazzano’s open source nature, we thought it best to replace ElasticSearch and Kibana with OpenSearch and OpenSearch Dashboards.
As part of this update, we made sure that upgrade from Verrazzano 1.1.x to 1.2.0 will be smooth. We made sure that we manage the stored log records so that when you do the upgrade, and OpenSearch comes up, it will attach to the existing persistent volumes, and will pick up where ElasticSearch left off.
Verrazzano Logs in OCI Logging Service
Sticking with the subject of logging in Verrazzano, new in Verrazzano 1.2 is the ability to substitute OCI Logging Service for the OpenSearch and OpenSearch Dashboards components in the Verrazzano platform. In December, my colleague Fred Tibbitts wrote a blog about using OCI Logging in addition to the logging infrastructure in Verrazzano, but now we have the full substitution.
Why would you want to substitute OCI Logging for OpenSearch? There are a few really good reasons:
- Consolidate logs in a single logging service. This is especially true if you are using OCI and are already capturing some logs there. Consolidation gives you one place to access logs for everything running in OCI.
- Consume a managed service for log storage and analysis. Using a managed service can be easier than using self-managed infrastructure. Verrazzano makes OpenSearch easy to set up and manage, but it is still not a managed service. Whereas, OCI Logging is a fully managed service. As you know, that means someone else will make sure it is running efficiently, and will continue to run.
- Use OCI Alerting and Log Analytics. Once your logs are in the OCI Logging service, you can use them, along with logs from your other OCI usage, to create alerts for when the system has issues. You can also send Verrazzano logs to the OCI Log Analytics service to visualize and analyze logs from all sources together using machine learning to identify patterns and anomalies.
To configure OCI Logging in place of OpenSearch and Dashboards in Verrazzano, you need to do the following:
- Set up OCI Logging.
- Apply policies that allow log creation and log access.
- Install Verrazzano using specific configuration settings that define the OCI Logging system and that disable the log storage system within Verrazzano.
After the system is set up, you can optionally override log settings for your applications.
Read below for more details. Also see the documentation at https://verrazzano.io/latest/docs/monitoring/oci-logging/oci-logging/.
Setting Up OCI Logging
With the OCI Logging integration, Verrazzano enables you to configure a default log location for the Verrazzano system logs, and a default log location for all application logs. You can also provide an override at the Kubernetes namespace to override the log location for applications running in that namespace.
Before you install Verrazzano, you should set up the default log locations in OCI Logging system and app logs, as mentioned above, by creating a Custom Log for each location. You should also create Custom Logs for other known logs that you expect to capture for a specific namespace.

To create the custom logs that you need for Verrazzano, do the following:
- Navigate to Observability and Management : Logs.
- Make sure that the desired Compartment is selected.
- Click Create custom log. Follow the instructions on the page. Do not create an agent for the log.
For more details about creating custom logs, see https://docs.oracle.com/en-us/iaas/Content/Logging/Concepts/custom_logs.htm.
Applying OCI Policies
OCI Logging is protected, as is all of OCI. In order to allow log record creation and log access, you need to apply policies that grant the required access. If Verrazzano is running withing OCI, it is easy to configure the system to use instance principals to create the log records. In that case, you need to do the following:
- Create a Dynamic Group that will include the compute instances within the Kubernetes cluster.
- Apply a policy that enables those compute instances (think “instance principals in use”) to create log records. Fluentd in Verrazzano is configured automatically to use those instance principals.
The rule in my dynamic group is:
Any {instance.compartment.id = 'ocid1.comparment.oc1... '}
This rule puts all compute instances in my compartment into the dynamic group.
The policy in my OCI tenancy is:
allow dynamic-group group-name to use log-content in compartment compartment-name
This policy enables the compute instance principals to “use” log content, which enables reading and pushing log content.
For more information about permissions needed for working with OCI Logging, see https://docs.oracle.com/en-us/iaas/Content/Logging/Task/managinglogs.htm#required_permissions_logs_groups.
Installing Verrazzano
If you want to substitute OCI Logging for OpenSearch and OpenSearch Dashboards, you have to provide configuration information that will do the following:
- Define the default logging location for the system logs and for the application logs.
- Disable OpenSearch and OpenSearch Dashboards.
You do both of these steps within the configuration that you pass to the Verrazzano Platform Operator at installation time. As a reminder, when installing Verrazzano, you first deploy the Verrazzano Platform Operator, and then you tell that operator what configuration of Verrazzano to set up and maintain. When substituting OCI Logging, you can use a command similar to the following:
kubectl apply -f - <<EOF
 apiVersion: install.verrazzano.io/v1alpha1
 kind: Verrazzano
 metadata:
   name: example-verrazzano
 spec:
   profile: ${VZ_PROFILE:-prod}
   components:
     fluentd:
       enabled: true
       oci:
         systemLogId: ocid1.log.oc1.example-ocid
         defaultAppLogId: ocid1.log.oc1.example-ocid
     elasticsearch:
       enabled: false
     kibana:
       enabled: false
 EOF
Note the system log and application log locations in the example above. These require the ocid for the Custom Logs that you created earlier in this process. You can get those ocid strings from the OCI Console.
Specifying Application Log Overrides
If you want the logs for the applications in a Kubernetes namespace to go to a different Custom Log location in the OCI Logging system, you can add an annotation to the namespace using the following pattern:
verrazzano.io/oci-log-id: ocid1.log.oc1.iad.ns.app.example
Fluentd will automatically push logs for all applications in the namespace to the Custom Log that you specify.
Automatic Metrics Collection for Plain Kubernetes Deployments
Continuing with our Ops focus in this release, we’ve made it easy to automatically capture metrics for applications that you deploy into a Verrazzano-managed cluster, but without using Open Application Model custom resources. In general, Verrazzano automates an application setup when the application is deployed using OAM component definitions and OAM application configurations. However, there are times when you may have an application that you are already deploying using a different mechanism. We want to make that easy and automated, too.
The Verrazzano platform includes Prometheus for metrics collection. For OAM applications, the Verrazzano operators automatically update the Prometheus scrape target configuration when an application is deployed. To get the same behavior for non-OAM applications, you need to do the following:
- Label the Kubernetes namespace where you are deploying your applications with
verrazzano-managed=true. - Make sure that your Kubernetes object is annotated so that the Prometheus scrape target can be set appropriately. (In many cases, this step is not necessary because the default scrape path and port can be used.)
The automation system behavior in this case is determined by Metrics Templates. For an example template, see https://verrazzano.io/latest/docs/reference/api/verrazzano/metricstemplate/. These templates define the workload types that Verrazzano will watch for, and the scrape configuration settings that Verrazzano will apply. Verrazzano includes a default metrics template that is installed in the verrazzano-system namespace. That template applies to applications that are deployed to a labeled namespace. However, you can also add a metrics template to a namespace, and add appropriate annotations to the namespace to get different metrics collection behavior for that namespace. You can go even further and annotate the spec for a specific workload to apply a metrics template for that specific workload.
Read more at https://verrazzano.io/latest/docs/monitoring/metrics/metrics/#standard-kubernetes-workloads.
Updated Verrazzano Components
With every minor release of Verrazzano, we look at the internal components in the platform and decide which to update. The decision is driven partly by a desire to stay up to date, but also to keep up with Kubernetes versions. In Verrazzano 1.2.0, we updated the following key components:
- Grafana: 7.5.11
- Prometheus: 2.31.1
- OpenSearch: 1.2.3
- OpenSearch Dashboards: 1.2.0
- WebLogic Kubernetes Operator: 3.3.7
For a complete list of components and versions, see https://build.verrazzano.io/docs-stage/docs/setup/prereqs/#installed-components.
Don’t forget to join the Verrazzano slack workspace: https://bit.ly/verrazzano-slack!
Until then, happy coding!