This is a guest blog written by the Asserts team.
Scrape Metrics with Prometheus
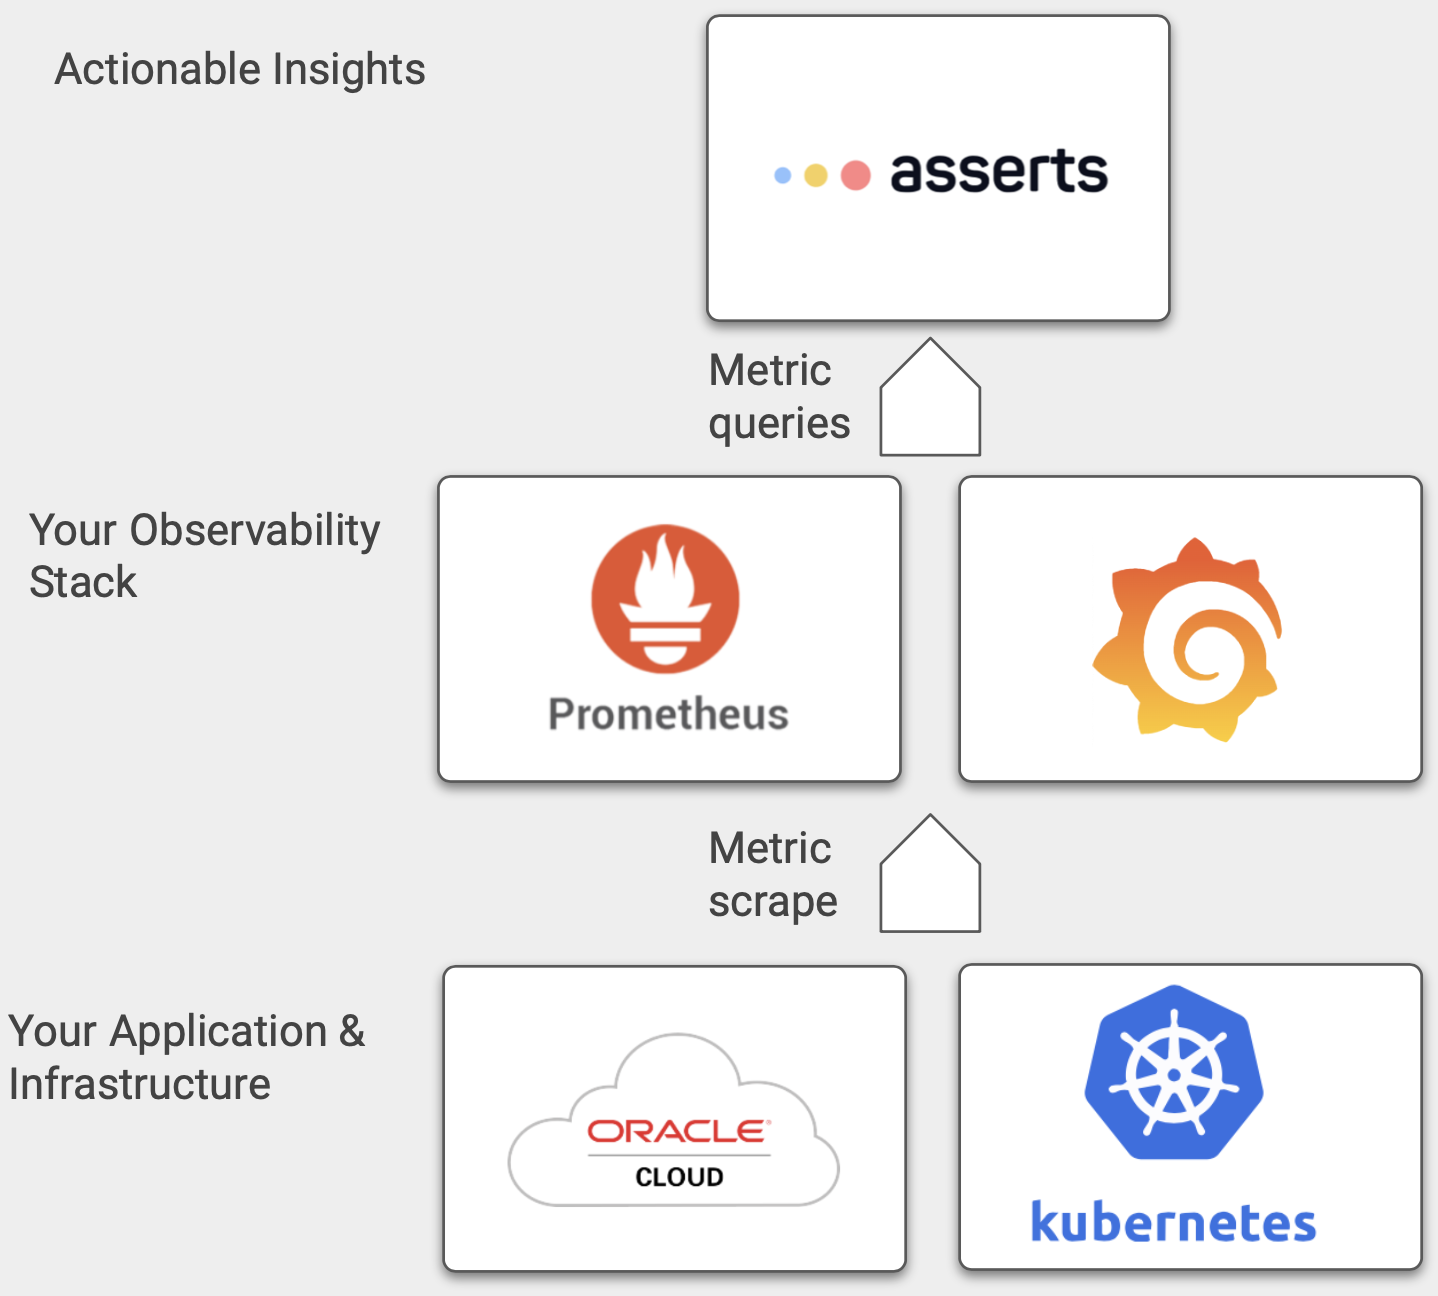
Many organizations that run their applications on OKE, and Kubernetes in general, choose to use Prometheus as the foundation for their metric platform, for a few key reasons:
- Prometheus integrates seamlessly with your OKE clusters via tools like the Prometheus Operator.
- Prometheus’s vast exporter coverage allows application, infrastructure, and cloud service metric data to be integrated for full-stack analysis.
- Prometheus’s open ecosystem allows interoperability with a wide variety of related tools.
Asserts naturally fits into the Prometheus ecosystem and transforms metric data into actionable insights to quickly solve performance and quality issues.
Extract Insights from Your Metrics
Monitoring an OKE cluster with Prometheus provides a wealth of detailed metric data, but navigating this data can pose its own challenges. While there are excellent visualization and alerting tools available, such as Grafana for example, still some problems remain:
- When alerts fire, the initial investigation of the problem takes a lot of time and engineering expertise.
- Engineers supporting applications need to resolve problems quickly, but doing so requires thorough and comprehensive architectural knowledge.
- Effective alerting strategies are difficult to implement, making it too easy to miss an incident.
As Kubernetes and cloud adoption continue to accelerate, these problems become harder to solve. When organizations face these challenges, their engineering teams find that keeping their applications reliable requires considerable toil and their user experiences tend to suffer as well. Asserts solves the root of these problems by transforming the data you already have into the insights you need.
Since Asserts leverages your existing Prometheus infrastructure, deploying Asserts does not require installing any agents or making any application changes.
Add Context to Alerts
When an engineer first receives an alert, before they can act upon it they need to put it in context. That requires answering these questions:
- What is the impact of this problem on my application and my users?
- Where should I start my search for the cause of the problem?
- Are there any other ongoing incidents that are relevant to my problem?
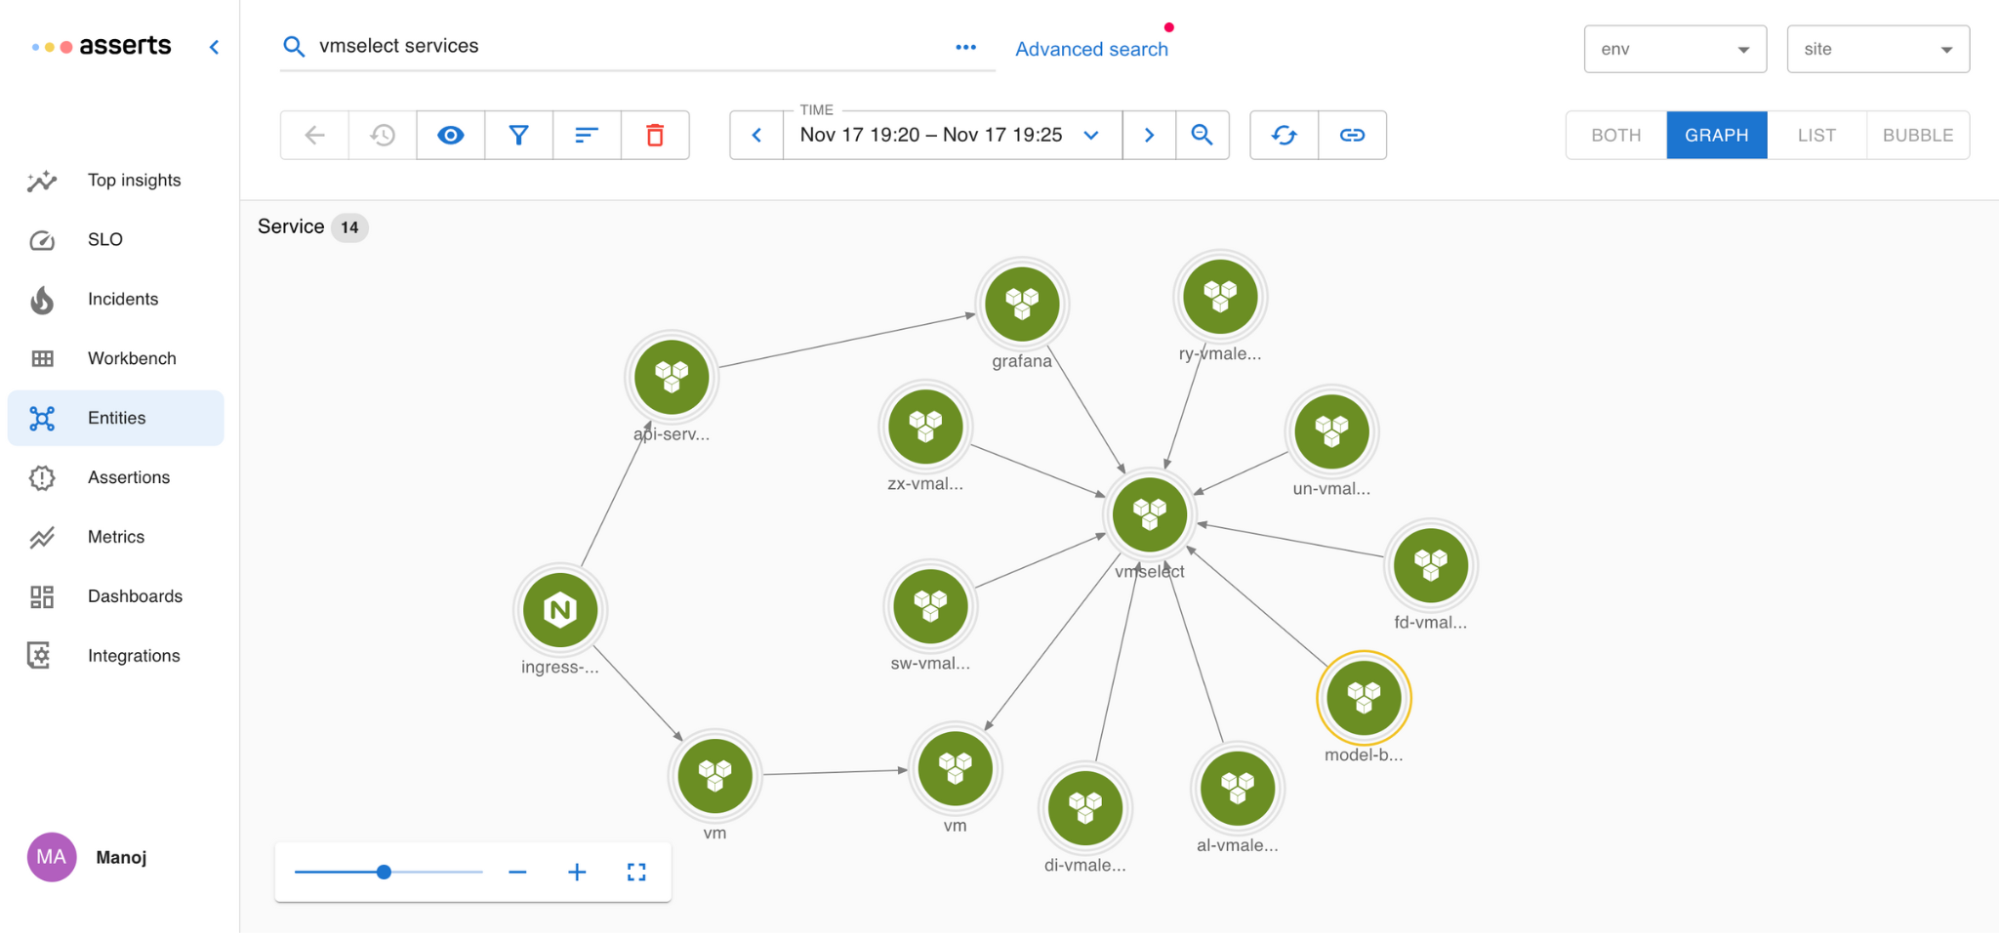
Asserts uses automated analysis to help engineers answer these questions immediately after receiving alerts, so they can move on to solving the problem. Based on metric data, Asserts builds an application map that explains:
- How the various parts of your application and infrastructure are connected and related to one another.
- Where problems are occurring.
- What components have recently changed.
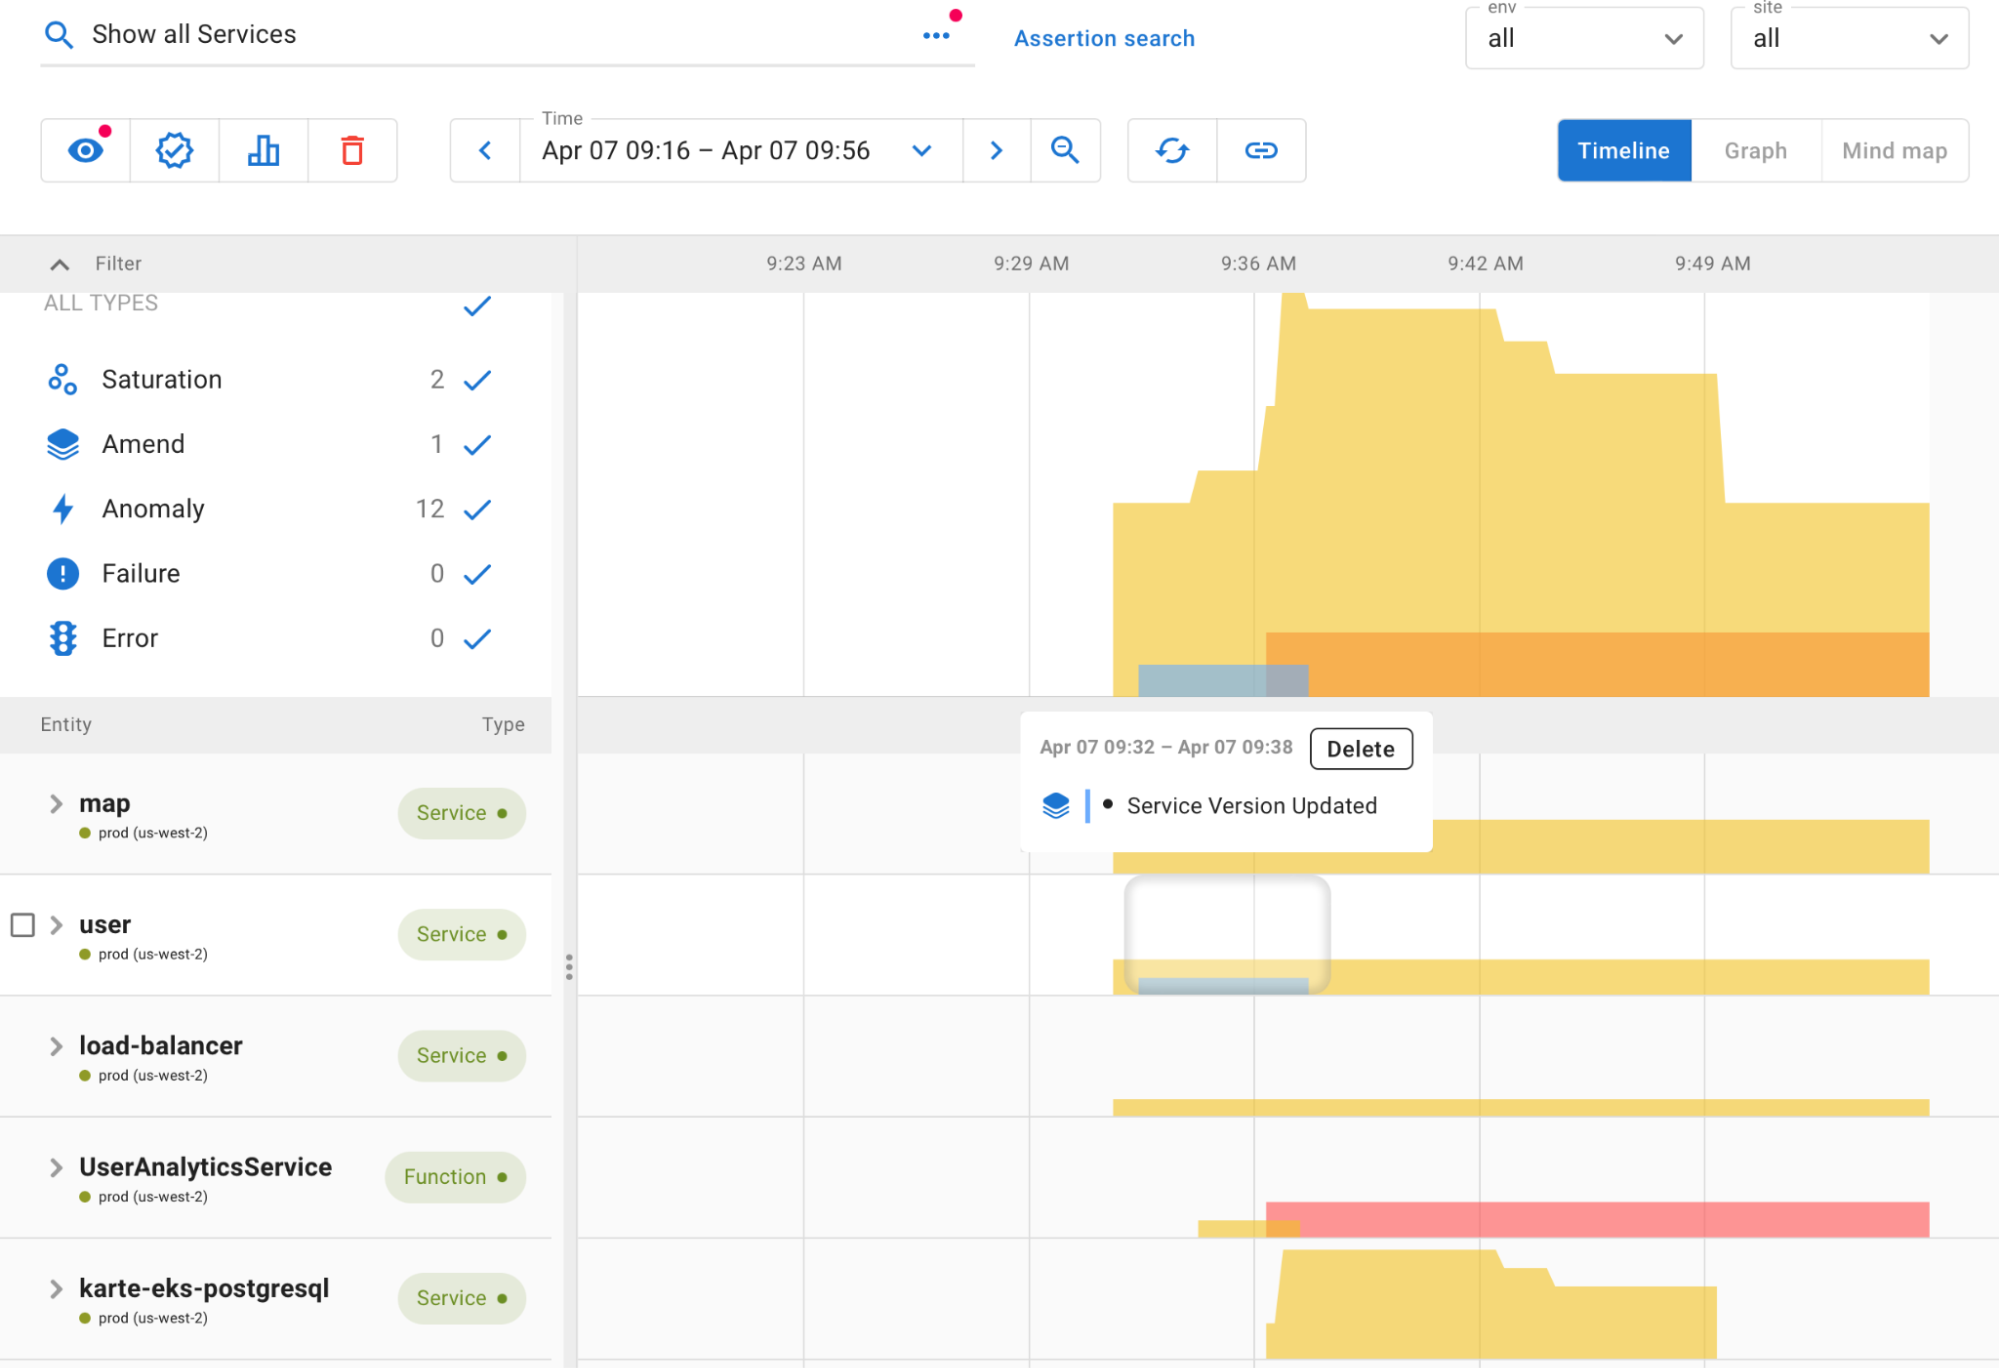
Once you are ready to start drilling down into specific problems, Asserts presents them on an intuitive timeline so you can quickly see what issues occurred over time. You can also see changes (like configuration updates or deployments, for example) occurred immediately before the incident.
Reduce Operational Complexity
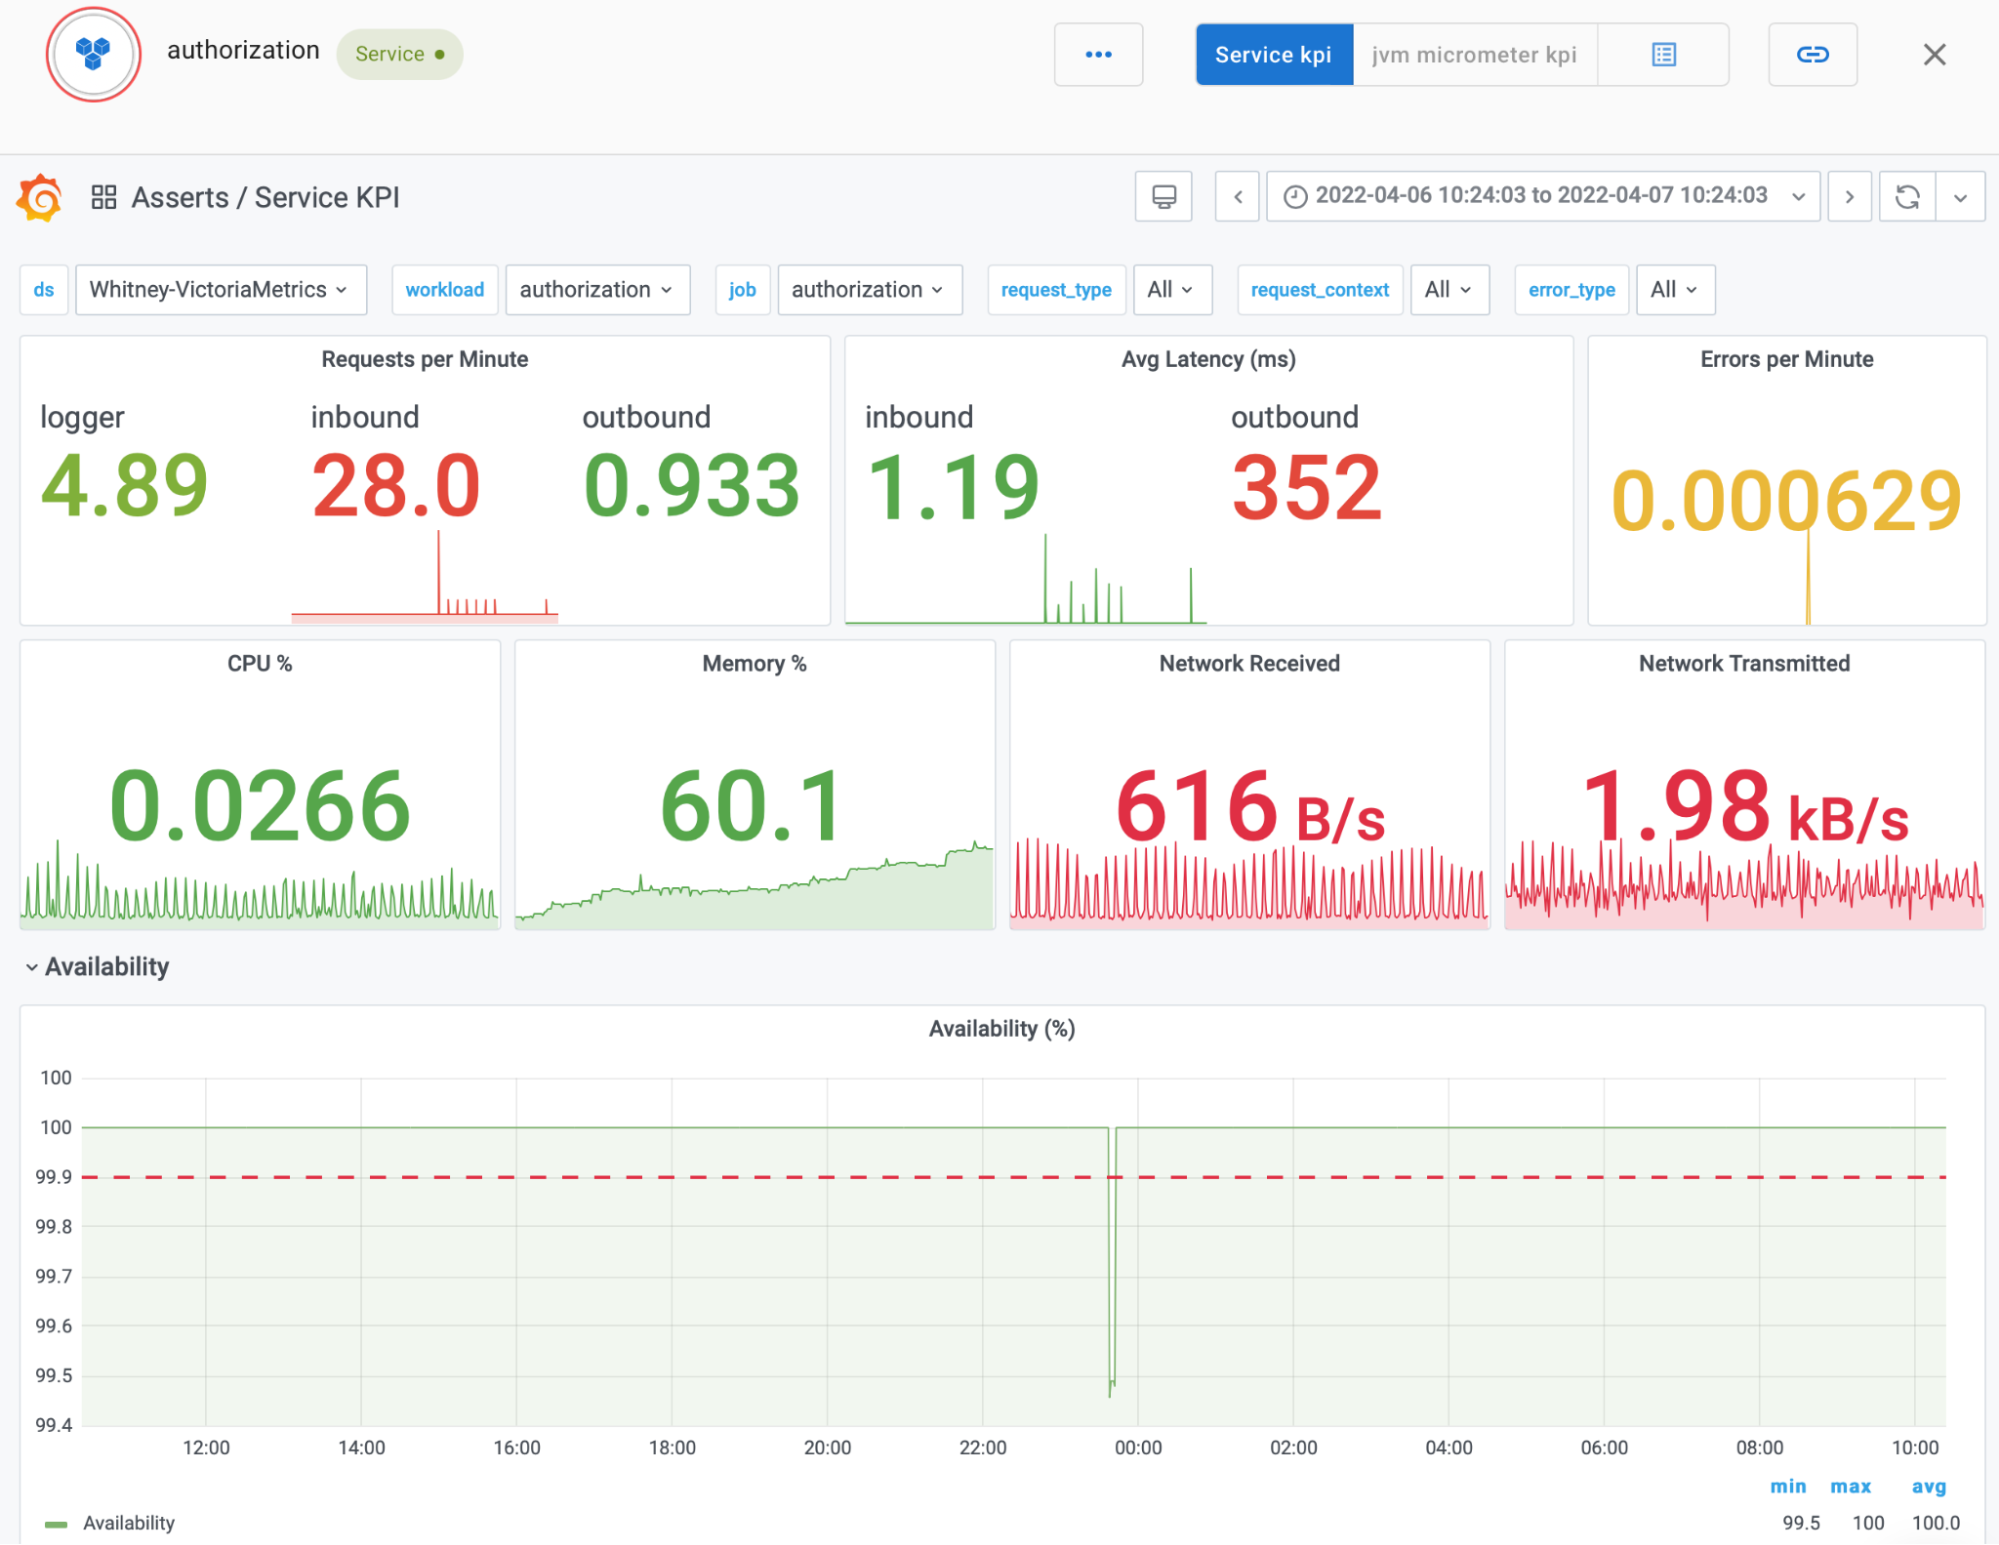
Modern cloud native applications rely on a combination of application services, infrastructure, and managed cloud services. Each of these components has its own set of metrics that it exposes, so effective troubleshooting of the system as a whole requires you to know which metrics are most important, and how the different metrics are related to each other.
Asserts provides built-in, contextual dashboards for each entity in the application map so you can quickly see the key metrics for any particular problem. This enables each member of your team to troubleshoot the entire application stack without needing to have specialized knowledge ahead of time.
In addition to discovering the application map, Asserts automatically spots anomalies and failures throughout your OKE clusters. The Asserts platform detects these problems with health checks called Assertions. In much the same way that developers add assert statements to detect problems in a program, Assertions enable you to spot problems once your code is running in production. Assertions also provide an abstraction layer over specific metrics, so anyone on your team can troubleshoot effectively – there’s no need to be an expert on every component of your application architecture. While Asserts comes with many built-in Assertions, that platform is designed to be easily extended with your custom Assertions.
Catch Incidents Reliably
While there are many excellent alerting tools in the Prometheus ecosystem, they leave the task of figuring out how to configure alerts for maximum reliability to you. Asserts provides a built-in and rich library of Assertions to get you started, so you can get visibility into problems without first needing to configure alerts manually. The Assertion library has been battle-tested on Kubernetes applications, ensuring that you’ll spot any emerging issues on your OKE clusters quickly and reliably.
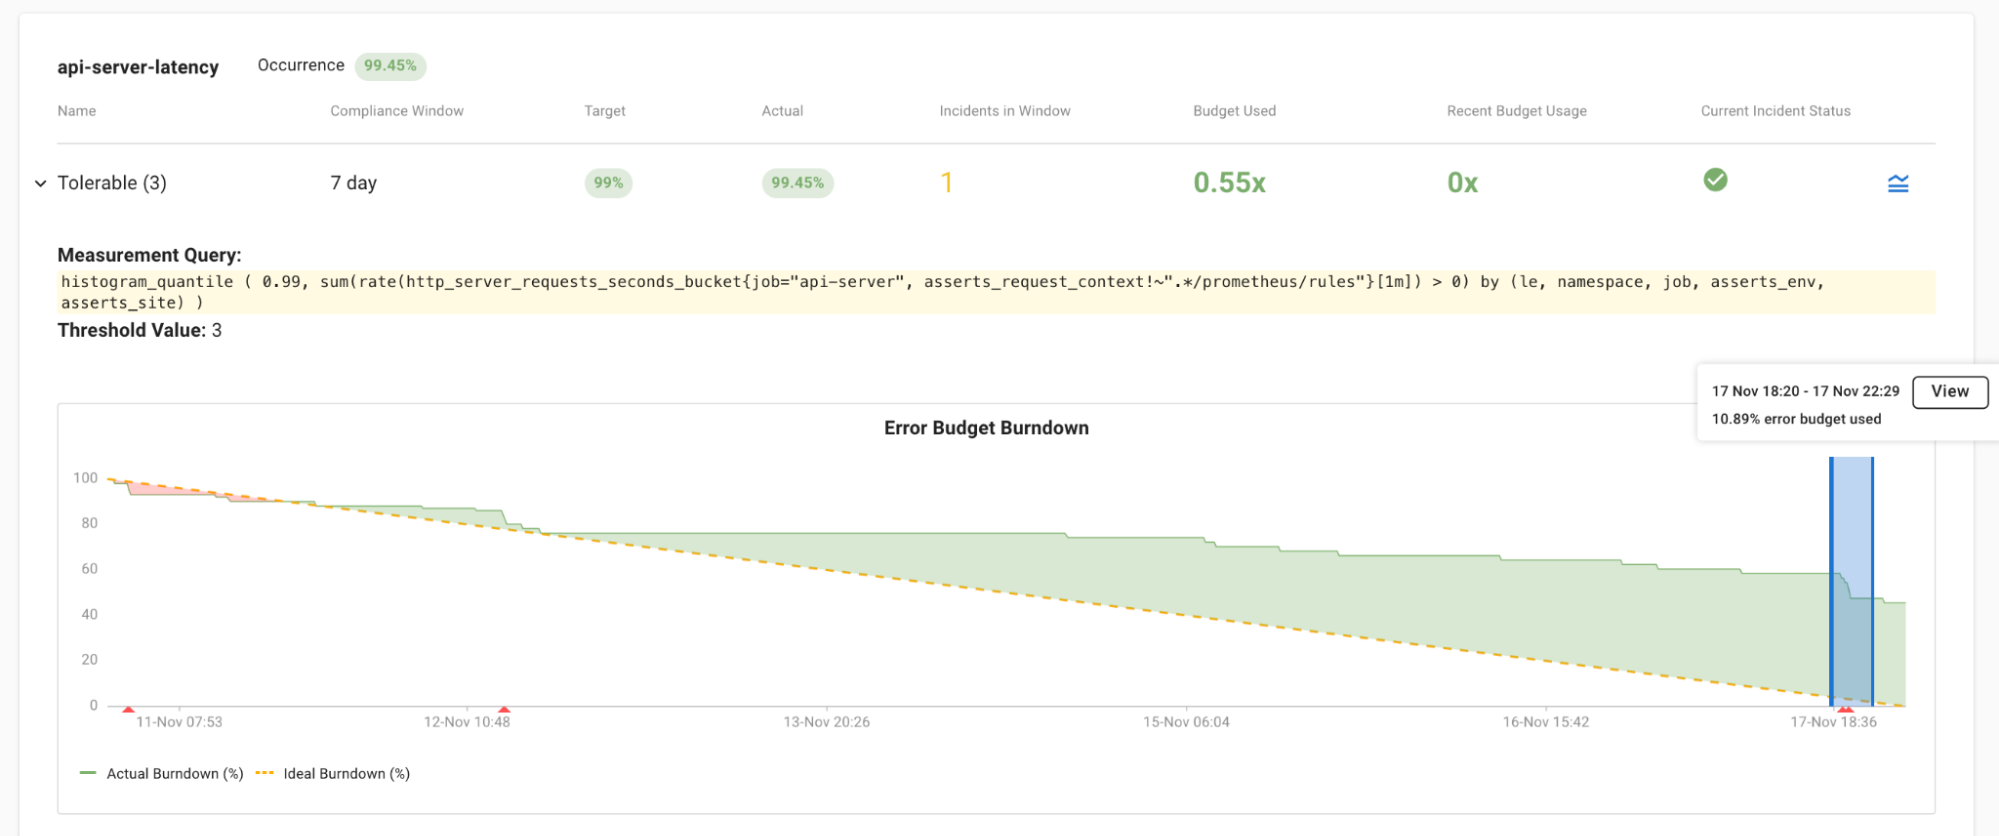
When alerts are noisy or not actionable, organizations experience alert fatigue: engineers aren’t able to investigate alerts urgently. This can mask real problems and delay incident response. To solve this problem, Asserts enables you to define Service Level Objectives (SLOs) and use them to drive your alerting strategy. When alerting on SLOs, you’ll have confidence that every alert is actionable and no incidents will be missed.
Conclusion
You can confidently ensure you are actively monitoring by integrating Asserts.
Here are some of the handy links you can leverage to explore the Asserts and Oracle partnership activities further:
- If you’d like to try Asserts for yourself, you can explore a preconfigured sandbox or set up a demo.
- If you want to experience Asserts on Container Engine for Kubernetes for yourself, sign up for an Oracle Cloud Infrastructure account and start testing today!
- For more information, see the Oracle Container Engine for Kubernetes documentation.