Key Takeaways
- Measure answer quality before latency. A vector match is only a cache candidate until threshold checks and policy rules approve reuse.
- Count provider-call avoidance only after approved reuse. An avoided provider call means the application returned a cached answer and skipped generation, not merely that a nearby vector was found.
- Compare request paths separately. No cache, exact cache, semantic cache on the primary database, and semantic cache through Oracle True Cache all do different work. Blending them into one latency average hides the result.
- Use Oracle True Cache as a read-path option. Oracle True Cache can help with eligible read-heavy lookup traffic, while semantic matching, threshold checks, policy approval, write routing, and invalidation policy remain separate responsibilities.
If your semantic cache is returning hits, congratulations – you have reached the dangerous part!
A hit counter can make a demo look better than it is. Maybe the cached answer was safe to reuse. Maybe the application found a nearby vector match that the policy needed to reject. Maybe the hit rate improved, but every miss now pays for embedding generation, database lookup, provider generation, and write-back. Maybe Oracle True Cache is configured, but the lookup you care about is still using the primary database route.
That is why measurement discipline matters. In article 1, we drew the architecture boundary: semantic caching is governed answer reuse, not just vector search. In article 2, we implemented the pattern with Spring Boot, a provider abstraction, an Oracle semantic-cache schema, and Oracle True Cache for eligible read-only lookup traffic. Now the developer question is simple: How do I know whether this cache is helping without fooling myself?
The answer starts with quality. Then it moves to provider-call accounting, latency by path, and the read-path role of Oracle True Cache.
Prerequisites
This article uses the same demo application from article 2, in the public repository at https://github.com/markxnelson/semantic-cache-oracle-demo. There is no second demo codebase here; article 3 focuses on how to read the validation and benchmark-lite output from that application.
You need a Linux/Bash environment, a checkout of the demo repository, the article 2 database and Oracle True Cache stack started by following the repository setup instructions, the Maven wrapper and demo scripts available and executable, and access to generated reports under reports/generated/ after the validation and benchmark-lite scripts run.
The validation and benchmark-lite commands use the article 2 demo configuration. Before interpreting the results, confirm whether that configuration uses deterministic fixtures, local services, or live provider-backed calls. Provider-call counts from deterministic or stubbed runs are useful for checking the measurement path, but they are not token or billing evidence unless the report records token accounting from a live provider run.
The demo repository includes the Maven wrapper and the two scripts used in this article:
cd semantic-cache-oracle-demo
./scripts/run-validation.sh
./scripts/run-benchmark-lite.sh
run-validation.sh rebuilds the Spring Boot demo, runs the deterministic scenario set, and writes the validation reports. run-benchmark-lite.sh reuses that generated event data to summarize decision counts, provider-call accounting, and route latency fields.
Name the semantic-cache request paths before comparing numbers
A semantic-cache measurement run does not begin with one blended average. It begins by naming the path each request took.
For this series, the important paths are:
No cache means the request does not reuse a cache entry. The application calls the provider and, in the demo pattern, writes a new cache entry and event through the primary database path.
Exact cache means a scoped deterministic lookup succeeds. This is usually based on a normalized prompt hash plus tenant, model, prompt template, source, policy, status, and time-to-live predicates. Exact hits can avoid both embedding generation and provider calls.
Semantic cache on the primary database means the application embeds the new prompt, performs vector-aware candidate lookup against the primary Oracle AI Database 26ai route, applies threshold and policy checks, and either returns a cached answer or calls the provider.
Semantic cache through Oracle True Cache means the read-only candidate lookup is routed through the Oracle True Cache read path when eligible. The application still applies the same threshold and policy checks. In this demo architecture, cache inserts, invalidations, and event records are routed to the primary database path.
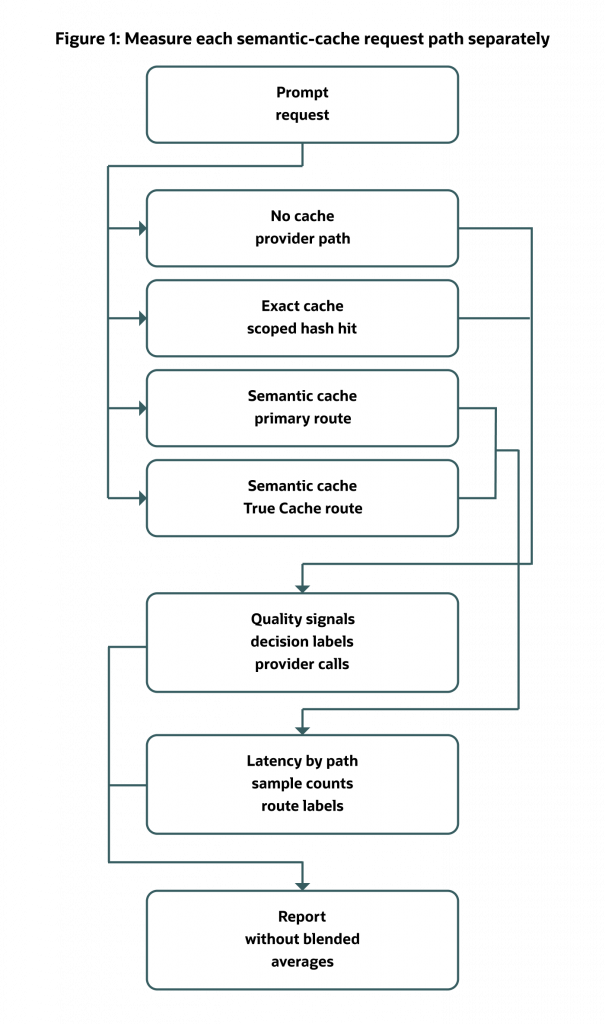
Figure 1: Separate no cache, exact cache, semantic cache on the primary database, and semantic cache through the Oracle True Cache read path before interpreting provider calls, avoided calls, or latency.
This separation matters because the paths do different work. An exact hit may avoid embeddings entirely. A semantic hit pays for embedding and lookup but may avoid a provider call. A semantic miss can be slower than no cache because it adds embedding and lookup before the provider call. An Oracle True Cache route can affect the eligible database read portion, but it does not remove embedding generation, application policy evaluation, provider calls on misses, or primary-database write-back.
The first rule is practical: compare paths, not vibes.
Validate cache decisions before measuring speed
Before you look at latency, prove the harness can distinguish safe reuse from unsafe reuse.
From the demo repository directory, run:
cd semantic-cache-oracle-demo

./scripts/start-databases.sh
./scripts/wait-for-oracle.sh

./scripts/run-validation.sh
The startup script brings up the primary Oracle AI Database 26ai Free container, aligns the password file needed by Oracle True Cache, starts the True Cache service, and registers the primary and PDB-level True Cache services used by the demo. The wait script then checks both database routes before the application validation runs. The validation script builds the application and runs the scenario harness; it is the executable check for this demo.
After the script completes, open reports/generated/validation-summary.md. In this demo run, the validation summary separates the scenarios that matter to semantic-cache correctness:
- A seed miss that calls the provider.
- An exact hit that returns a cached answer without calling the provider.
- A semantic hit that passes threshold and policy checks before reuse.
- A near miss that finds a nearby candidate but rejects it.
- A tenant-isolation case that does not reuse another tenant’s cached answer.
- A model-mismatch case that does not reuse an answer scoped to a different model.
- A source-fingerprint mismatch that does not reuse an answer from a different source version.
- An expired-entry case that proves TTL filters prevent stale reuse.
The current generated summary is intentionally short:
# Semantic Cache Validation Summary

Status: passed

- `seed-miss`: miss via `primary`, provider calls `1`
- `exact-hit`: exact-hit via `true-cache`, provider calls `0`
- `semantic-hit`: semantic-hit via `true-cache`, provider calls `0`
- `near-miss`: near-miss via `true-cache`, provider calls `1`
- `tenant-isolation`: miss via `primary`, provider calls `1`
- `model-mismatch`: miss via `primary`, provider calls `1`
- `source-fingerprint-mismatch`: miss via `primary`, provider calls `1`
- `expired-entry`: miss via `primary`, provider calls `1`
For measurement work, reports/generated/validation-events.csv is more useful because it keeps the decision, route, distance, threshold, provider-call count, and latency together:
| Scenario | Decision | Route | Distance | Threshold | Provider calls | Latency ms |
|---|---|---|---|---|---|---|
seed-miss | miss | primary | n/a | 0.1 | 1 | 203 |
exact-hit | exact-hit | true-cache | n/a | 0.1 | 0 | 49 |
semantic-hit | semantic-hit | true-cache | 0.000016 | 0.1 | 0 | 58 |
near-miss | near-miss | true-cache | 0.679840 | 0.1 | 1 | 64 |
tenant-isolation | miss | primary | n/a | 0.1 | 1 | 100 |
model-mismatch | miss | primary | n/a | 0.1 | 1 | 107 |
source-fingerprint-mismatch | miss | primary | n/a | 0.1 | 1 | 113 |
expired-entry | miss | primary | n/a | 0.1 | 1 | 160 |
That is more useful than a single hit-rate number. A useful validation report proves that the harness can distinguish approved reuse from rejected candidates and scoped mismatches. It also makes provider-call accounting visible per scenario.
The deterministic fixture behaved as expected: exact and semantic approved hits avoided provider calls in the harness, while near misses and scoped mismatches still called the provider. That does not make the threshold universally safe or turn fixture latency into production performance. It gives you a repeatable way to inspect the cache decision before you start tuning for speed.
Separate vector candidates from approved semantic-cache hits
A fast false positive is worse than a miss. If the cache returns a wrong answer quickly, the latency improvement is not a win. The first measurement job is to separate “we found something nearby” from “we safely reused the answer.”
A useful semantic-cache report separates at least four ideas:
- Candidate found: the vector lookup found a nearby stored prompt.
- Threshold passed: the candidate was close enough under the configured metric.
- Policy approved: deterministic scope checks allowed reuse.
- Provider call avoided: the application returned the cached answer instead of calling the provider.
Only the last one is an avoided provider call.
Your validation evidence needs both a positive semantic-hit case and a rejected near-miss case. The semantic-hit case shows a candidate that passed the configured threshold and policy checks. The near-miss case shows that a similar-looking request can still be rejected when it fails the threshold or policy. Those two cases are the heart of semantic-cache quality measurement: the harness proves that a paraphrase can hit, and it also proves that unsafe or insufficiently similar requests can miss.
Treat threshold values as application settings, not universal tuning advice. A useful threshold depends on the fixture, embedding model, distance metric, prompt domain, and risk tolerance. In your own application, the important question is not “what threshold did the demo use?” The important question is “which labeled prompts pass, which fail, and are those decisions safe?”
Use Oracle AI Vector Search with relational policy data
Oracle AI Database 26ai includes Oracle AI Vector Search capabilities for storing vectors, calculating vector distance, and using vector indexes for similarity-search workloads. For semantic caching, the useful part is not vector search by itself. It is vector search next to relational policy data.
Conceptually, the lookup can combine vector distance with deterministic policy filters. The following SQL is an illustrative teaching shape, not a copy-paste replacement for the article 2 repository query:
SELECT
    cached_prompt,
    cached_answer,
    VECTOR_DISTANCE(cached_prompt_embedding, :query_embedding, COSINE) AS distance,
    policy_version,
    expires_at
FROM your_semantic_cache_table
WHERE tenant_id = :tenant_id
  AND chat_model = :chat_model
  AND embedding_model = :embedding_model
  AND embedding_dimension = :embedding_dimension
  AND prompt_template_version = :prompt_template_version
  AND source_fingerprint = :source_fingerprint
  AND policy_version = :policy_version
  AND status = 'ACTIVE'
  AND expires_at > SYSTIMESTAMP
ORDER BY distance
FETCH FIRST :top_k ROWS ONLY;
The actual bind syntax, vector conversion, table names, column names, and index strategy depend on your driver, framework, and schema. For example, if your application passes vectors as text rather than a native vector bind, use the documented conversion approach for that driver or framework.
The important point is the combination. VECTOR_DISTANCE() calculates a distance value that can be used to order nearest candidates under the configured metric. SQL predicates narrow the search to policy-compatible rows. The application applies the threshold and any additional reuse rules. If no candidate is approved, the application calls the provider and writes the new answer through the primary database path.
This is why a semantic-cache entry is not just a vector. Cache rows need deterministic scope and lifecycle data, such as tenant, chat model, embedding model, embedding dimension, prompt-template version, source fingerprint, policy version, status, and expiration. Those fields are part of correctness. When they are part of the lookup, hit counts are easier to trust because reuse is constrained to the right tenant, model, source, and policy boundary.
Count provider-call avoidance only after approved reuse
Developers often want one number from a semantic cache: “How many provider calls did we avoid?” That is a good number, but it needs a strict accounting rule. An avoided provider call means the application returned a cached answer and did not call the generation provider for that request.
Use this rule:
avoided_provider_call =
  cache_candidate_found
  AND threshold_passed
  AND policy_approved
  AND cached_answer_returned
  AND provider_call_not_made
In Java-like pseudocode, the metric belongs after the decision, not after candidate lookup:
if (candidate.isPresent()
        && candidate.passesThreshold()
        && policy.approves(candidate.get())
        && response.returnedFromCache()) {
    metrics.incrementProviderCallsAvoided();
} else {
    metrics.incrementProviderCallsMade();
}
Near misses are not savings. Tenant mismatches are not savings. Model mismatches are not savings. Oracle True Cache reads that still lead to provider calls are not savings.
Also be precise about the provider mode. The benchmark-lite report for this demo is intended to confirm measurement wiring for the configured workload. If that workload uses deterministic or stubbed provider behavior, it is useful for repeatability but is not a live billing report. Unless your generated artifacts include token accounting from a provider-backed run, say “provider calls avoided,” not “tokens saved.”
Read latency by semantic-cache path
Once quality behavior is visible, latency becomes useful. Your validation and benchmark-lite reports record latency with enough context to explain what happened. At minimum, inspect latency by scenario, decision, route, and provider-call count.
Read those values as observations from the workload you ran. They are useful because they prove the harness captures latency by scenario and route. They are not evidence that one path will always be faster than another in your environment. The current benchmark-lite report for the demo is a measurement-wiring check unless you extend it to produce path-level latency summaries with units, sample counts, and route labels.
For your own measurements, break latency into the components you can observe:
- Embedding time matters for semantic paths. Exact-cache lookup can often skip it.
- Database lookup time matters for exact and semantic paths. This is the portion where primary versus Oracle True Cache routing may be relevant.
- Provider time may dominate misses in provider-backed applications, but deterministic mode does not represent live provider behavior unless you configure and measure a live provider run.
- Write-back time appears on misses and on any synchronous event recording path. In this demo pattern, writes are routed through the primary database path.
- Returned-answer time is the end-to-end value your application users experience.
A semantic hit can still be worthwhile even if the cache path adds embedding and database lookup, because it may avoid a provider call that is slower, more expensive, or operationally constrained in your application. A semantic miss can be a latency regression if repeated paraphrases are rare or if the threshold rejects most candidates after doing extra work. That is why misses and near misses belong in the measurement set. Hits alone make a cache look cleaner than it is.
Put Oracle True Cache in the eligible read path
Oracle AI Database stores and queries the semantic-cache records. Oracle True Cache can participate in eligible read-only SQL lookup traffic. The application still owns threshold evaluation, policy approval, and the final reuse decision.
That component boundary matters. Oracle True Cache can be part of the route used to read candidate rows. The semantic-cache decision still comes from vector-aware SQL, deterministic filters, threshold logic, and application policy.
Before interpreting route-level measurements, confirm that the generated validation evidence shows the Oracle True Cache route is queryable. Useful checks include the True Cache database role or open mode, read-only state, application object visibility, and a simple VECTOR_DISTANCE() query through the True Cache service. That evidence proves the route is available for validation checks. It does not prove that every semantic-cache query in every workload belongs on Oracle True Cache, and it does not prove a production performance result.
The boundary is easier to see as a flow:
Request
  -> embedding generation, if semantic lookup is needed
  -> read-only semantic-cache lookup
       -> primary Oracle AI Database 26ai path
       OR eligible Oracle True Cache read path
  -> application threshold and policy checks
  -> cached answer returned, or provider called
  -> cache insert/update routed through the primary database path
The application decision is the same whether the read came from the primary route or the Oracle True Cache route. In this demo architecture, misses, cache inserts, invalidations, and event writes are routed to the primary database path. Oracle True Cache itself is read-only; DML redirection is a separate database capability and is outside the semantic-cache write path described here.
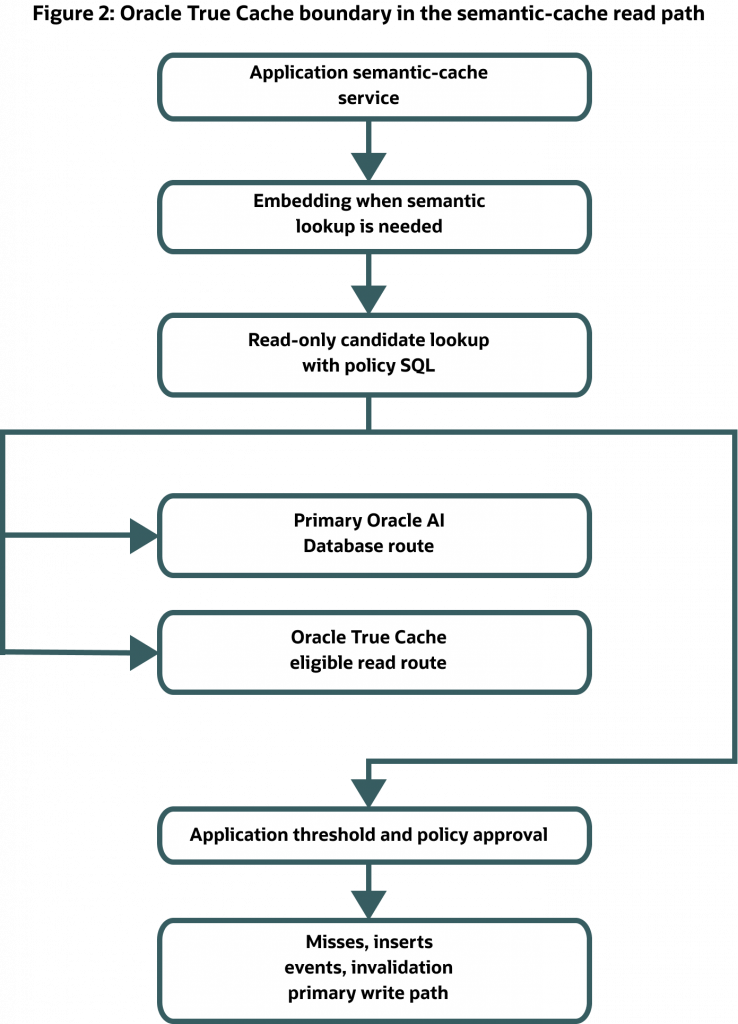
Figure 2. In this demo pattern, Oracle True Cache belongs on eligible read-heavy lookup traffic. Semantic matching still comes from Oracle vector SQL and application policy, while write-back is routed to the primary database path.
There is also a freshness boundary. Oracle True Cache is read-only and consistent, but its data might not be the most current version compared with the primary database at every moment. In a semantic cache, freshness is part of correctness. If an invalidation or source-policy update must take effect immediately, route that check through the primary database path or require a primary-confirmed policy version before reuse.
Use benchmark-lite as a measurement-wiring check
Now run the benchmark-lite script and inspect reports/generated/benchmark-lite-summary.md:
cd semantic-cache-oracle-demo

./scripts/run-benchmark-lite.sh
The benchmark-lite report is a measurement-method check, not a production benchmark. The demo report summarizes the deterministic validation workload with scenario count, provider mode, decision counts, provider-call accounting, approved cache-hit rate, and p50/p95 latency by route.
The script also prints the summary to the terminal:
== Benchmark lite summary ==
This lite report reuses the deterministic validation workload to confirm measurement wiring. It is not a production performance benchmark.
Scenarios: 8
Provider mode: deterministic mock
Embedding mode: deterministic fixture vectors
Decision counts:
- exact-hit: 1
- miss: 5
- near-miss: 1
- semantic-hit: 1
Provider calls made: 6
Provider calls avoided by approved reuse: 2
Cache hit rate for approved exact or semantic reuse: 25.00%
Latency by route:
- primary: samples=5 p50_ms=113 p95_ms=203
- true-cache: samples=3 p50_ms=58 p95_ms=64
Route by scenario:
- seed-miss: decision=miss route=primary provider_calls=1 distance=n/a
- exact-hit: decision=exact-hit route=true-cache provider_calls=0 distance=n/a
- semantic-hit: decision=semantic-hit route=true-cache provider_calls=0 distance=1.622126787093059E-5
- near-miss: decision=near-miss route=true-cache provider_calls=1 distance=0.6798398782881692
- tenant-isolation: decision=miss route=primary provider_calls=1 distance=n/a
- model-mismatch: decision=miss route=primary provider_calls=1 distance=n/a
- source-fingerprint-mismatch: decision=miss route=primary provider_calls=1 distance=n/a
- expired-entry: decision=miss route=primary provider_calls=1 distance=n/a
Generated reports:
- reports/generated/benchmark-lite-events.csv
- reports/generated/benchmark-lite-summary.md
That route-by-scenario block is the part to look at when you want to know whether the request was satisfied from the True Cache read route or had to go back through the primary path:
| Scenario | What happened | Route |
|---|---|---|
seed-miss | No reusable entry existed, so the provider was called and the answer was written through the primary path. | primary |
exact-hit | The scoped prompt hash matched and the provider was skipped. | true-cache |
semantic-hit | The scoped vector candidate passed the threshold and the provider was skipped. | true-cache |
near-miss | The nearest candidate failed the threshold, so the provider was called. | true-cache lookup, then primary write path |
tenant-isolation | Scope rejected reuse for a different tenant. | primary |
model-mismatch | Scope rejected reuse for a different embedding model. | primary |
source-fingerprint-mismatch | Scope rejected reuse for a different source fingerprint. | primary |
expired-entry | TTL filtering rejected the stale entry. | primary |
Here is the important excerpt from the generated summary:
| Report field | Value from the demo run |
|---|---|
| Scenarios | 8 |
| Provider mode | deterministic mock |
| Embedding mode | deterministic fixture vectors |
| Latency units | milliseconds |
| Decision counts | exact-hit: 1, semantic-hit: 1, near-miss: 1, miss: 5 |
| Provider calls made | 6 |
| Provider calls avoided by approved reuse | 2 |
| Approved exact-or-semantic cache-hit rate | 25.00% |
| Primary route latency | 5 samples, p50: 113 ms, p95: 203 ms |
| True Cache route latency | 3 samples, p50: 58 ms, p95: 64 ms |
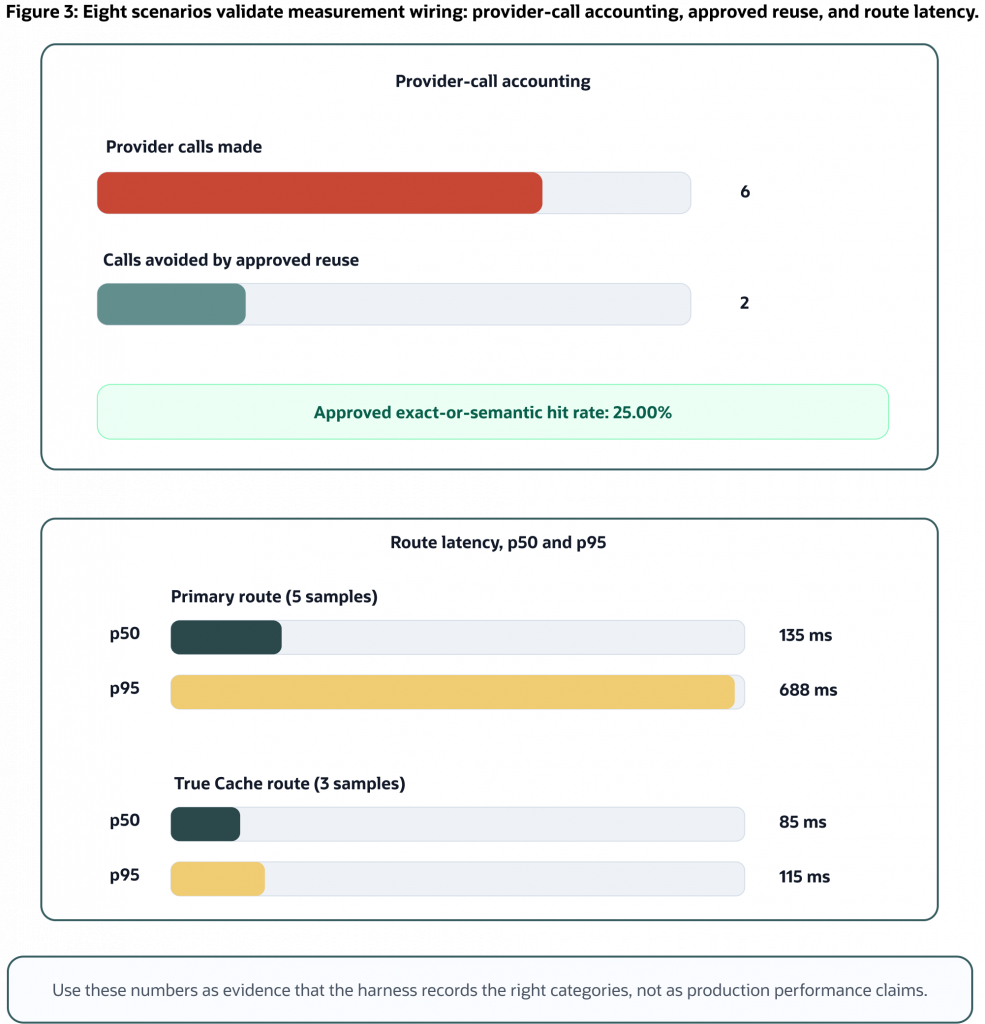
Figure 3: The deterministic benchmark-lite run records provider-call accounting and route latency for the validation workload. It shows measurement wiring, not production performance.
Read that table carefully. It proves that the harness records useful categories and route labels for this deterministic run. It does not prove that True Cache is faster for your workload, that the route samples are comparable, or that the demo represents live provider latency, concurrency, warm-up behavior, token billing, or production traffic mix.
If you extend the harness into a fuller path comparison, use stable labels such as:
no-cacheexact-cachesemantic-cache-primarysemantic-cache-true-cache
The labels in the article, report, scripts, and visuals must match the code path each request actually used.

Figure 4: Read benchmark-lite from evidence to interpretation: quality signals, provider-call accounting, route notes, latency context, and limitations all matter before drawing conclusions.
A production-ready measurement report answers the questions that the demo report only starts to address: what workload ran, whether the provider and embeddings were deterministic or live, which path each scenario used, what units and sample sizes were recorded, whether warm-up and run order were controlled, whether provider calls were made or avoided, whether Oracle True Cache was available and actually used, and which limitations stay visible when someone reads the report later.
If the report does not answer those questions, improve the report before improving the graph.
Adapt the harness to your own prompts
The next step is not to tune for the highest hit rate. The next step is to add representative prompts and inspect the rejected cases.
Start with a small labeled set:
safe paraphrase:
  "How long do I have to return unopened shoes?"
  "What is the return window for shoes I have not worn?"

near miss:
  "Can I return worn shoes after 90 days?"

scope rejection:
  same wording, different tenant
  same wording, different chat model
  same wording, different source fingerprint or policy version
Then change one thing at a time. Change one threshold or policy setting, rerun validation, compare the generated validation summary, and rerun benchmark-lite only after the quality behavior still looks safe.
Use the same scripts:
cd semantic-cache-oracle-demo

./scripts/run-validation.sh
./scripts/run-benchmark-lite.sh
For the same fixture, embedding model, and distance metric, a stricter threshold usually reduces semantic approvals and increases misses or near misses. A looser threshold may increase approvals, but it can also admit unsafe reuse. Policy filters reject candidates that are semantically close but unsafe across tenant, model, prompt-template, source, policy, status, or time-to-live boundaries.
Tune quality first. A threshold that improves hit rate while returning unsafe answers is a regression.
Practical interpretation rules for semantic-cache reports
When you review your generated reports, require labeled near misses. If the workload only contains obvious hits, it cannot tell you whether the cache is safe.
Separate exact hits from semantic hits. Exact hits are usually cheaper because they can avoid embedding and vector lookup. Semantic hits are valuable when paraphrased repetition is common enough to justify the extra work.
Count provider-call avoidance only after approved reuse. A rejected vector candidate is not a hit. An Oracle True Cache lookup that still leads to a provider call is not a saved provider call.
Keep route evidence visible. If you plan to use Oracle True Cache, the report shows which requests used the True Cache read route and which write operations were routed to the primary database path.
Keep benchmark-lite limitations in the report itself. A deterministic local workload is useful for wiring and behavior. Production benchmarking needs representative prompts, realistic provider mode, concurrency, warm-up, isolation, run order, sample sizes, latency distribution, route validation, and operational monitoring.
These rules may sound conservative, but they make the cache easier to trust. The goal is not to make the demo look fast. The goal is to make the reuse decision observable.
Conclusion: make semantic caching measurable before making it faster
A semantic cache helps when it safely avoids work the application would otherwise repeat. That means correctness and cost have to be measured together.
Start with validation. Prove that exact hits, semantic hits, misses, near misses, tenant isolation, model mismatch, source-fingerprint mismatch, and expired-entry rejection behave differently. Then inspect provider-call accounting. Count avoided calls only when approved reuse returns the cached answer. Then read latency by path, not as one blended number. Finally, decide whether Oracle True Cache belongs in the eligible read-heavy lookup path for your workload.
The demo gives you a compact starting point:
cd semantic-cache-oracle-demo

./scripts/run-validation.sh
./scripts/run-benchmark-lite.sh
After that, replace the fixture prompts with representative traffic from your application. Keep the generated reports under review, and tune the threshold and policy rules before chasing latency improvements.
A semantic cache is only useful when it is both safe and cheaper than generation. Measure those two things together.