Datasets are a great alternative to Saved Searches that provide input for all Workbook visualizations in your account. You can create a new dataset from the Analytics Home page or from the Dataset Panel within a workbook visualization. Once a SuiteAnalytics Workbook is created, you can generate real-time, interactive reports and visualizations. One features that is often overlooked is the ability to join multiple datasets together. This allows you to link and analyse data across related record types, such as customers, employees, transactions, and custom records.
Once multiple datasets are linked, you can combine transactional and summary-level data. You can also create dashboards that allow you to view multi-dimensionally (e.g., “Which sales reps are closing the most revenue by product weight?”).
Steps to Connect Two Datasets in SuiteAnalytics Workbook:
1. Create or Open a Workbook
Navigate to Analytics > Workbooks > New Workbook or open an existing workbook.
Choose your primary dataset — this is typically the base record you’re starting from, like Transaction or Customer.
2. Linking a Dataset
Once you’re in the workbook editor:
• Click the “Datasets” panel on the left.
• Choose “+ Add Dataset” to bring in a second dataset.
• You’ll see a list of available datasets. Select one that relates to the first (e.g., if you started with Transactions, choose “Customer” or “Sales Rep”).
3. Defining the Join Relationship
After adding the second dataset, define the join relationship between the datasets. This is typically based on ID fields, like Customer ID, Employee ID, or Item ID. SuiteAnalytics uses primary key-foreign key relationships to link two records together. For example: joining Transactions.Vendor to Vendor.ID on the Vendor Record or joining Transactions.SalesRep to Employee.ID on the Employee Record.
4. Use Fields from Both Datasets
To work with your data as a unified whole, begin by dragging and dropping the required fields from both datasets into your workbook. Once combined, you can create new calculated fields that utilize values from across the different datasets. This integrated data can then be filtered, grouped, and visualized together, allowing for analysis as a single, interconnected set.
This lets you do things like:
· Analyze Vendors by item category
· Merge custom record data with standard transaction reports
· Compare customer activity and promotional campaigns
Example
Use case: You want to see average Company Size of your Customers for each Transaction Year.
The Transaction Year is pulled from the Transaction Dataset but the Company Size needs to be pulled from a Customer Dataset.
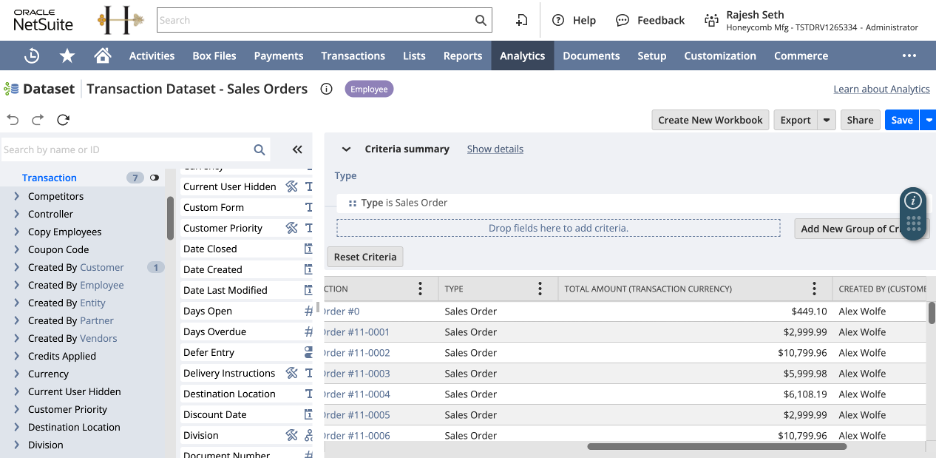
• Dataset 1: Transaction (Sales Orders)
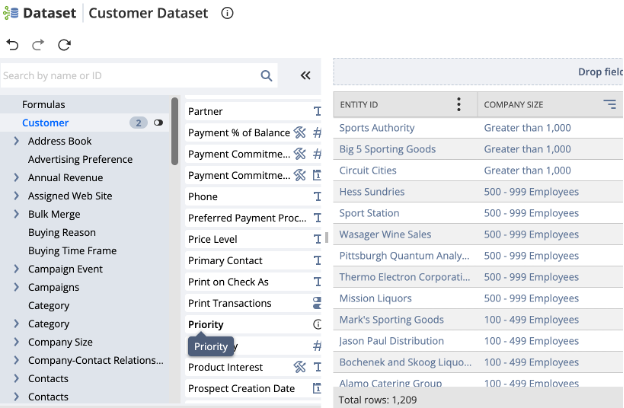
• Dataset 2: Customer
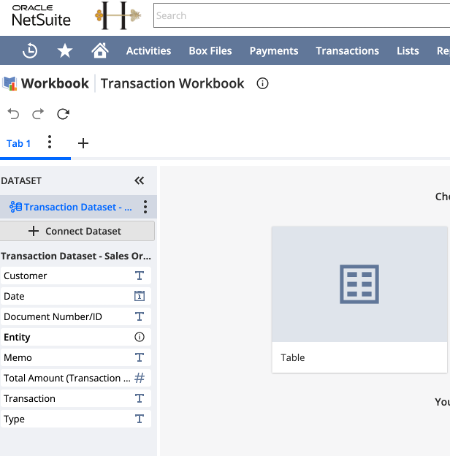
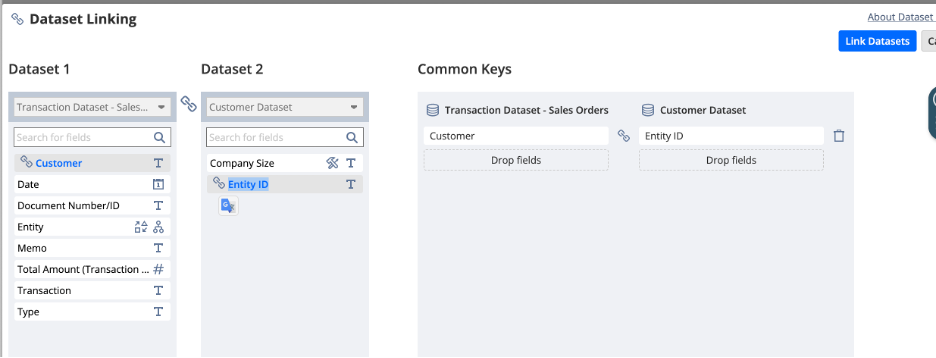
When creating the Workbook, select “+ Connect Dataset” to join: Transaction.Customer to Customer.EntityID
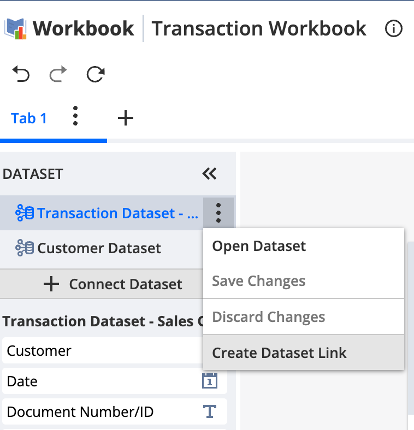
Once both Datasets have been added to the Workbook, Select Create Dataset link
Map the Primary-Foreign Key relationship.
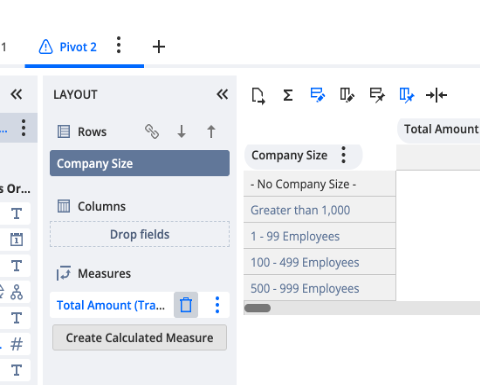
Create a new pivot. You now have access to fields from both tables and can analyse total amount for each company size category.
Summary
This post demonstrates how to join two datasets in SuiteAnalytics Workbook to create more comprehensive reports. By linking datasets through primary-foreign key relationships, users can combine data from different record types (like transactions and customers) into a single workbook. The guide provides a step-by-step walkthrough: creating a workbook, adding a second dataset, defining the join relationship using ID fields, and utilizing fields from both datasets for analysis. The example shows how to analyze average customer company size by transaction year, combining Transaction and Customer datasets to create insights that wouldn’t be possible with a single dataset alone.
